0232
Deuterium metabolic imaging (DMI) of glucose metabolism in pregnant preeclamptic mice at 15.2 tesla.1Department of Chemical and Biological Physics, Weizmann Institute of Science, Rehovot, Israel, 2Center for Magnetic Resonance in Biology and Medicine, Marseille, France, 3Department of Biological Regulation, Weizmann Institute of Science, Rehovot, Israel
Synopsis
Deuterium Metabolic Imaging (DMI) was used to follow metabolism in wildtype and l-NAME induced preeclamptic pregnant mice, after intravenous administration of 2H6,6’-glucose. Maps for 2H6,6’-glucose and its metabolic products 2H3,3’-lactate and 2H-water were measured over 2 hours by 2H CSI at 15.2 tesla. 2H-water was generated as main metabolic product in fetoplacental units; placentas and fetal organs also generated 2H3,3’-lactate, but this was not detected in other maternal organs. Lactate levels were more elevated and its clearance was slower in preeclamptic fetuses than in healthy controls. DMI thus may aid in development and monitoring of future intervention for early preeclampsia.
INTRODUCTION
Recent magnetic resonance studies have concluded that deuterated metabolites possess highly desirable properties for mapping, non-invasively and as they happen, glycolysis and other biochemical processes in animals and humans. A promising avenue of this deuterium metabolic imaging (DMI) involves looking at the fate of externally administered 2H6,6’-glucose, as it is taken up and metabolized into different products as a function of time.1-6 In this study we employed DMI to examine and compare the metabolism of pregnant mice, both healthy controls and preeclamptic models.METHODS
Mice were catheterized in their tail-veins, and positioned sidewise in a Bruker Biospec at 15.2T MRI scanner running under Paravision 6. A “sandwich”coil setup was used for scanning, whereby a 20x45 mm Bruker 1H butterfly surface coil tuned to 650 MHz was placed underneath the mouse, and a 20 mm single-loop surface coil tuned to 2H’s 99.8 MHz Larmor frequency was placed on top of the mouse abdomen. Preeclamptic pregnant mice (n=9) and wildtype pregnant controls (n=9) were obtained according to a published protocol using the vasoconstrictor l-NAME.7 1H anatomical images were collected using a FLASH sequence involving 28-38 slices, 0.5 mm slice thickness, and an in-plane resolution of 0.2 mm with FA 20°, TE 2.8 ms, TR 270 ms. For DMI, animals were intravenously administered 99.5% enriched 2H6,6’-glucose in PBS, at a dose of 2.3 g/kg body as a single bolus injection of 0.25 mL within 60 sec. Non-localized 2H MRS data sets were acquired with FA ≈20°, 100 ms FID acquisition time, 0 ms recycle delay, 128 transients. Spatially-resolved 2H MRSI data were collected using a k-weighted chemical-shift imaging sequence from Paravision 6, collecting 320 signal averages for the center of k-space and progressively less for its periphery. This generated a data set every ~8 min using slice-selective flip-angles of ≈90°, 60 ms acquisition times, 8x8 k-matrices (subsequently zero-filled to 32x32 elements) sampled on a Cartesian grid, and repetition times TR = 95 ms. In-plane fields-of-view were 45x45 mm2 and slice thicknesses varied between 4-8 mm, and they were tuned to ensure they contained several relevant fetoplacental units. 2H MRSI data were reconstructed in Matlab using custom written code. Non-localized 2H MRS and slice-selective 2H MRSI sets were acquired in alternated, interleaved blocks spaced ~15-20 minutes, starting from before and continuing for ca. 120 minutes after deuterated glucose injection.RESULTS
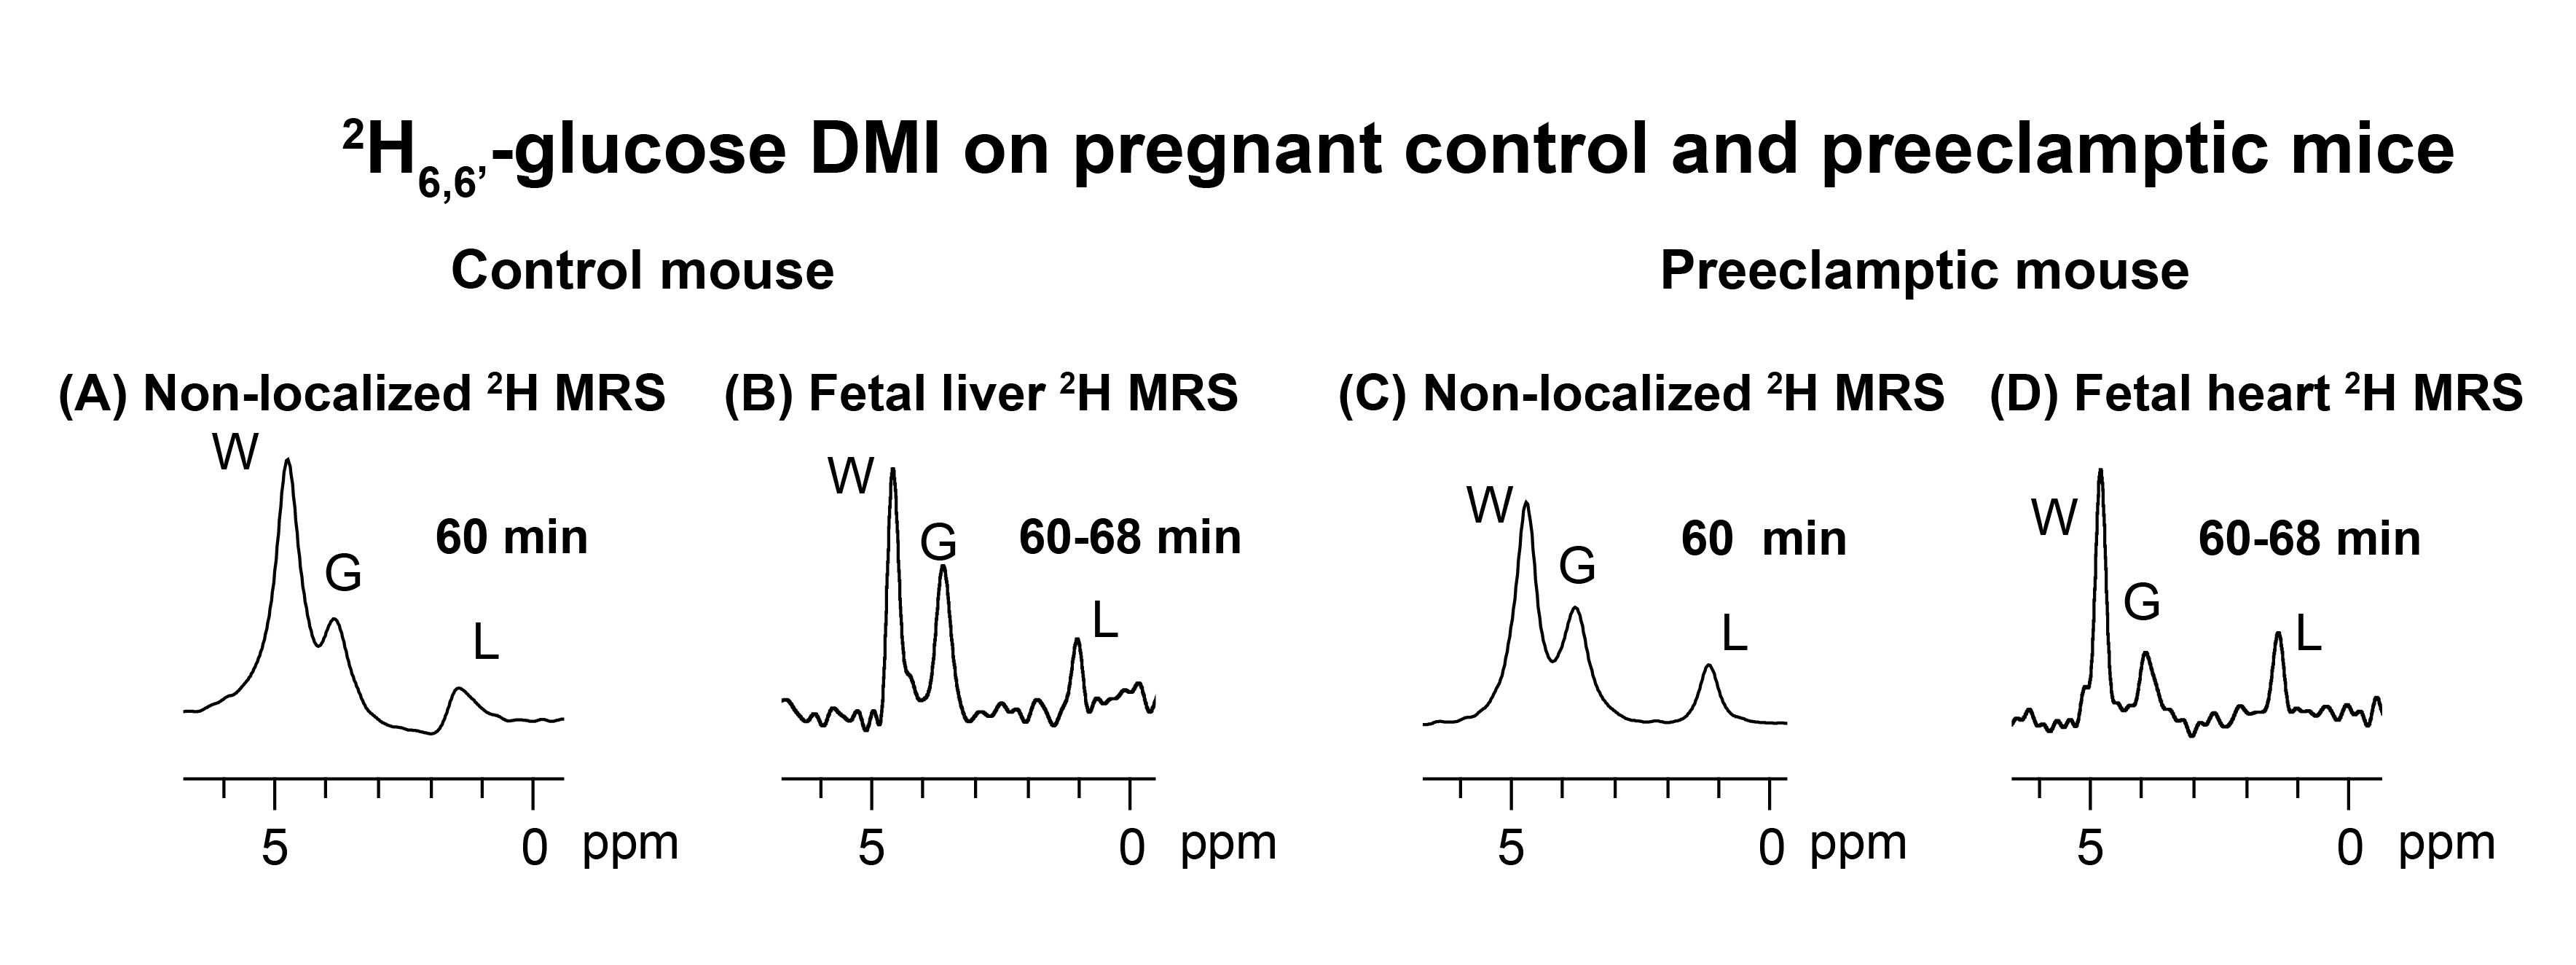
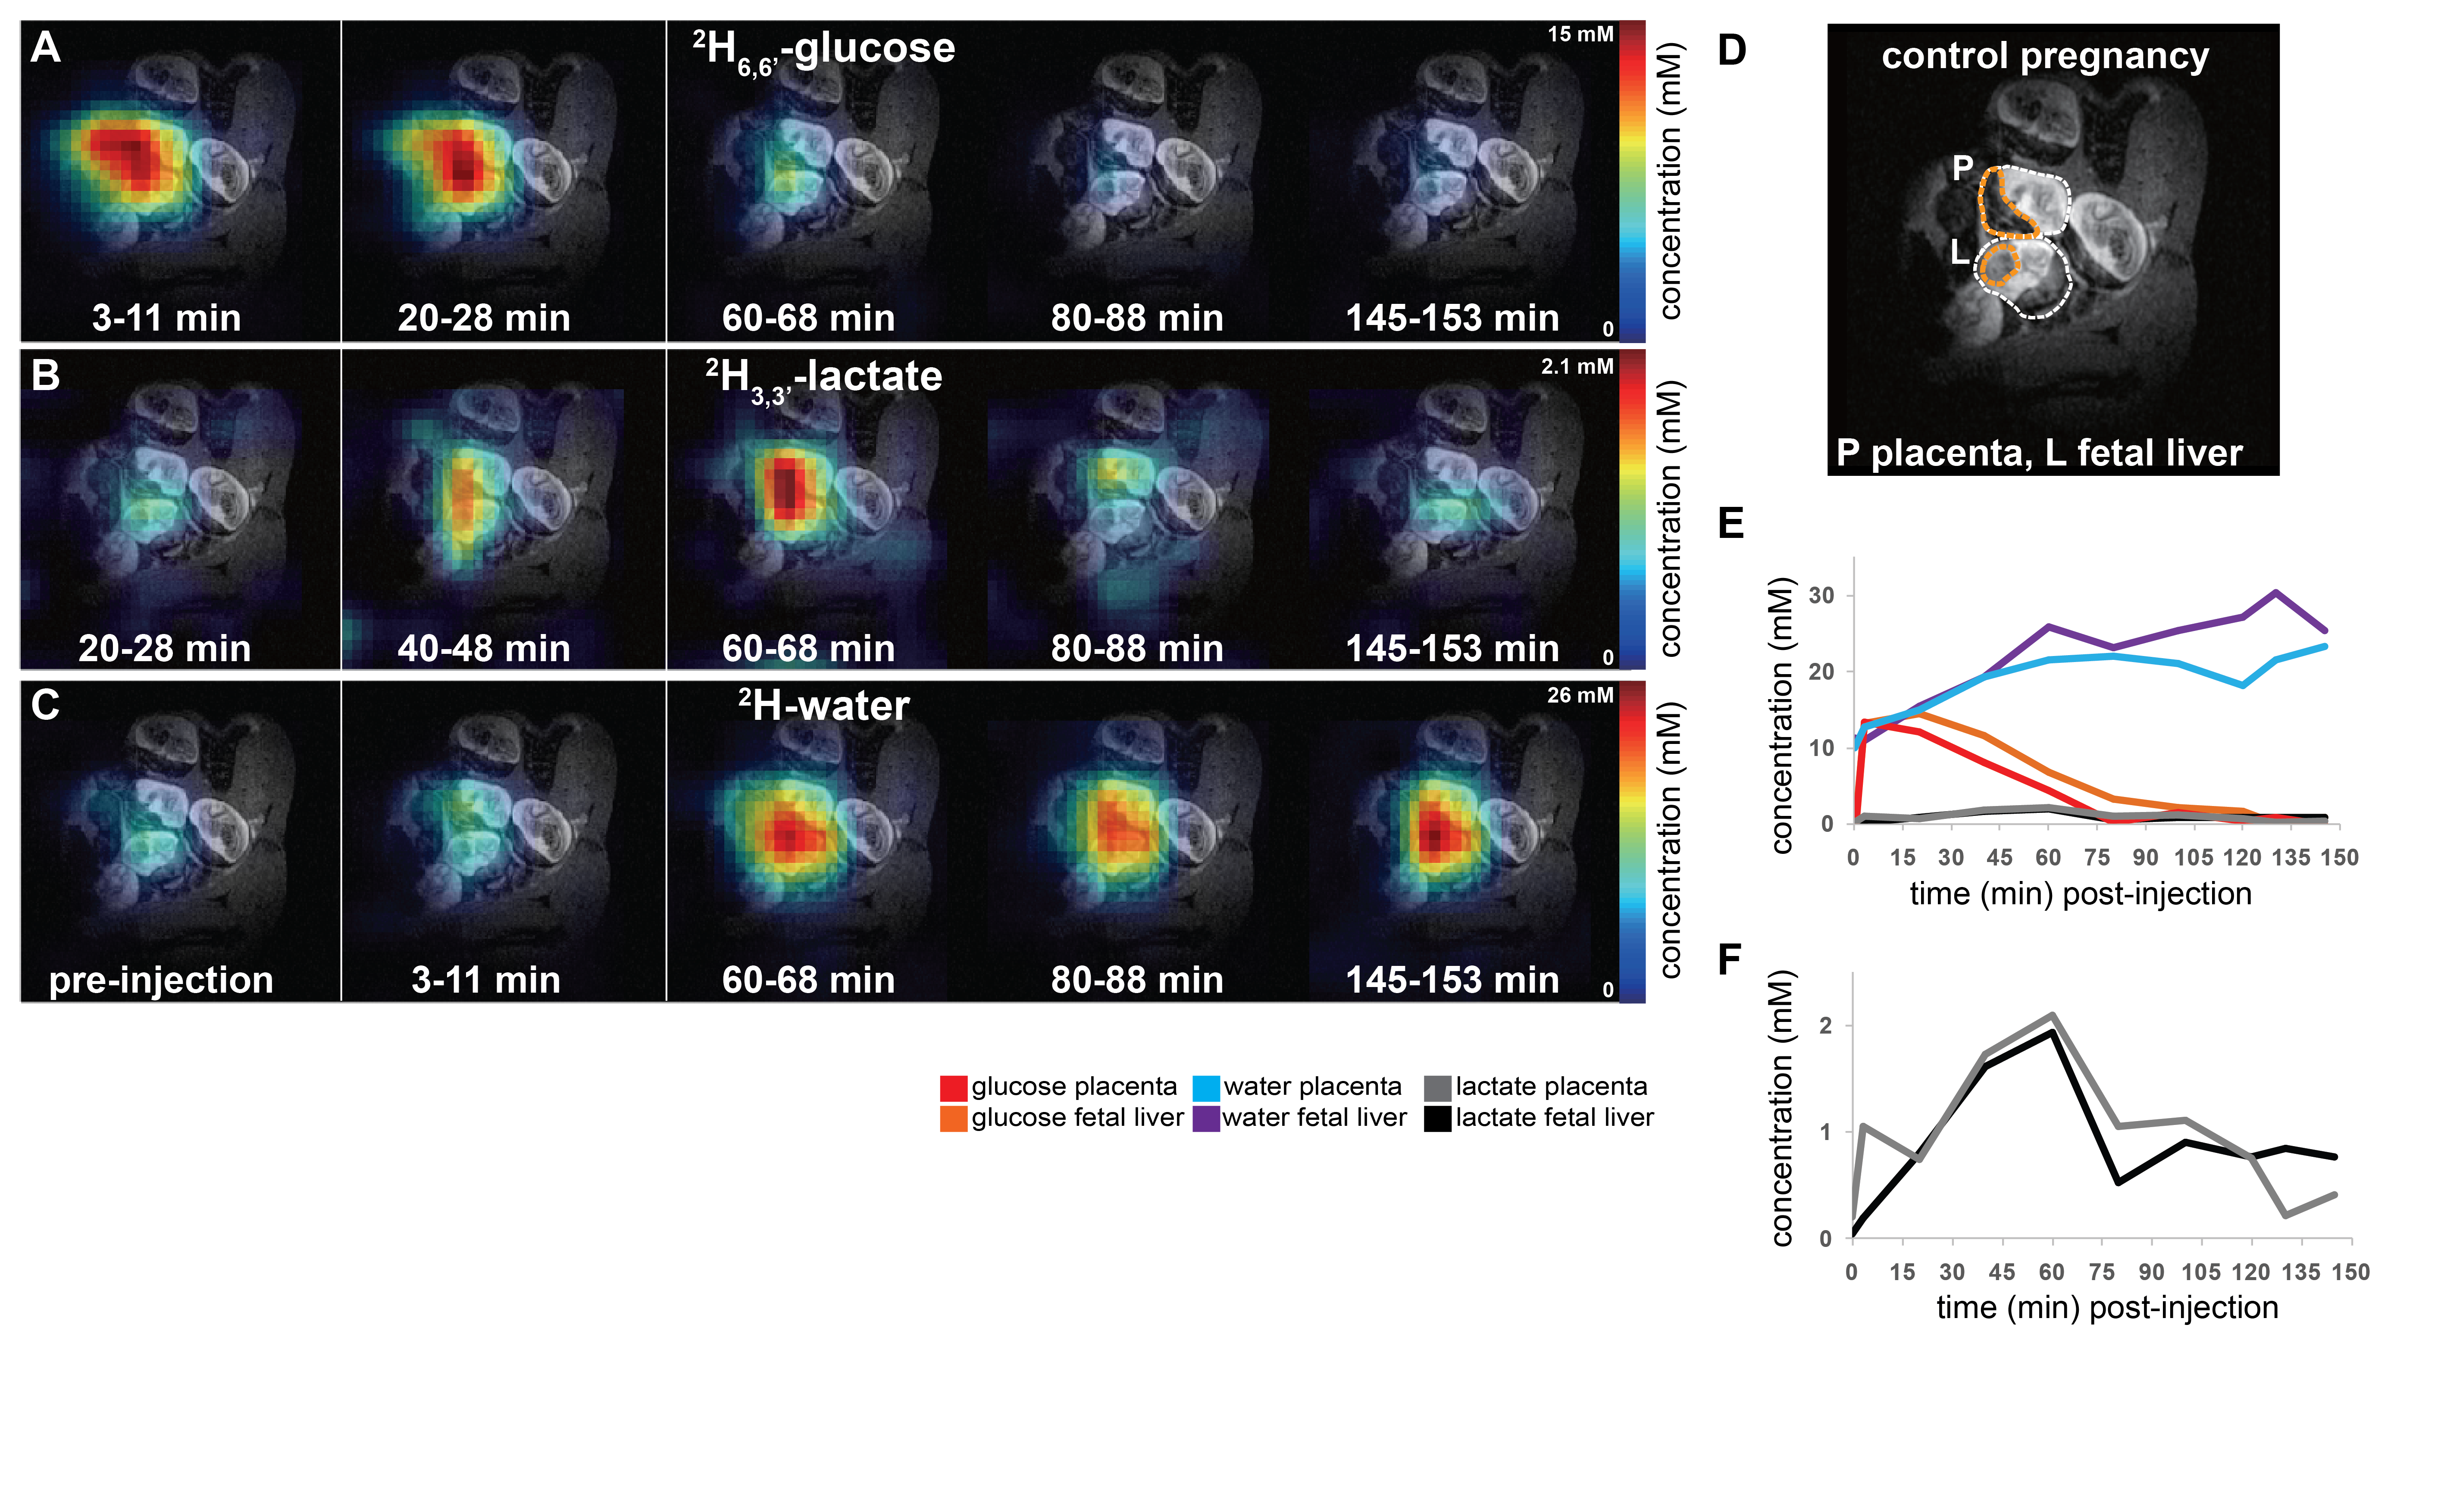
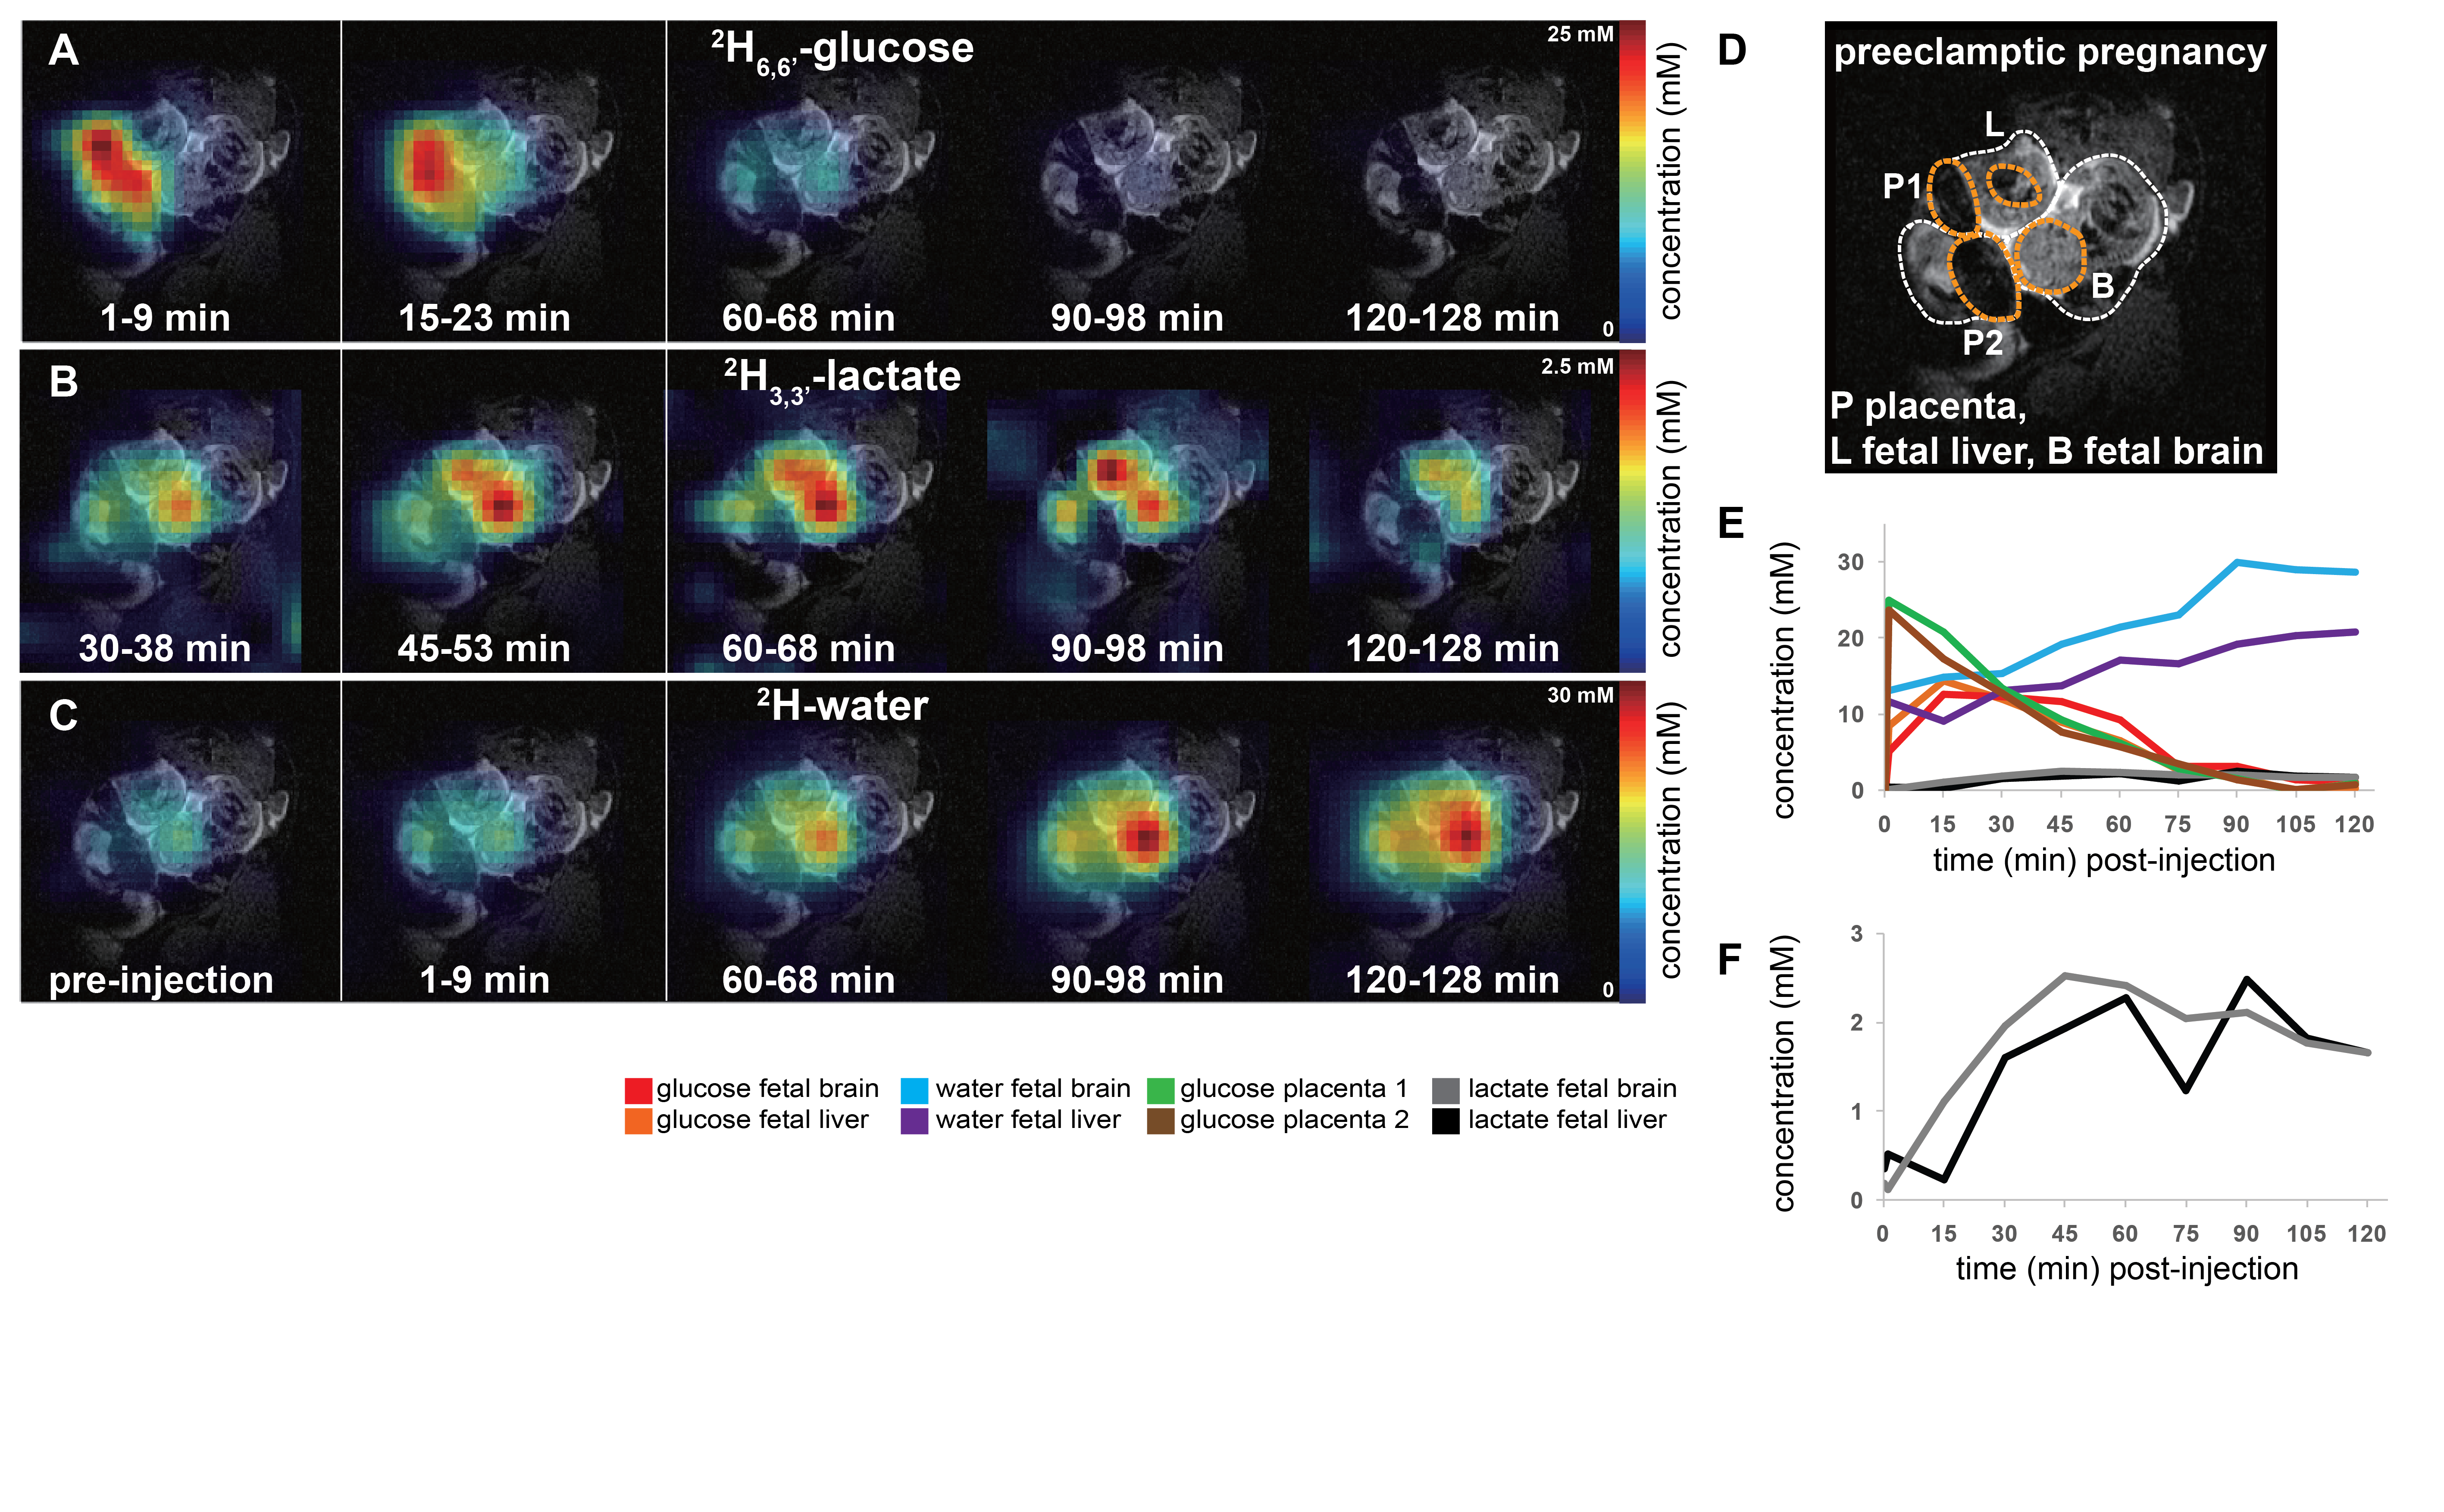
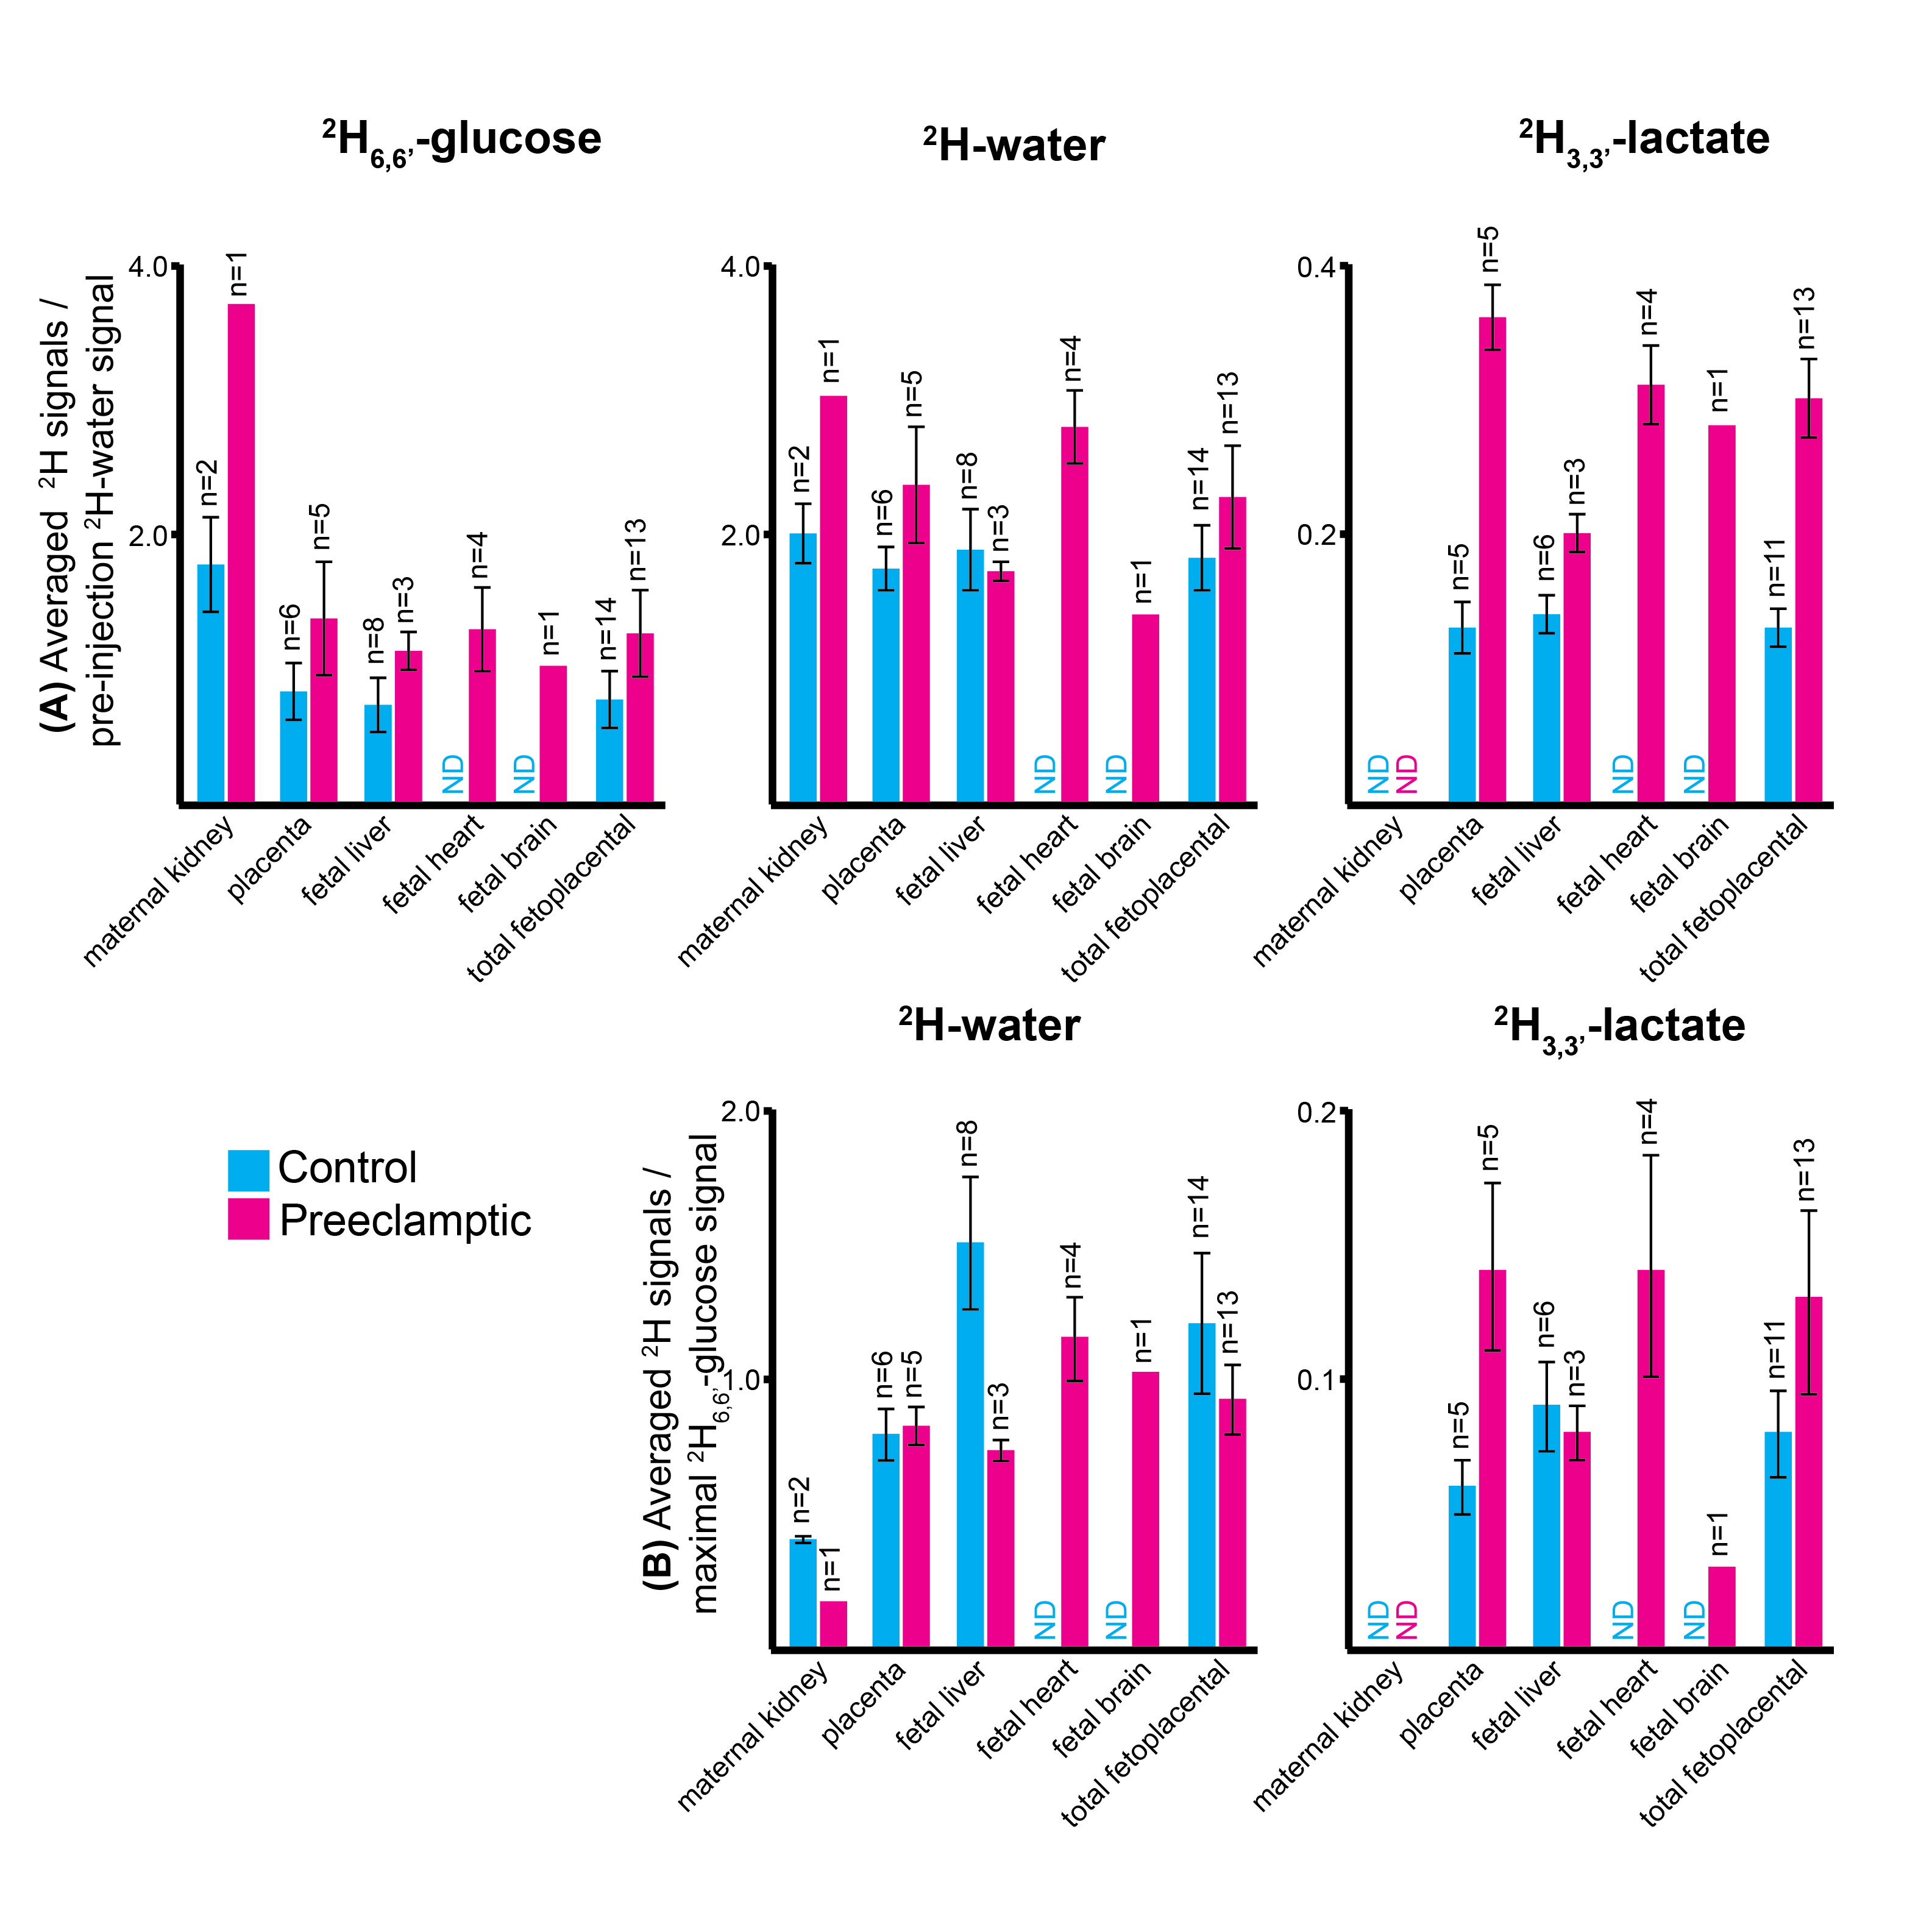
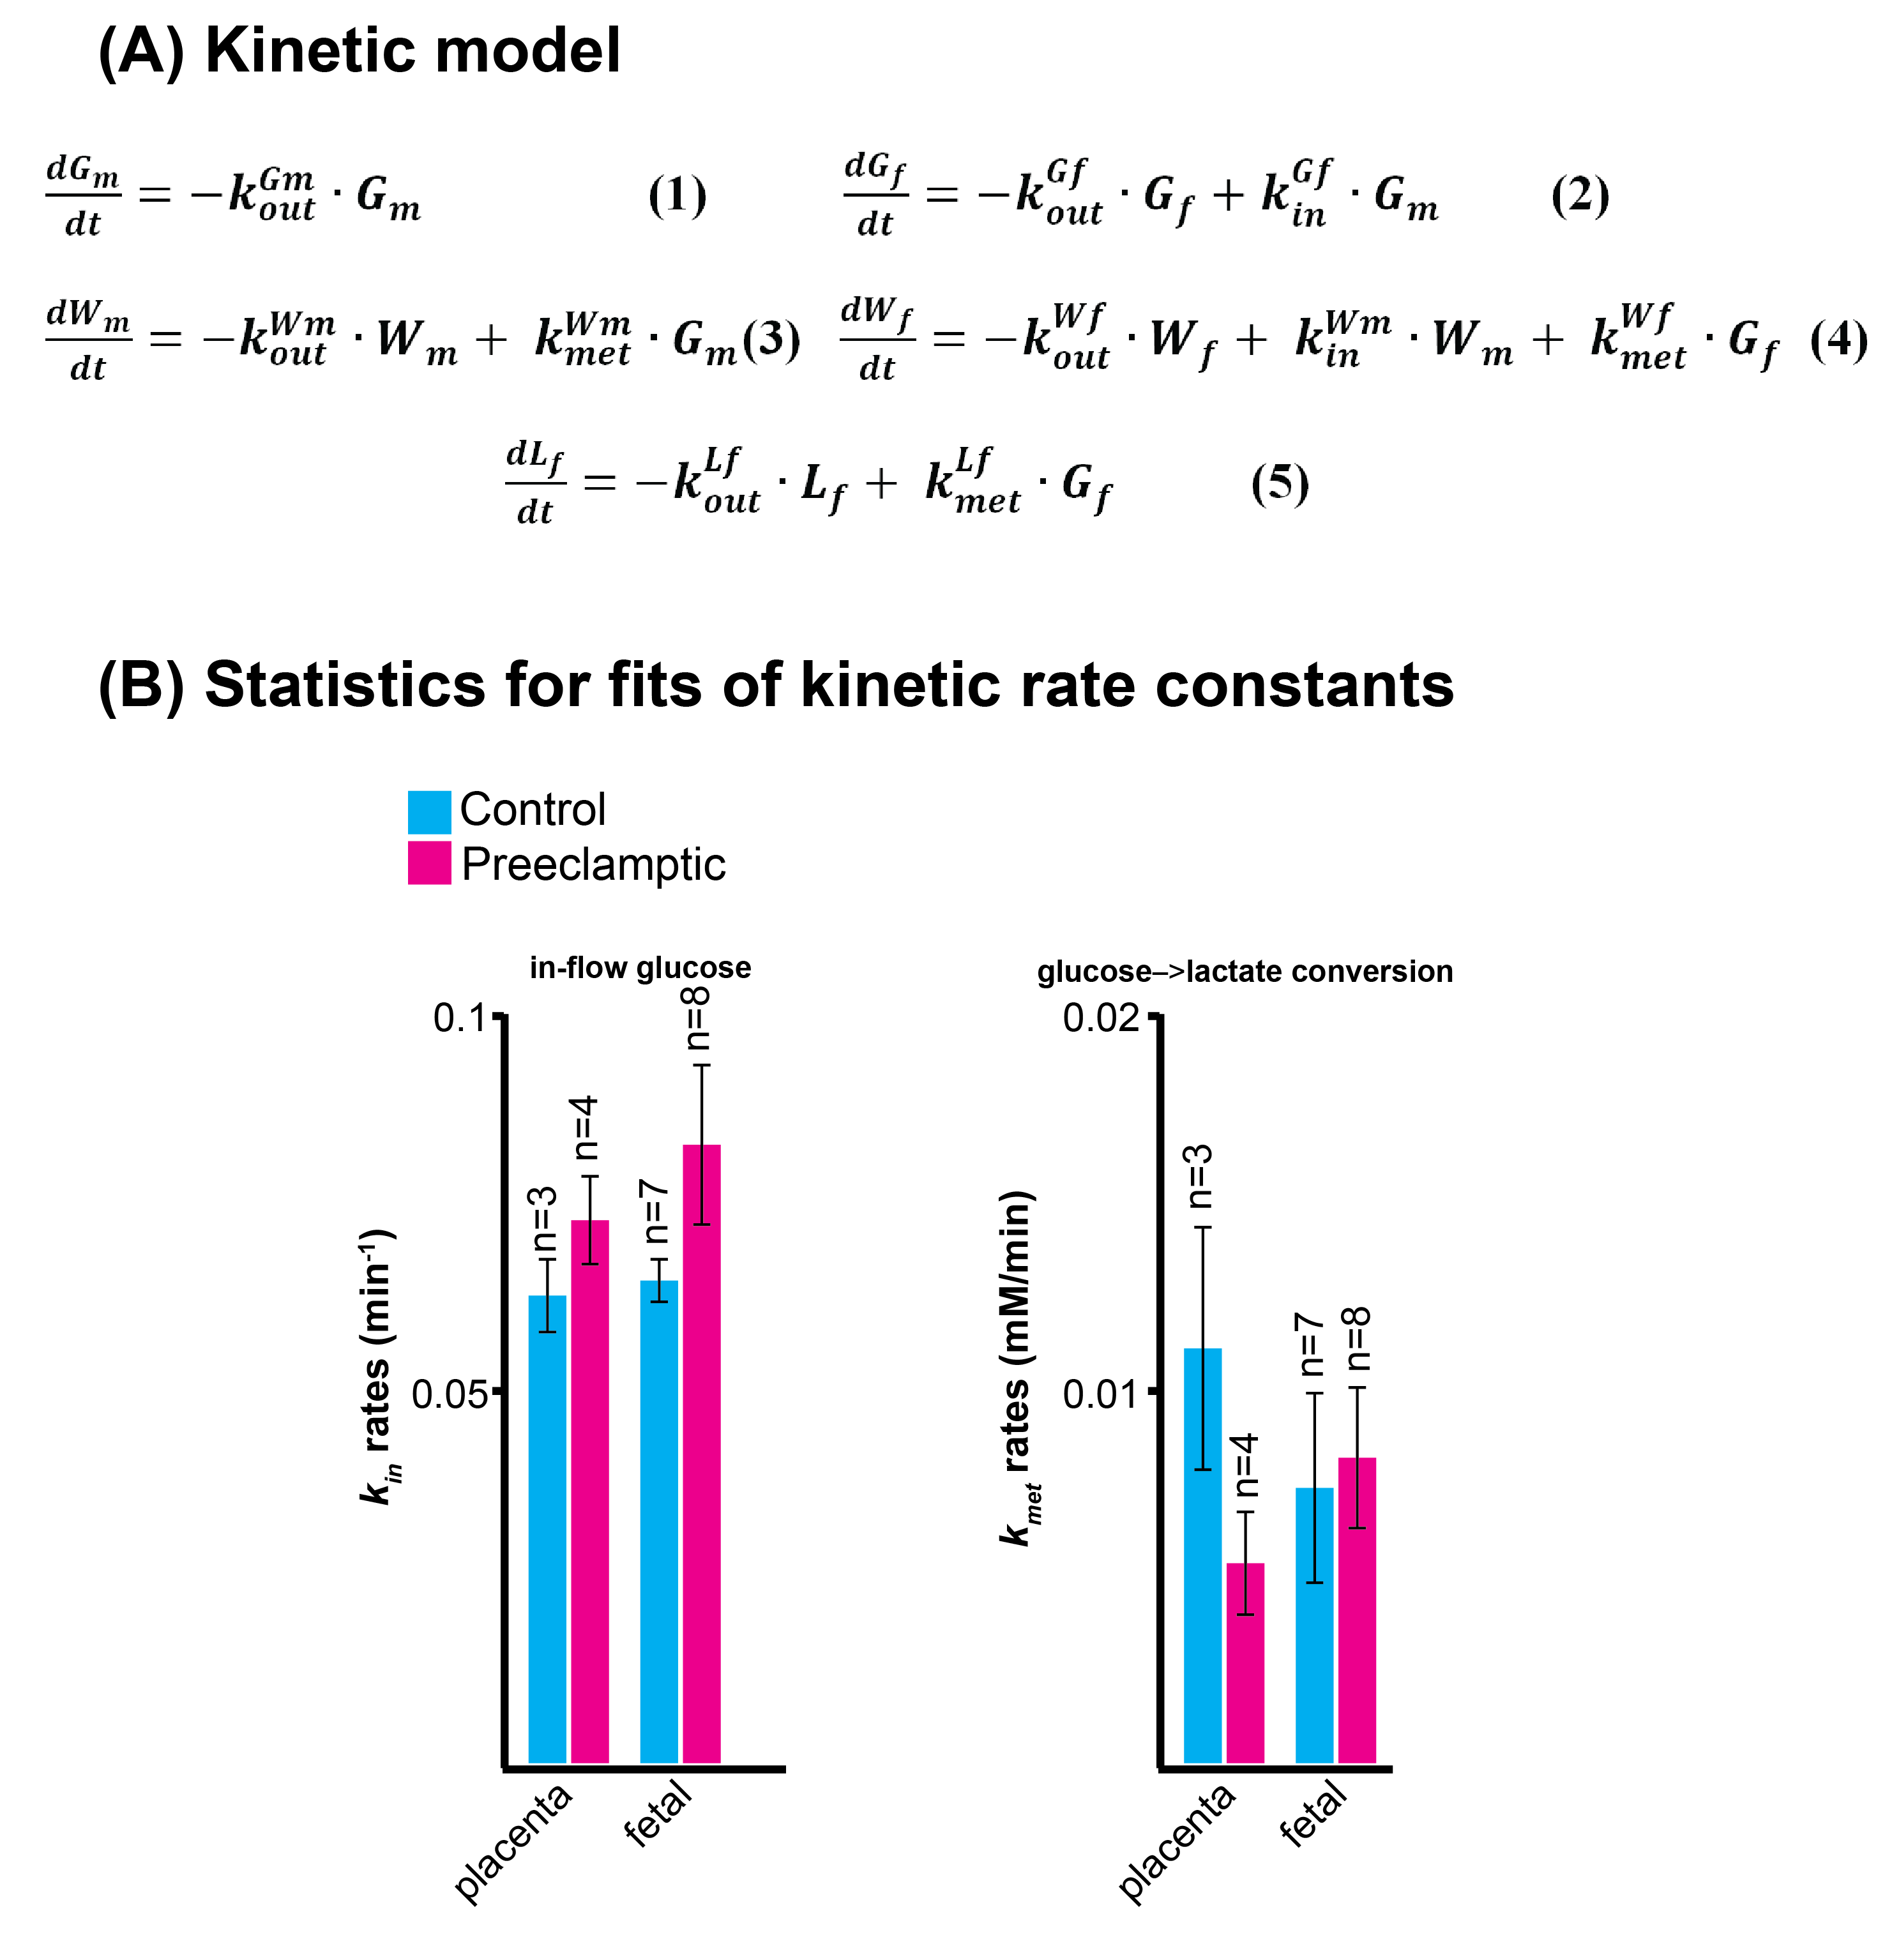
Non-localized 2H MRS (Figures 1A, 1C) and localized 2H MRSI (Figures 1B, 1D) spectra recorded after 2H6,6’-glucose injection show formation of 2H3,3’-lactate and 2H-water, with good sensitivity and spectral resolution in both control and preeclamptic mice. No lactate could be detected for maternal organs outside the fetoplacental units. Figure 2 shows 2H MRSI data on a control pregnant mouse. Right after injection 2H6,6’-glucose is detected mainly in the placenta and fetal liver (Figure 2A); as this peak gradually washes out from these organs, 2H-water is detected throughout the traces: prior to injection at its natural abundance level, and thereafter constantly increasing as a result of 2H6,6’-glucose’s metabolism –once again, mainly in the placenta and in the fetal liver (Figure 2C). Lactate production can also be observed in these organs, reaching a maximum ~60 minutes after injection and subsequently washing out (Figures 2B). The naturally abundant 10 mM 2H-water signal allows one to translate all these changes into quantitative, organ-selective metabolic changes, as depicted in Figures 2E, 2F. Figures 3A-3F present comparable DMI data following the injection of 2H6,6’-glucose, for a preeclamptic pregnant mouse. The trends and kinetic signatures of the metabolites are qualitatively similar as the controls. However, a quantitative evaluation of n=9 control and n=9 preeclamptic pregnancy datasets (each one containing multiple fetoplacental units) reveals that lactate levels in the preeclamptic pregnancies are higher than in the control counterparts (Figure 4). 2H3,3’-lactate also appears in additional fetal organs, for instance in the fetal brain and fetal liver, and seems to last longer than in the control cases. To translate these observations into metabolic insight, the data in the DMI traces were fit to the solutions of a simple kinetic model cast on the basis of the differential equations shown in Figure 5A.Here Gm, Wm, Gf, Wf, Lf are time-dependent functions describing the intensities for the various peaks in the maternal (e.g., kidney) or the fetoplacental organs, and kinX , and kmetX are constants describing the signal decay (due to combined outflow and metabolic effects), the inflow and the metabolic generation of analyte X. Analytical solutions to these differential equations were found for initial water and glucose concentrations; using these solutions various features could be identified (Figure 5B), including a statistically significant increase in the glucose placental perfusion of preeclamptic animals in comparison to controls.
CONCLUSIONS
DMI provides a minimally-invasive approach serving research –and potentially diagnostic– purposes, even in complex, delicate cases like pregnancies. DMI’s reporting potential was here explored by 2H6,6’-glucose injections, whose spatial incorporation into various maternal and fetoplacental mice organs could be successfully mapped, and metabolic transformation into water and lactate as resulting from Krebs and glycolytic pathways followed.Acknowledgements
Support from NIH grant R01HD086323, Israel Science Foundationgrant 795/13, and the Clore and Kimmel Institutes for MagneticResonance (Weizmann Institute), are acknowledged.References
(1) M. Lu, X. H. Zhu, Y. Zhang, G. Mateescu, W. Chen, Quantitative assessment of brain glucose metabolic rates using in vivo deuterium magnetic resonance spectroscopy. Journal of cerebral blood flow and metabolism : official journal of the International Society of Cerebral Blood Flow and Metabolism 37, 3518-3530 (2017).
(2) H. M. De Feyter, K. L. Behar, Z. A. Corbin, R. K. Fulbright, P. B. Brown, S. McIntyre, T. W. Nixon, D. L. Rothman, R. A. de Graaf, Deuterium metabolic imaging (DMI) for MRI-based 3D mapping of metabolism in vivo. Science Advances 4, eaat7314 (2018).
(3) F. Kreis, A. J. Wright, F. Hesse, M. Fala, D.-e. Hu, K. M. Brindle, Measuring Tumor Glycolytic Flux in Vivo by Using Fast Deuterium MRI. Radiology 294, 289-296 (2019).
(4) M. J. Riis-Vestergaard, C. Laustsen, C. Ø. Mariager, R. F. Schulte, S. B. Pedersen, B. Richelsen, Glucose metabolism in brown adipose tissue determined by deuterium metabolic imaging in rats. International Journal of Obesity 44, 1417-1427 (2020).
(5) R. A. de Graaf, A. D. Hendriks, D. W. J. Klomp, C. Kumaragamage, D. Welting, C. S. Arteaga de Castro, P. B. Brown, S. McIntyre, T. W. Nixon, J. J. Prompers, H. M. De Feyter, On the magnetic field dependence of deuterium metabolic imaging. NMR in Biomedicine 33, e4235 (2020).
(6) C. von Morze, J. A. Engelbach, T. Blazey, J. D. Quirk, G. D. Reed, J. E. Ippolito, J. R. Garbow, Comparison of hyperpolarized 13C and non-hyperpolarized deuterium MRI approaches for imaging cerebral glucose metabolism at 4.7T. Magnetic Resonance in Medicine 2020;00:1-10.
(7) Q. Bao, R. Hadas, S. Markovic, M. Neeman, L. Frydman, High resolution diffusion and perfusion MRI maps of normal, preeclamptic and growth-restricted mice models reveal clear fetoplacental differences. Scientific Reports 10, 1-12(2020).
Figures