0231
Deuterium Echo-Planar Spectroscopic Imaging (DEPSI) to Dynamically Monitor Deuterated Glucose in the Liver at 7T1University of Medical Center Utrecht, Utrecht, Netherlands
Synopsis
Deuterium Echo-Planar Spectroscopic Imaging (DEPSI) is proposed as a way to increase the spatial and temporal resolution of deuterium metabolic imaging (DMI) at 7T. Typically, DMI uses traditional, slow MRSI sequences, which cannot capture rapid dynamic metabolic processes in large organs with sufficient spatial and/or temporal resolution. With DEPSI, in vivo glucose metabolism of the liver could be monitored after intake of [6,6′-2H2]-glucose with 20 mm nominal voxel size, full liver coverage, and a scan time of less than 10 minutes. DEPSI was combined with Hamming weighted acquisition in the phase encoding directions to maximize SNR.
Introduction
Deuterium metabolic imaging (DMI) is an emerging technique to spatially map in-vivo metabolism non-invasively through the intake of deuterated substrates (such as [6,6′-2H2]-glucose). It has been demonstrated that DMI can detect differences in glucose metabolism in tumor and healthy brain tissue in vivo (1). Knowing the disturbances in metabolic pathways in diseases such as cancer, diabetes, and neurodegenerative processes can help develop clinical treatments or pharmaceuticals. However, deuterium (i.e., 2H or D) magnetic resonance spectroscopic imaging (MRSI) in 3D uses conventional phase encoding schemes that are time-consuming. Alternatively, the echo-planar imaging (EPI) readout train in MRSI enables the acquisition of the time signal of several k-space voxels in a row instead of one k-space voxel at a time. EPI is commonly used in imaging (2,3) and has also been applied for MRSI of 31P (31P EPSI (4–6)), 13C (7), and 1H (PEPSI (8)). The echo-planar spectroscopic imaging (EPSI) sequence is particularly suited for application in deuterium studies, since there are generally only a few signals visible in the deuterium spectrum (all in the range between 1 and 5 ppm, i.e., a bandwidth of 183 Hz at 7T), making the demands on spectral bandwidth lower than for 31P and 1H. This study aims to implement deuterium echo-planar spectroscopic imaging (DEPSI) to be able to monitor the dynamic behavior of metabolic processes with higher temporal and spatial resolution. To compensate the loss of SNR at high accelerations, a Hamming weighted k-space acquisition was applied over the signal averages (NSA) in the two phase-encoded directions.Methods
Three healthy volunteers and a phantom containing water and acetone were scanned in a 7T MR scanner (Achieva, Philips, the Netherlands) using the built-in gradient system (maximum of 40 mT/m gradient strength, 200 mT/m/ms slew rate) and a transmit-receive body array containing 4 proton dipole arrays and 4 deuterium loop coils. In the first two volunteers, deuterium was measured at natural abundance concentrations (without deuterium intake). For the third volunteer, DEPSI scans were acquired 2 hours and 3 hours after oral intake of deuterated glucose (50g [6,6'-2H2]-glucose dissolved in water). The phantom contained 50% acetone and 50% water (with naturally abundant deuterium, no enrichment). Before acquiring the DEPSI scans, 1H B0 maps were made to perform second-order B0 shimming. Anatomical 1H MRI images and Dixon scans were acquired to plan the DEPSI scans.Sequence design, data acquisition, and reconstruction
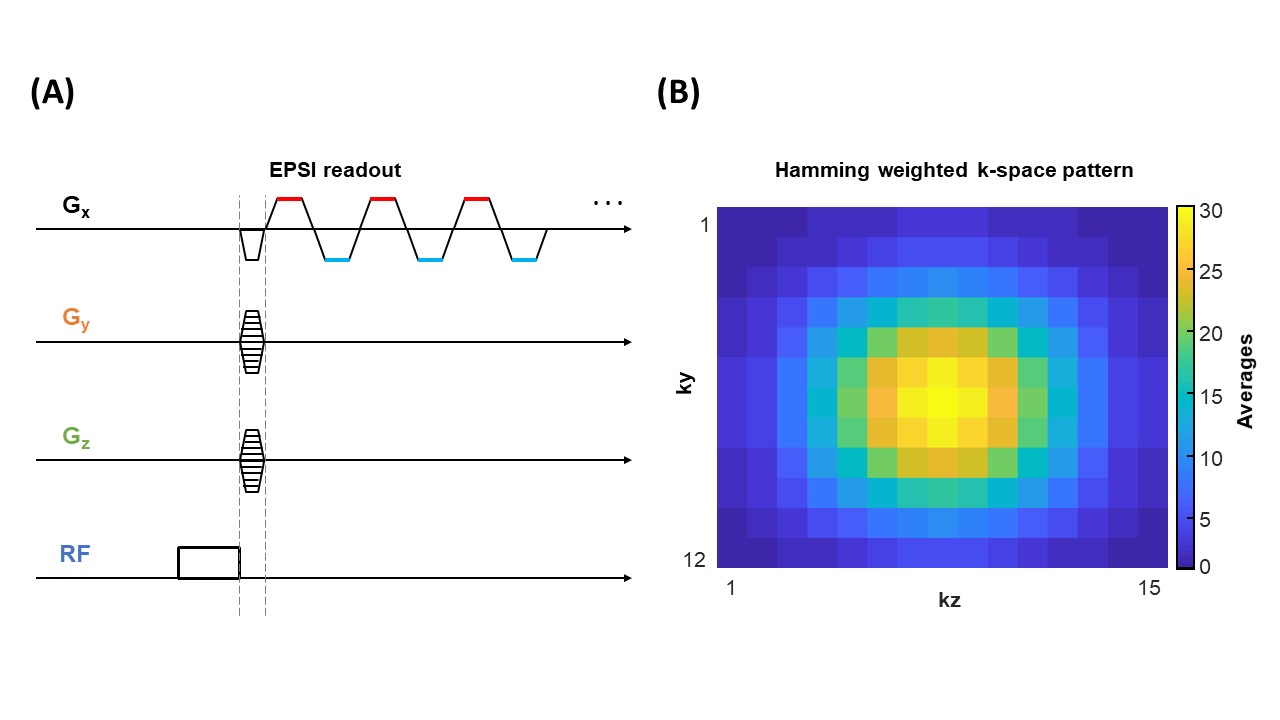
The DEPSI sequence (Fig. 1A) was implemented with 512 alternating trapezoidal-shaped gradients. Data points were acquired during the gradient plateaus. A Hamming weighted acquisition pattern (Fig. 1B) was applied over the NSA in the two-phase encoding directions (ky and kz).
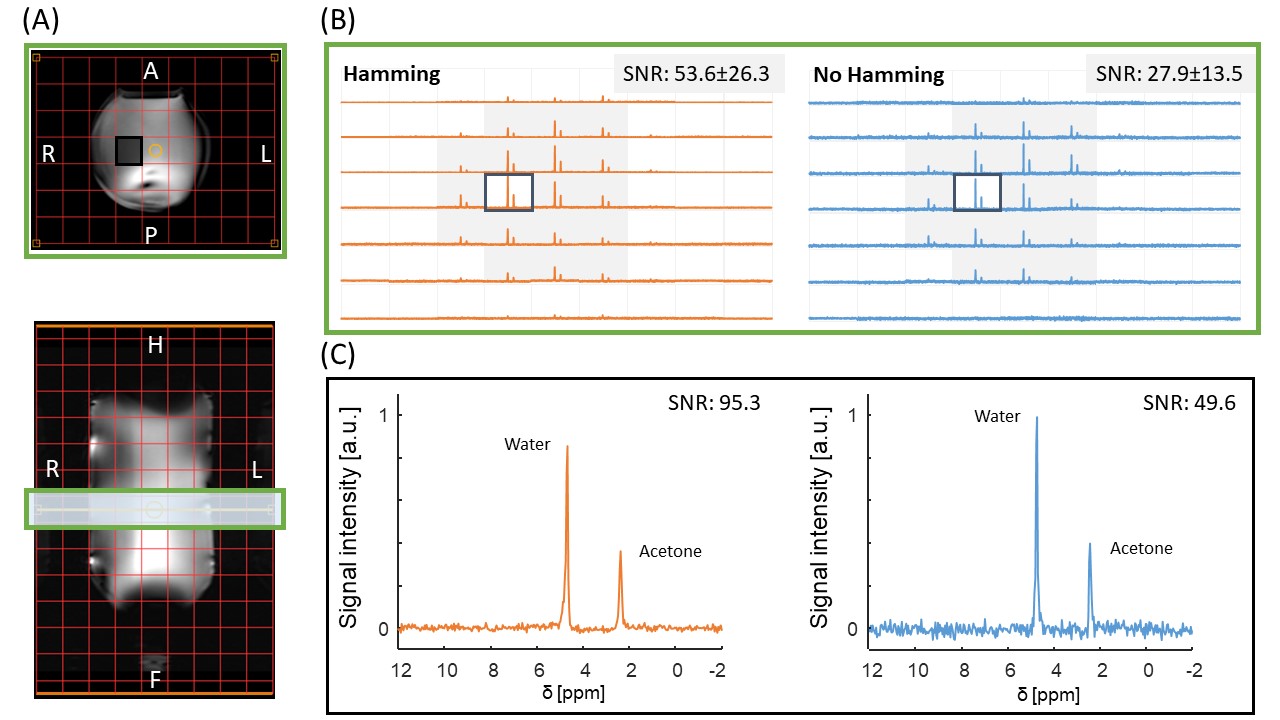
· Phantom 3D DEPSI. Scan parameters: 20×20×20mm3 voxels, FOV: 180×140×280mm3, TR/TE: 400/1.0ms, FA: 60° block pulse, readout: right-left(RL), spectral bandwidth: 1795Hz, acquisition time: 5:22 min. (30 NSA) with Hamming, and 5:14 min. (8 NSA) without Hamming weighted acquisition.
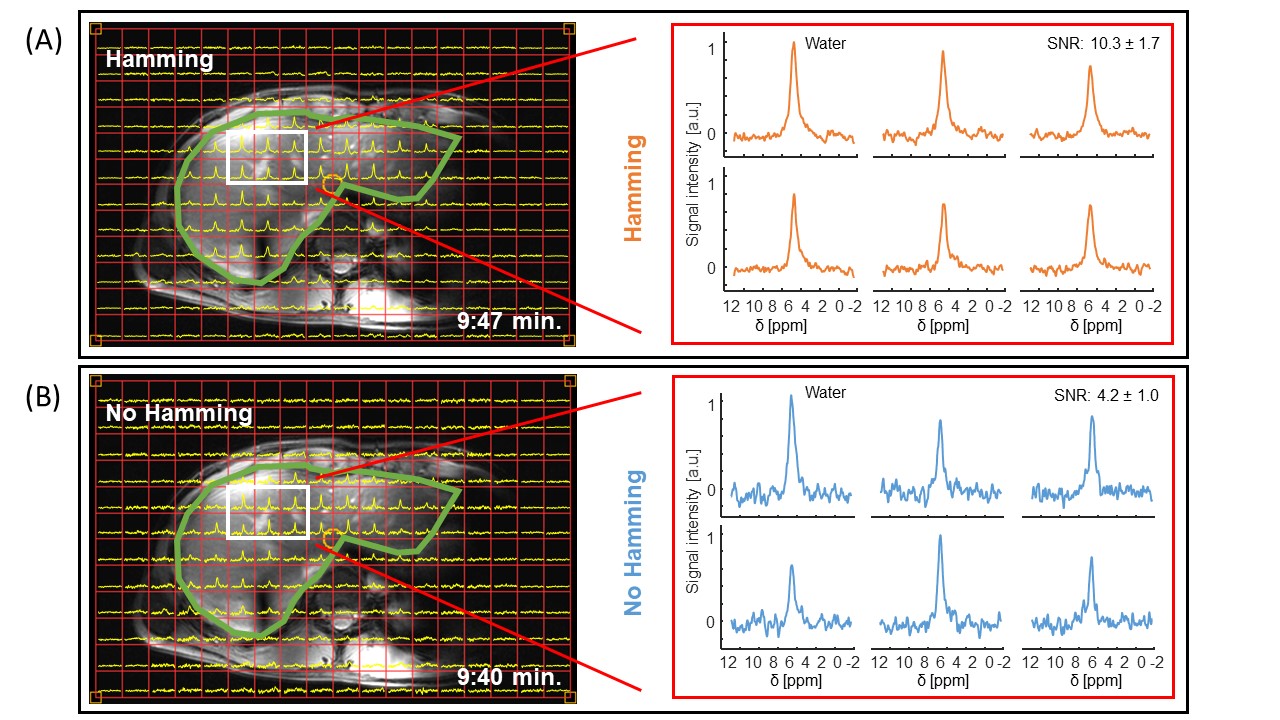
· In-vivo 3D DEPSI in the liver. Scan parameters: 20×20×20mm3 voxels, FOV: 360×240×300 mm3, TR/TE: 371/1.0ms, FA: 90° block pulse, readout: right-left(RL), spectral bandwidth: 1443Hz, acquisition time: 9:50 min (30 NSA) with Hamming, and 9:41 min (7 NSA) without Hamming weighted acquisition. The following steps were performed to reconstruct and process the DEPSI data: signal averaging, 1st order phase correction, weighting in correspondence with the acquisition pattern (Hamming), zero-filling to 512-time points, channel combination using generalized least squares (9), 0th order phase correction, the combination of odd and even echoes, and apodization with a 3-Hz exponential function. The SNR was calculated in the frequency domain according to SNR = Iwater/σ(INoise), with the highest maximum water signal Iwater, and the standard deviation of a noise region σ(INoise). Metabolic maps were calculated by fitting the signal in the time domain using the AMARES algorithm (10).
Results and Discussion
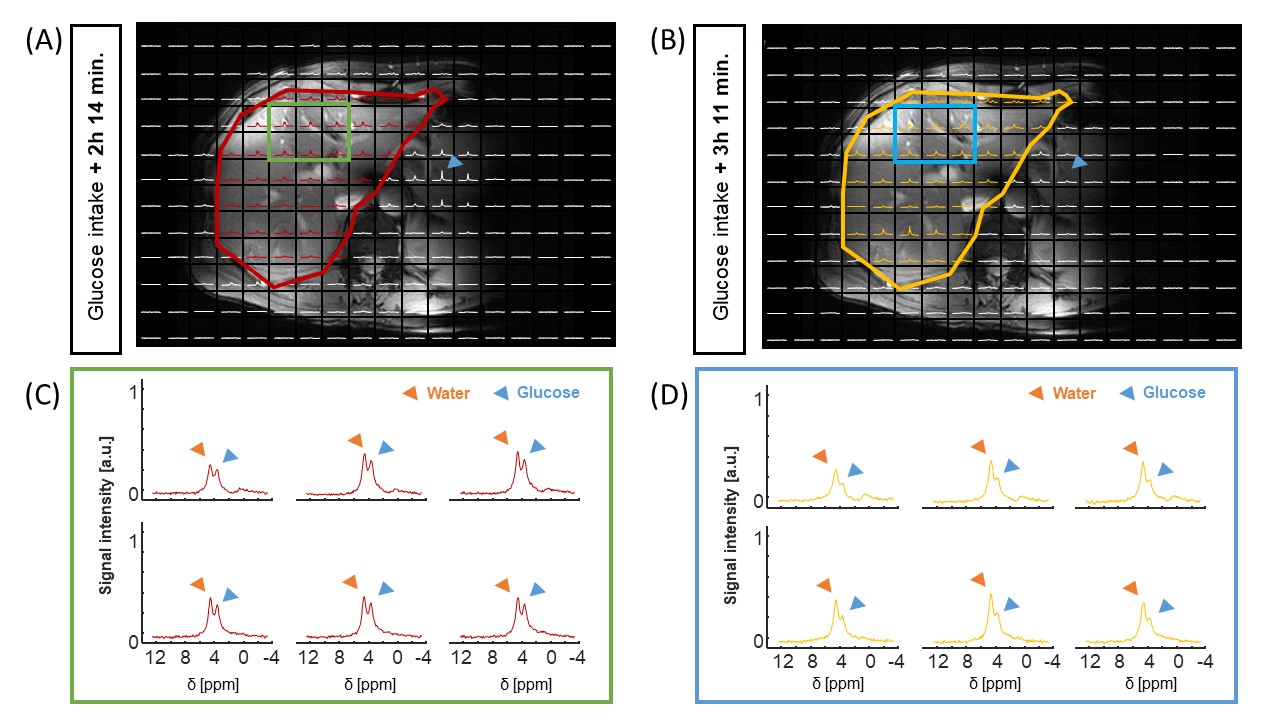
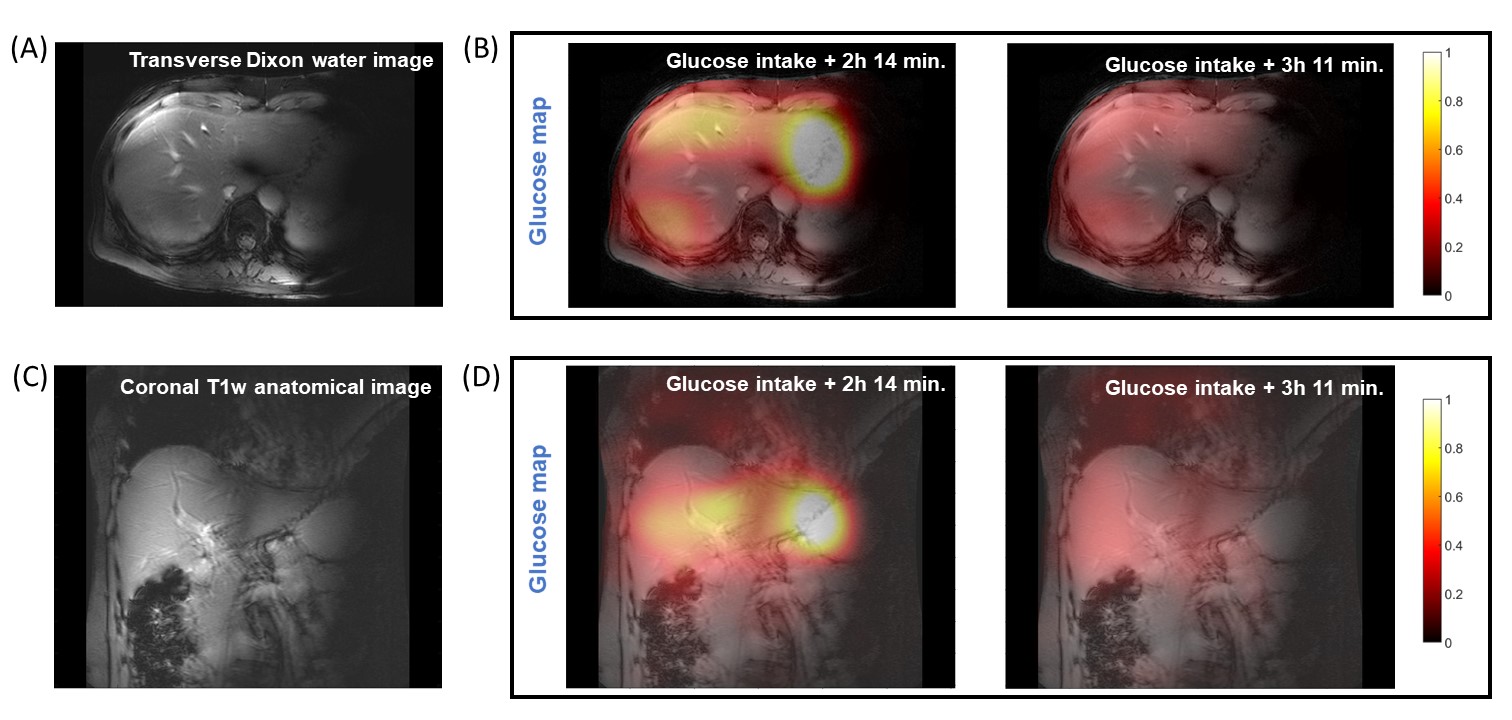
In the phantom, naturally abundant deuterium signals from both water and acetone were observed (Fig. 2). The Hamming weighted acquisition reduced noise, increasing the SNR by approximately a factor of 1.9 in the phantom (Fig. 2) and 2.4 in-vivo (Fig. 3). In-vivo, the signal from naturally abundant deuterated water in the liver could be measured with 20 mm isotropic resolution (Fig. 3). After oral intake of deuterated glucose, the glucose signal could be monitored over time and decreased between 2 and 3 hours after intake (Fig. 4). A conventional MRSI scan with full liver coverage and the same resolution as the DEPSI scan would take at least 20:03 minutes to acquire for one signal average (1 NSA). The DEPSI scan takes 9:50 minutes (30 NSA) and is suited to track faster metabolic fluctuations. Glucose metabolic maps of the liver could be created from the DEPSI data (Fig. 5).Conclusion
In this work, we successfully demonstrate the feasibility of accelerated 3D DMI of the human body by implementing a DEPSI sequence and combining it with Hamming weighted acquisition at 7T. Glucose metabolism of the human liver was measured in-vivo with a resolution of 20 mm isotropic, full liver coverage, and less than 10 minutes of acquisition time. The acceleration obtained with DEPSI will be valuable to study dynamic tissue metabolism of deuterated compounds with higher temporal and spatial resolution.Acknowledgements
This project has received funding from the European Union’s Horizon 2020 research and innovation program under grant agreement (No. 813120) and was funded by a HTSM grant from NWO TTW (project number 17134) and by a FET Innovation Launchpad grant from the EU (grant number 850488).References
1. De Feyter HM, Behar KL, Corbin ZA, Fulbright RK, Brown PB, McIntyre S, et al. Deuterium metabolic imaging (DMI) for MRI-based 3D mapping of metabolism in vivo. Sci Adv. 2018;4(8):1–12.
2. Mansfield P. Multi-planar image formation using NMR spin echoes. J Phys C Solid State Phys. 1977;10(3).
3. Rzedzian R, Mansfield P, Doyle M, Guilfoyle D, Chapman B, Coupland RE, et al. Real-Time Nuclear Magnetic Resonance Clinical Imaging in Paediatrics. Lancet. 1983;322(8362):1281–2.
4. Wilhelm T, Bachert P. In vivo 31 P echo-planar spectroscopic imaging of human calf muscle. J Magn Reson. 2001;149(1):126–30.
5. Ulrich M, Wokrina T, Ende G, Lang M, Bachert P. 31P-{1H} echo-planar spectroscopic imaging of the human brain in vivo. Magn Reson Med. 2007;57(4):784–90.
6. Korzowski A, Bachert P. High-resolution 31 P echo-planar spectroscopic imaging in vivo at 7T. Magn Reson Med. 2018;79(3):1251–9.
7. Reeder SB, Brittain JH, Grist TM, Yen YF. Least-squares chemical shift separation for 13C metabolic imaging. J Magn Reson Imaging. 2007;26(4):1145–52.
8. Posse S charles D, Bihan D Le. Three-dimensional Echo-Palnar MR Spectroscopic Imaging at Short Echo Times in the Human Brain. Radiology. 1994;733–8.
9. An L, Van Der Veen JW, Li S, Thomasson DM, Shen J. Combination of multichannel single-voxel MRS signals using generalized least squares. J Magn Reson Imaging. 2013;37(6):1445–50.
10. Vanhamme L, Van Den Boogaart A, Van Huffel S. Improved Method for Accurate and Efficient Quantification of MRS Data with Use of Prior Knowledge. J Magn Reson. 1997;129(1):35–43.
Figures