0218
Characterization of brain susceptibility changes in post-hospitalisation COVID-19 patients at 7 Tesla1Department of Clinical Neurosciences and University of Cambridge Centre for Parkinson-plus, University of Cambridge, Cambridge, United Kingdom, 2Wolfson Brain Imaging Centre, University of Cambridge, Cambridge, United Kingdom, 3Department of Clinical Neurosciences, University of Cambridge, Cambridge, United Kingdom, 4Division of Anaesthesia, University of Cambridge, Cambridge, United Kingdom, 5Welcome Centre for Integrative Neuroimaging (FMRIB), University of Oxford, Oxford, United Kingdom, 6Department of Psychiatry, University of Cambridge, Cambridge, United Kingdom, 7Behavioural and Clinical Neuroscience Institute, University of Cambridge, Cambridge, United Kingdom, 8on behalf of the Cambridge NeuroCOVID group (www.wbic.cam.ac.uk/neuro-covid/) and the CITIID-NIHR COVID-19 BioResource Collaboration, Cambridge, United Kingdom, 9Medical Research Council Cognition and Brain Sciences Unit, University of Cambridge, Cambridge, United Kingdom
Synopsis
Patients hospitalized with the new coronavirus disease (COVID-19) have shown severe changes in the central nervous system (CNS), particularly microhaemorrhages and encephalitis. However, long-term effects on the CNS haven not yet been fully characterised. In this study we scanned a group of 14 recently hospitalized COVID-19 patients at ultra-high field (7T) and analysed the microstructural changes measured by quantitative susceptibility mapping (QSM) from both subcortical nuclei and brainstem, which are thought to be targeted by the virus.
Purpose
Magnetic resonance imaging (MRI) has revealed changes in the central nervous system (CNS) in patients hospitalized with severe COVID-19. These include markers of acute vasogenic oedema with white-mater (WM) hyperintensities in diffusion-weighted MRI and fluid-attenuated inversion recovery, and extensive WM microhaemorrhages demonstrated by susceptibility-weighted images1,2. A secondary neuroinflammatory response to COVID-19 may trigger further and persistent abnormalities in the CNS, as has been observed for other coronavirus diseases: e.g. accelerating brain ageing, neurodegenerative pathology, risk of stroke and demyelination3-6. However, standard 3T MRI may be insensitive to many pathological sequelae of COVID-19.Here we exploit the enhanced sensitivity of ultra-high field MRI at 7-Tesla to characterize the microstructural changes associated with the susceptibility of brain tissue in patients scanned after hospital treatment for severe COVID-19. T2*-weighted imaging and quantitative susceptibility mapping (QSM) reveal contrast changes from paramagnetic and diamagnetic substances (e.g. differentiation of calcified from haemorrhagic lesions).7,8 We extract measures from both subcortical nuclei and from the brainstem as we predict these regions may be implicated in long-term abnormal effects of COVID-19 on the CNS.
Material and Methods
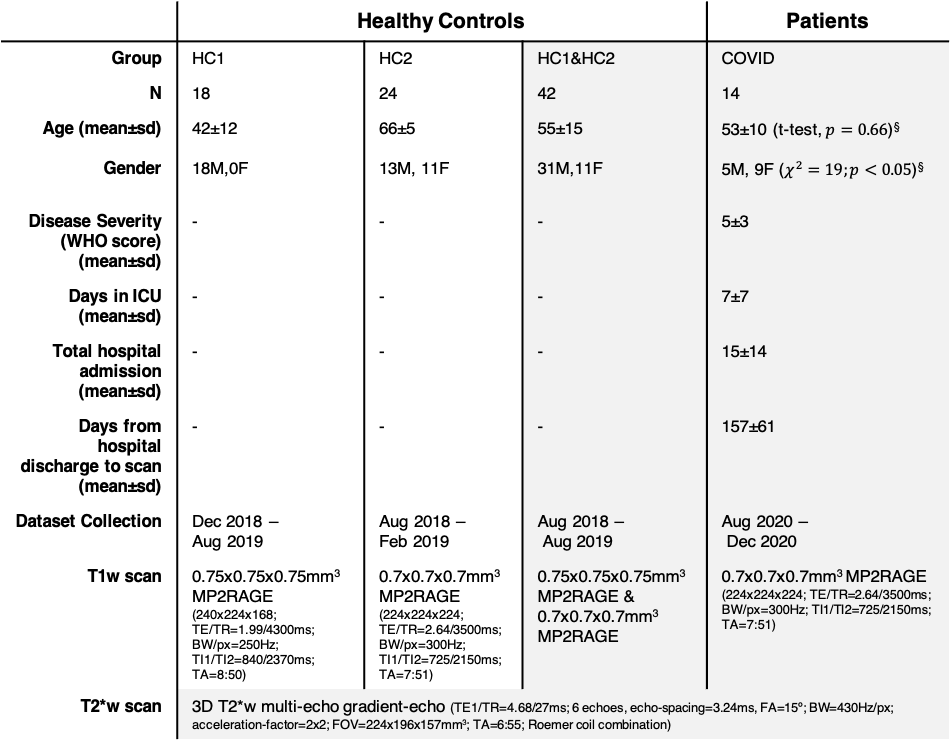
14 recently post-hospitalised COVID-19 patients underwent a 7T brain MRI scan (Magnetom Terra, Siemens). Two groups of non-COVID-19 healthy controls (scanned prior to January-2020) were included in the study, to provide appropriate age range for comparison (Table-1). The COVID-19 patients and all healthy controls were scanned with an identical QSM protocol (3D T2*-weighted multi-echo gradient-echo, 0.7mm isotropic). T1-weighted sequences for anatomical coregistration were identical in the COVID-19 cohort and one control groups (UK7T network 0.7mm isotropic MP2RAGE protocol9), while T1w images in the other control group were acquired with a slightly lower voxel resolution (0.75 mm isotropic; see Table-1 for details).Analysis
QSM data were estimated from the T2*-weighted images using the multi-scale dipole inversion algorithm in QSMbox10 with regularization parameter 𝛌=103.3. The QSM data were mapped to the 0.5mm MNI152 2009b space with ANTs (v2.2.0) software via the T1w data by a two-step process:- From QSM to native-T1w: the first echo of the T2*w data was used to find the registration matrix (rigid, cross-correlation) at 4 resolution levels.
- From native-T1w to MNI space: registration was performed in three steps (rigid-affine-symmetric image normalization(SyN)11), using mutual information for the first two steps, and cross-correlation for the SyN step, at 4 resolution levels for each step.
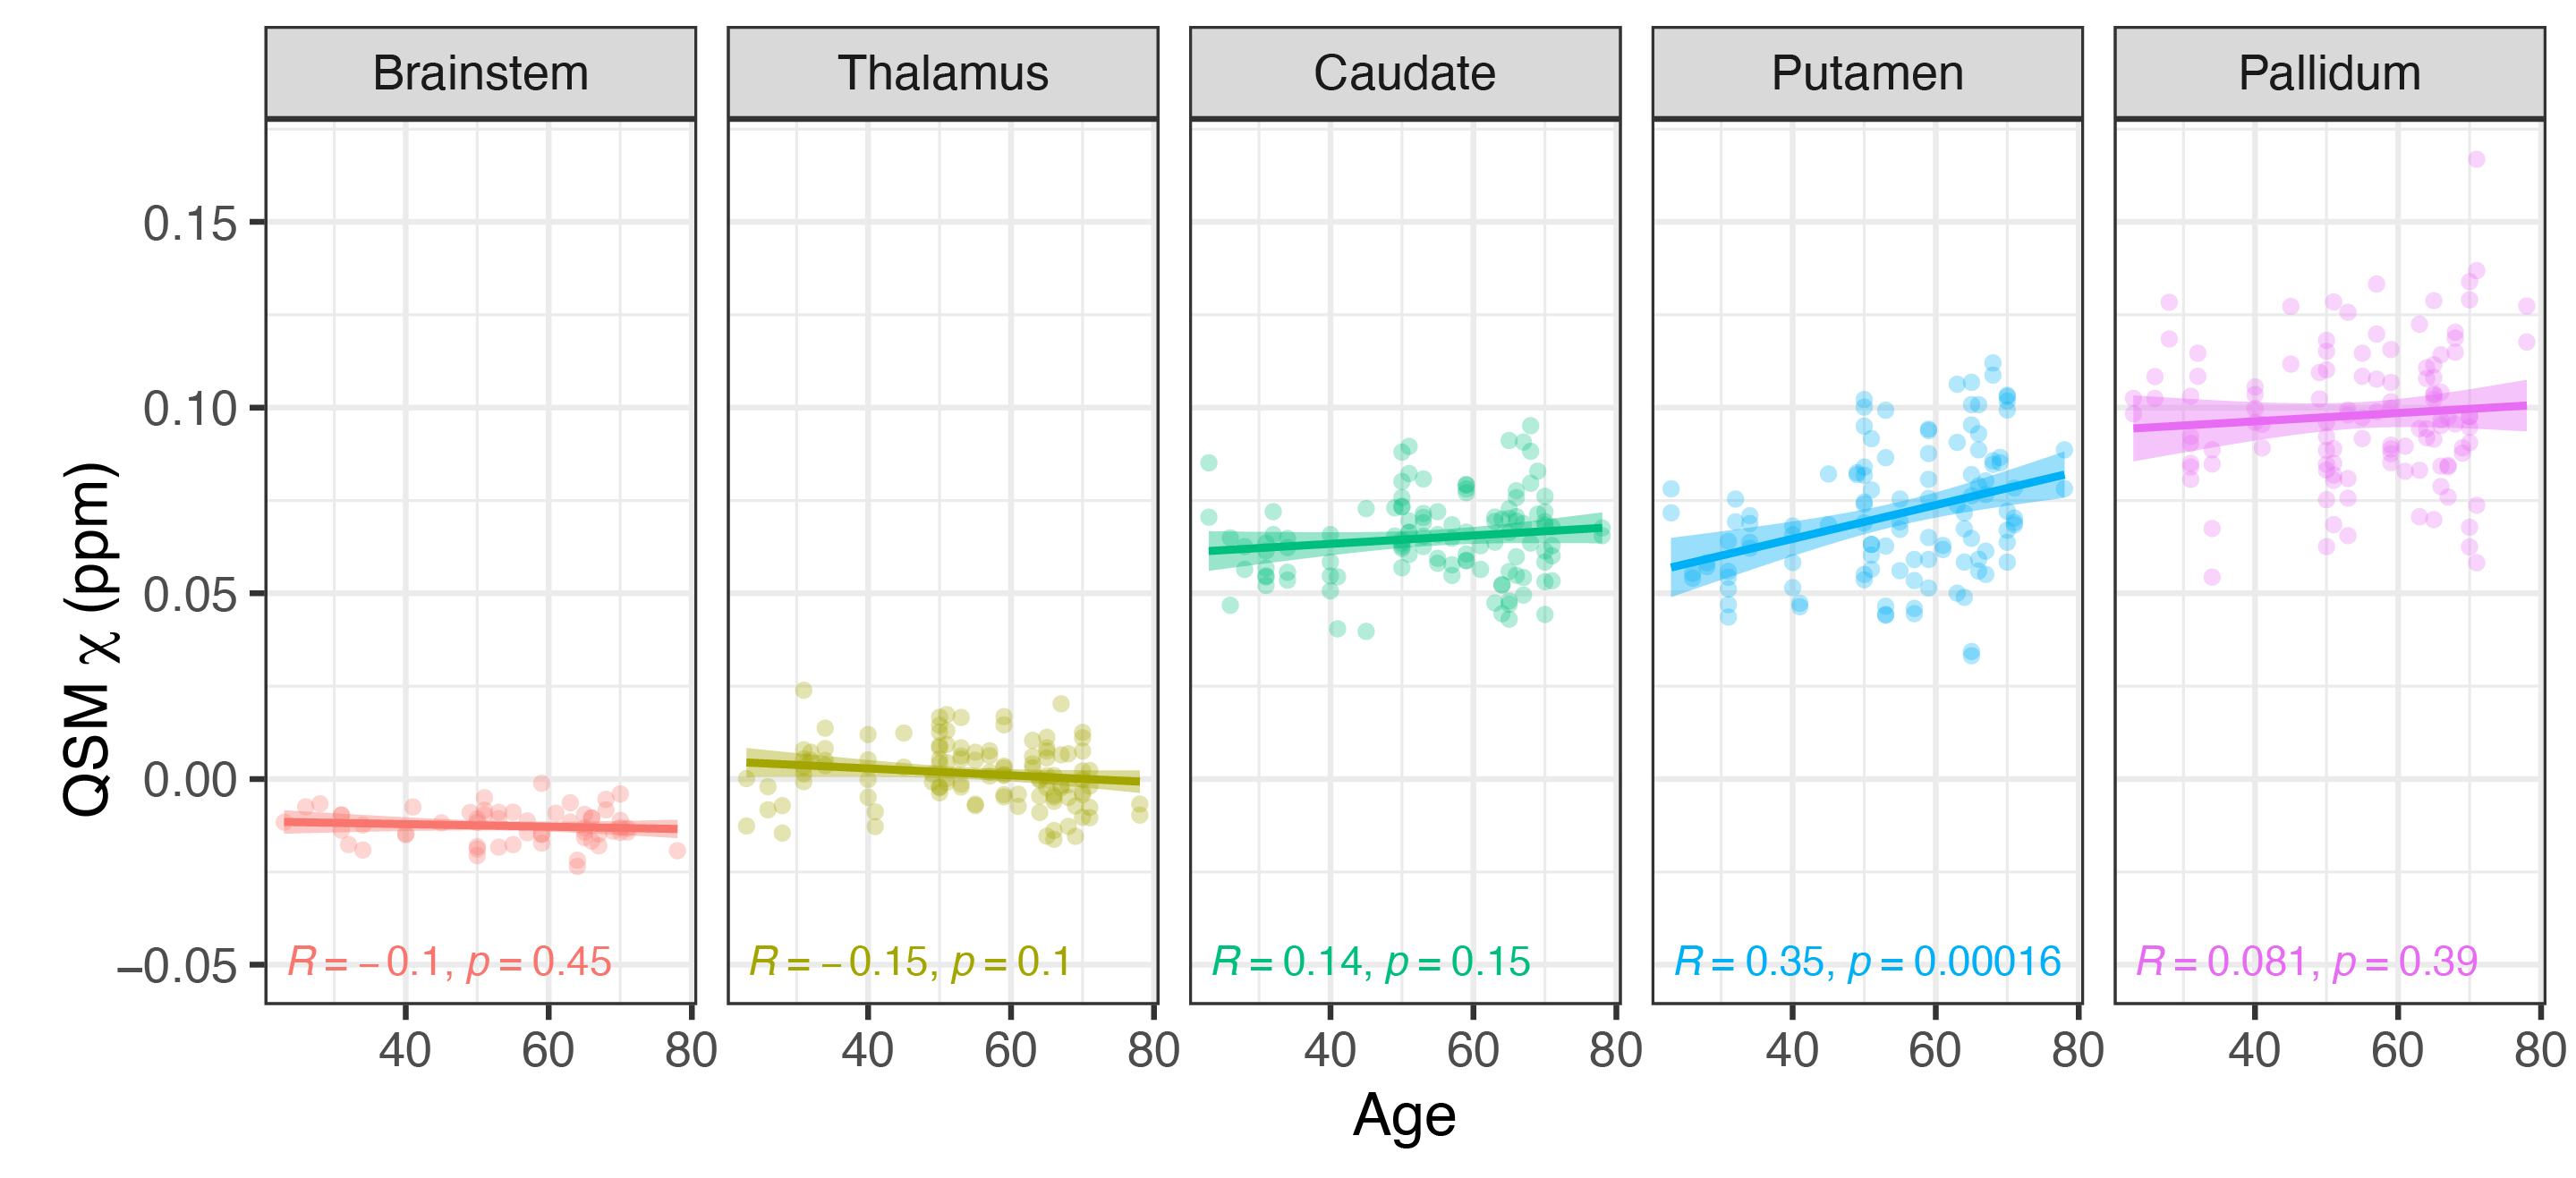
Given the heterogeneity of age in the groups, we fitted a linear function to the QSM-vs-age relationship (two-sided Pearson correlation) for each of the ROIs.
We predicted group differences in QSM in the basal-ganglia and brainstem. To test this, we fitted linear models separately for each ROI, adding group (COVID cases versus healthy controls [HC1&HC2]) as a fixed effect, and age and gender as nuisance covariates, allowing the intercept to vary across participants (random effect). The relationship between QSM and clinical outcomes (see Table-1 for details) was modelled by using disease severity, number of days in ICU, number of days of hospital admission, and number of days between hospital discharge and date of scan, as explanatory variables in a linear model. ROIs were combined for the left- and right-hemispheres in the latter models when appropriate. We report both frequentist and Bayesian analysis (Bayesian Factor [BF] and posterior probability estimate) for hypothesis testing with uncorrected P-value<0.05 and BF>1.0 as thresholds for significance.16,17
Results
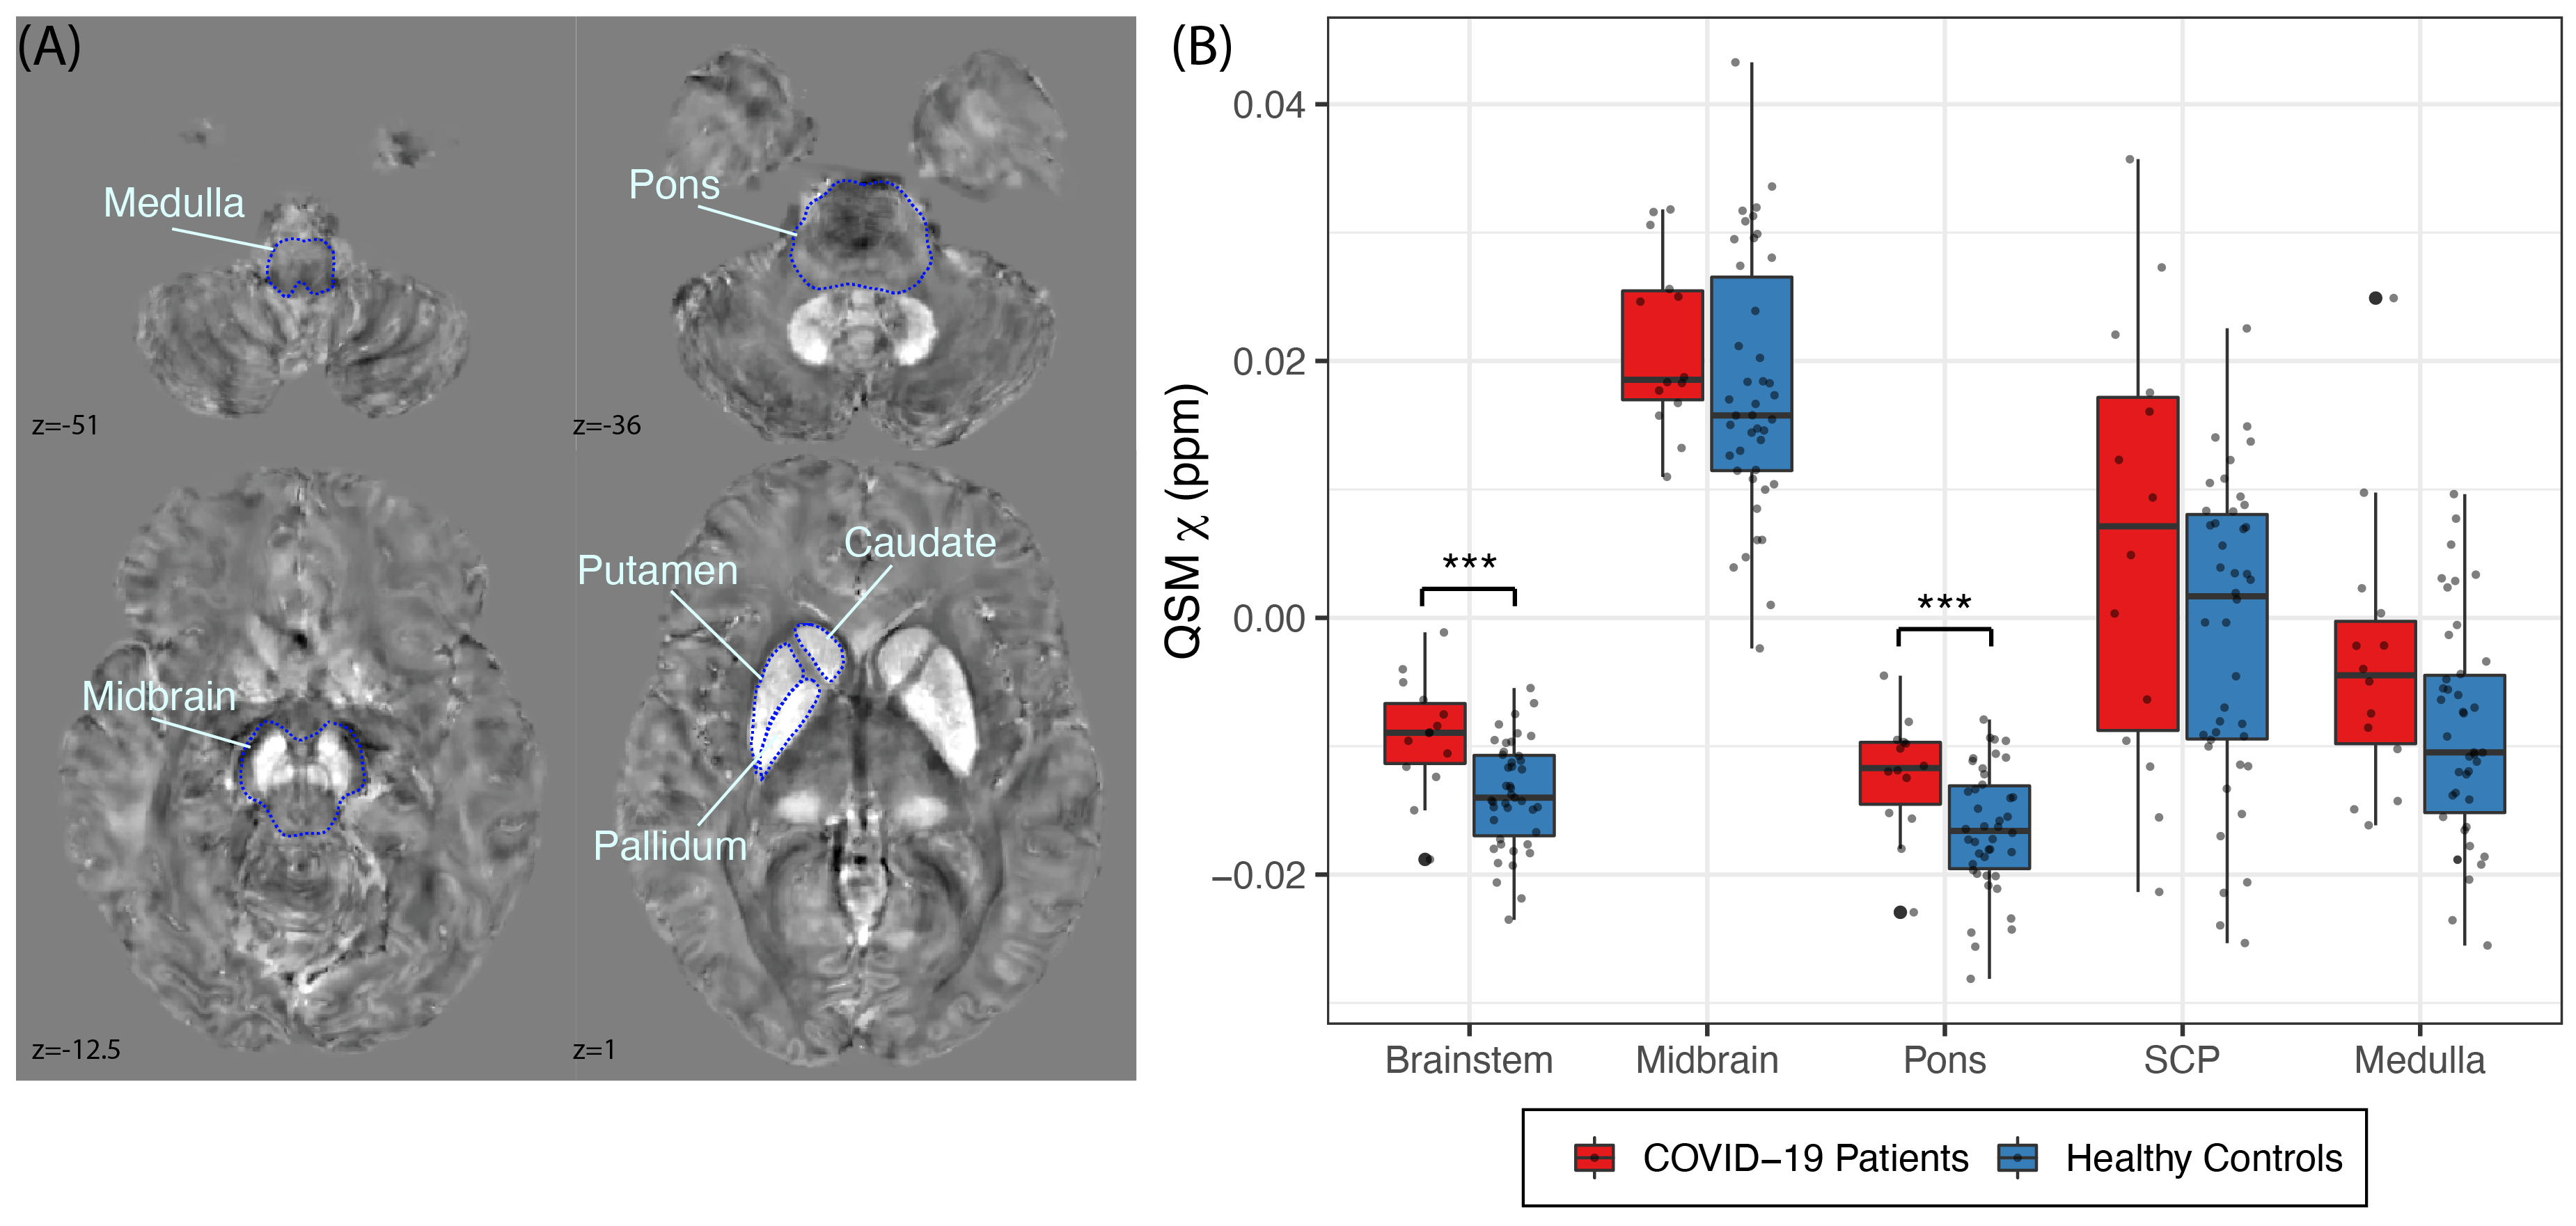
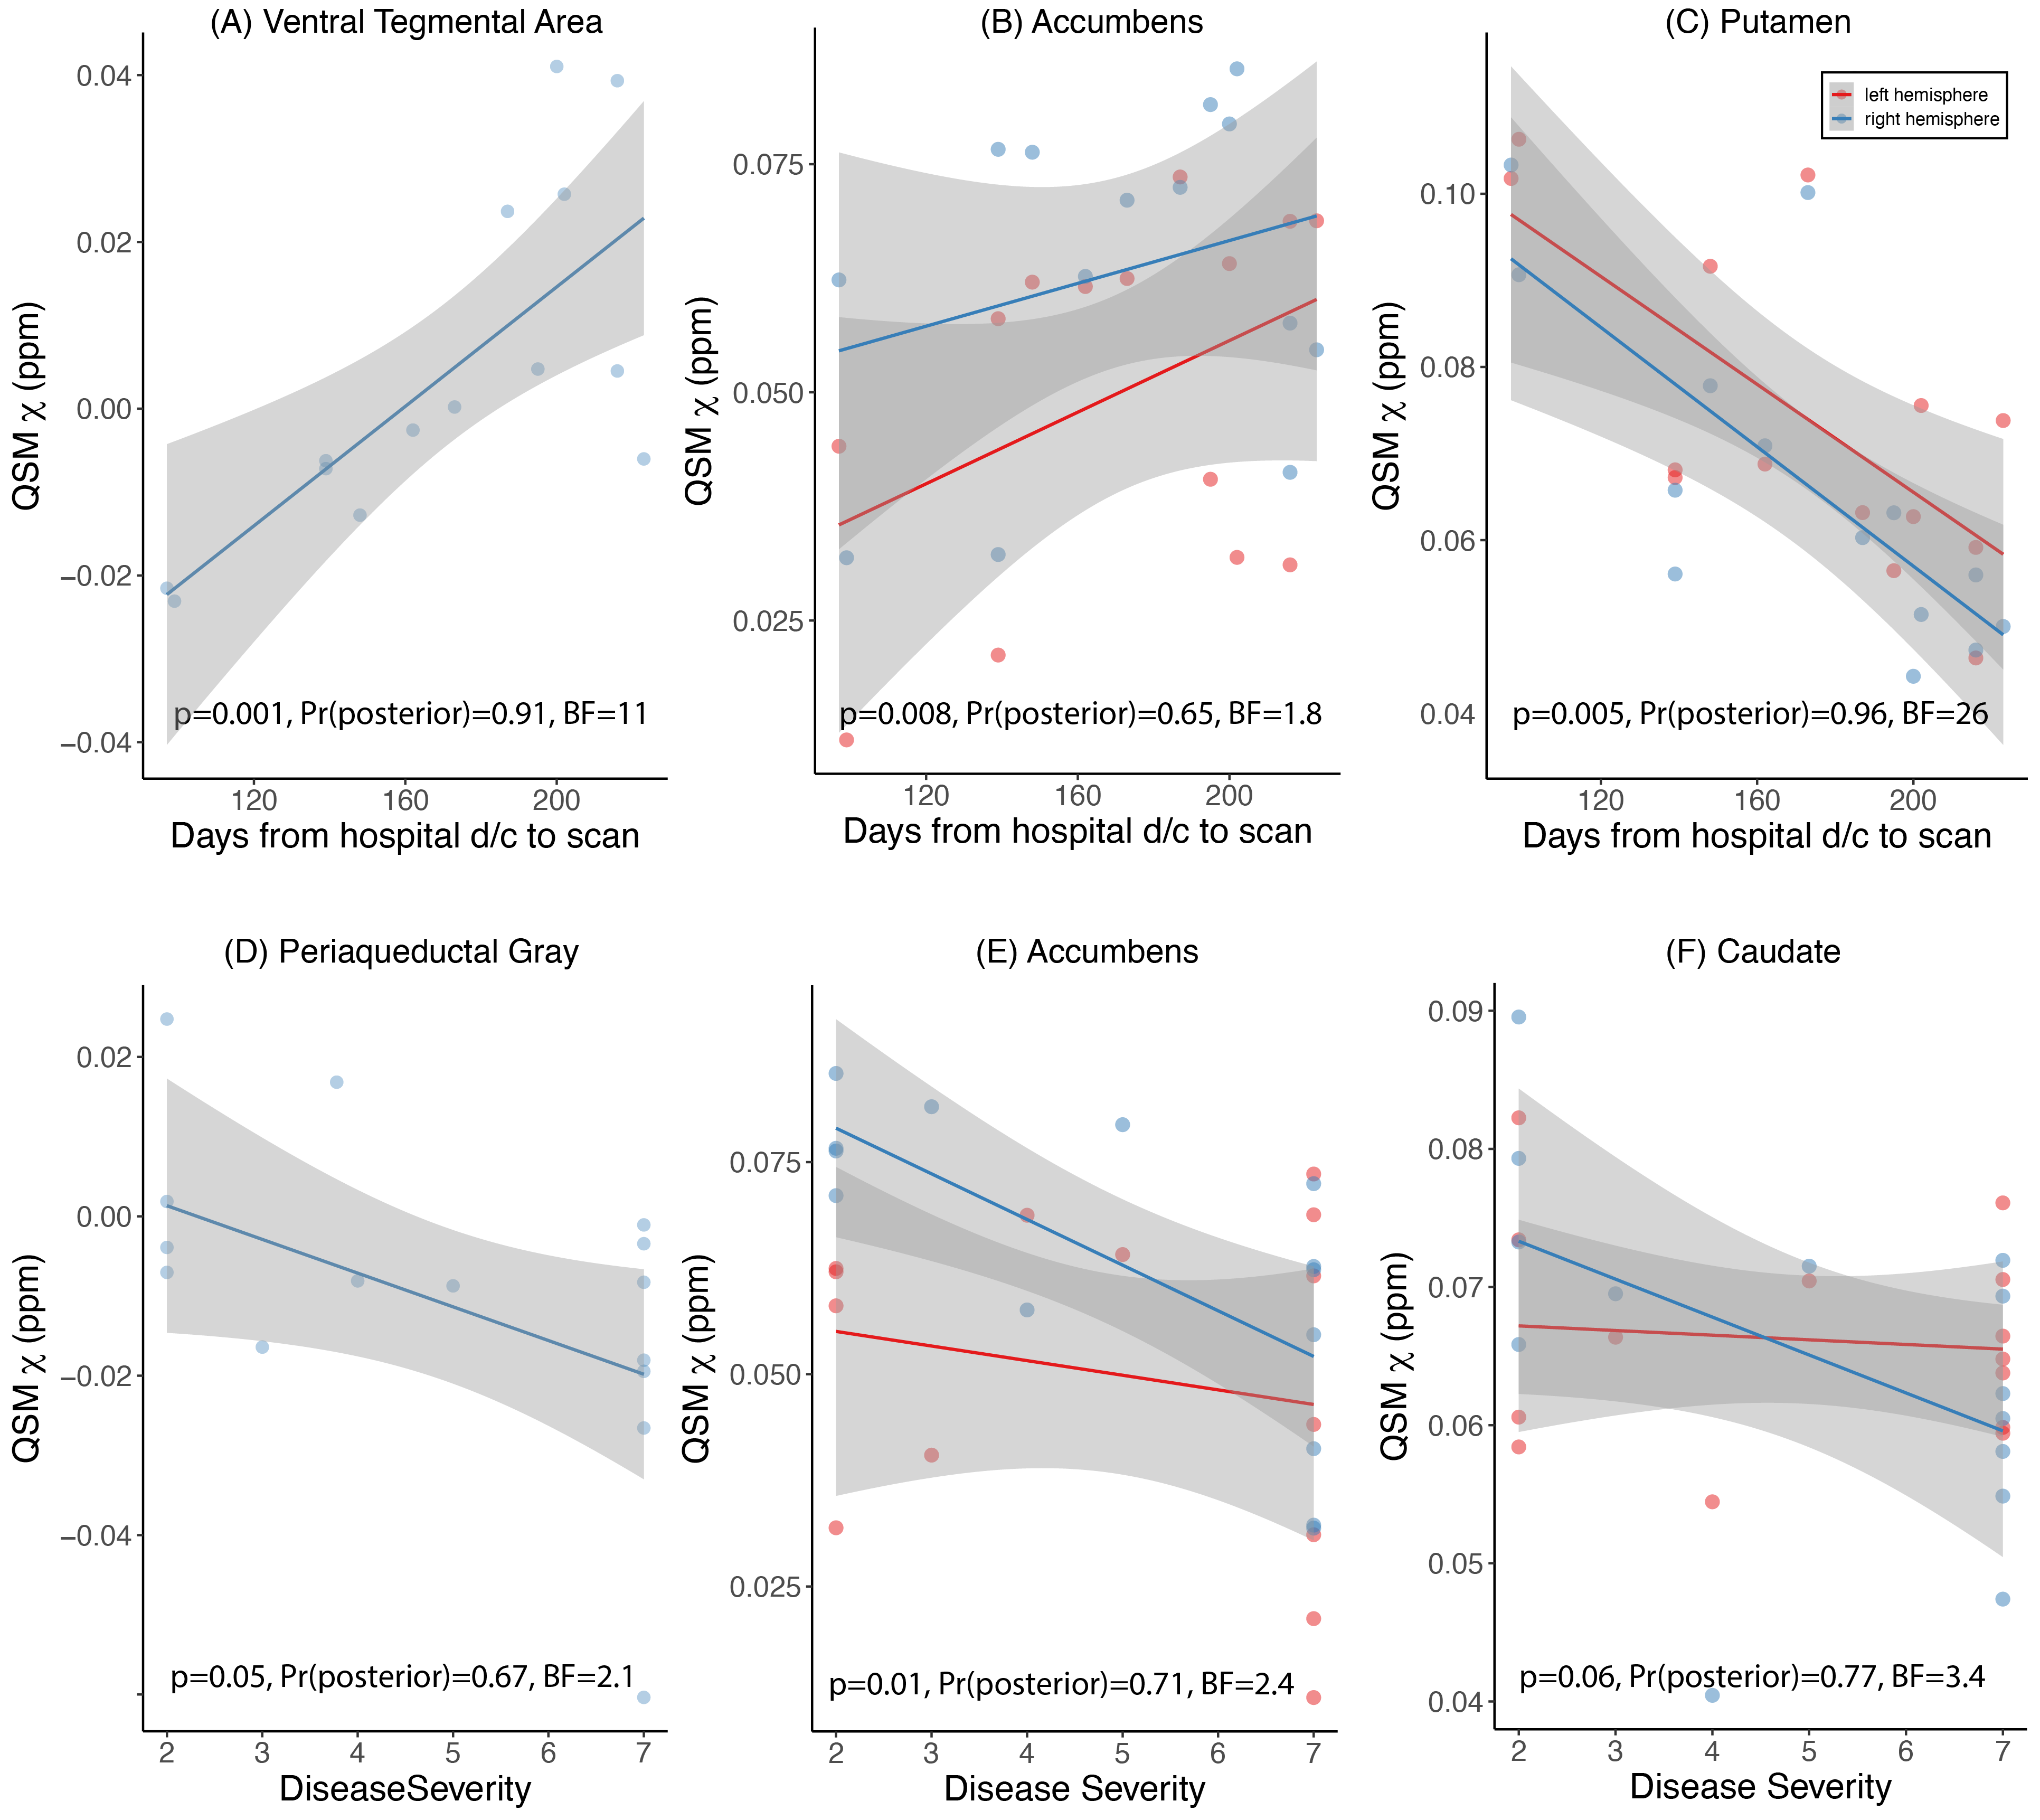
Except for the pallidum, age did not show a significant linear effect on 𝛘 for any of the ROIs tested, but 𝛘-values in basal ganglia showed a similar increasing linear trend with increasing age as observed in past reports (Figure-1)18. Both frequentist and Bayesian statistics showed significant group differences between COVID-19 cases and controls for the whole brainstem region (HO-Sub Brainstem P-value=0.004, Pr(posterior)=0.96, BF=23.7). For the individual brainstem nuclei considered, only the Pons showed increased susceptibility in cases compared to controls (P-value=0.004, Pr(posterior)=0.90, BF=8.9) (Figure-2). A small but significant decrease in susceptibility was found in the left locus-coeruleus in COVID-19 patients and an increase in susceptibility in the periacqueductal-gray by frequentist analysis, but these effects were of anecdotal relevance by Bayesian analysis (respectively: P-value=0.02, Pr(posterior)=0.65 and BF=1.8; P-value=0.05, Pr(posterior)=0.51 and BF=1.0). In analyses unadjusted for covariates, disease severity was weakly inversely associated with 𝛘 in the periacqueductal-gray and nucleus accumbens; and delay from hospital discharge to scan was associated directly with 𝛘 in the ventral tegmental area and nucleus accumbens, and inversely with 𝛘 in the putamen (Figure-3).Discussion and Conclusions
We report the residual impact of COVID-19 on susceptibility in the brain, as detected by ultra-high field QSM. Our preliminary unadjusted analyses showed that significant 𝛘 changes occur mostly in the brainstem, and that magnitude of QSM abnormality might vary with disease severity and show dynamic evolution over the recovery period.Our future work will focus testing specific hypotheses in this region on a larger patient group, with age and sex-matched controls using a UK-wide multi-site 7T network.Acknowledgements
We acknowledge funding support from the Addenbrooke’s Charitable Trust, NIHR Cambridge Biomedical Research Centre and MRC Clinical Research Infrastructure Award for 7T research. These studies were supported by the Cambridge NIHR/Wellcome Clinical Research Facility. Personnel funding: Wellcome Trust, the Royal Society [098436/Z/12/B]; Cambridge Centre for Parkinson-plus; NIHR Senior Investigator award.References
1. Newcombe, V.F., Spindler, L.R., Das, T., Winzeck, S., Allinson, K., Stamatakis, E.A. and Menon, D.K., 2020. Neuroanatomical substrates of generalized brain dysfunction in COVID-19. Intensive care medicine, pp.1-3.
2. Kremer, S., Lersy, F., de Sèze, J., Ferré, J.C., Maamar, A., Carsin-Nicol, B., Collange, O., Bonneville, F., Adam, G., Martin-Blondel, G. and Rafiq, M., 2020. Brain MRI findings in severe COVID-19: a retrospective observational study. Radiology, 297(2), pp.E242-E251.
3. Hascup, E.R. and Hascup, K.N., 2020. Does SARS-CoV-2 infection cause chronic neurological complications?. GeroScience, p.1.
4. Hopkins, R.O., Weaver, L.K., Collingridge, D., Parkinson, R.B., Chan, K.J. and Orme Jr, J.F., 2005. Two-year cognitive, emotional, and quality-of-life outcomes in acute respiratory distress syndrome. American journal of respiratory and critical care medicine, 171(4), pp.340-347.
5. Limphaibool, N., Iwanowski, P., Holstad, M.J.V., Kobylarek, D. and Kozubski, W., 2019. Infectious etiologies of Parkinsonism: pathomechanisms and clinical implications. Frontiers in neurology, 10, p.652.
6. Rogers, J.P., Chesney, E., Oliver, D., Pollak, T.A., McGuire, P., Fusar-Poli, P., Zandi, M.S., Lewis, G. and David, A.S., 2020. Psychiatric and neuropsychiatric presentations associated with severe coronavirus infections: a systematic review and meta-analysis with comparison to the COVID-19 pandemic. The Lancet Psychiatry.
7. Deistung, A., Schweser, F. and Reichenbach, J.R., 2017. Overview of quantitative susceptibility mapping. NMR in Biomedicine, 30(4), p.e3569.
8. Deistung, A., Schweser, F., Wiestler, B., Abello, M., Roethke, M., Sahm, F., Wick, W., Nagel, A.M., Heiland, S., Schlemmer, H.P. and Bendszus, M., 2013. Quantitative susceptibility mapping differentiates between blood depositions and calcifications in patients with glioblastoma. PloS one, 8(3), p.e57924.
9. Clarke, W.T., Mougin, O., Driver, I.D., Rua, C., Morgan, A.T., Asghar, M., Clare, S., Francis, S., Wise, R.G., Rodgers, C.T. and Carpenter, A., 2020. Multi-site harmonization of 7 tesla MRI neuroimaging protocols. Neuroimage, 206, p.116335.
10. Acosta-Cabronero, J., Milovic, C., Mattern, H., Tejos, C., Speck, O. and Callaghan, M.F., 2018. A robust multi-scale approach to quantitative susceptibility mapping. Neuroimage, 183, pp.7-24.
11. Avants, B.B., Epstein, C.L., Grossman, M. and Gee, J.C., 2008. Symmetric diffeomorphic image registration with cross-correlation: evaluating automated labeling of elderly and neurodegenerative brain. Medical image analysis, 12(1), pp.26-41.
12. Edlow, B.L., Takahashi, E., Wu, O., Benner, T., Dai, G., Bu, L., Grant, P.E., Greer, D.M., Greenberg, S.M., Kinney, H.C. and Folkerth, R.D., 2012. Neuroanatomic connectivity of the human ascending arousal system critical to consciousness and its disorders. Journal of Neuropathology & Experimental Neurology, 71(6), pp.531-546.
13. Frazier, J.A., Chiu, S., Breeze, J.L., Makris, N., Lange, N., Kennedy, D.N., Herbert, M.R., Bent, E.K., Koneru, V.K., Dieterich, M.E. and Hodge, S.M., 2005. Structural brain magnetic resonance imaging of limbic and thalamic volumes in pediatric bipolar disorder. American Journal of Psychiatry, 162(7), pp.1256-1265.
14. Ye, R., Rua, C., O’Callaghan, C., Jones, P.J., Hezemans, F.H., Kaalund, S.S., Tsvetanov, K.A., Rodgers C.T., Williams, G.B., Passamonti, L., and Rowe, J.B., 2020.An in vivo probabilistic atlas of the locus coeruleus at ultra-high field. Neuroimage, 225, pp.117487.
15. Iglesias, J.E., Van Leemput, K., Bhatt, P., Casillas, C., Dutt, S., Schuff, N., Truran-Sacrey, D., Boxer, A., Fischl, B. and Alzheimer's Disease Neuroimaging Initiative, 2015. Bayesian segmentation of brainstem structures in MRI. Neuroimage, 113, pp.184-195.
16. O'Callaghan, C., Hezemans, F.H., Ye, R., Rua, C., Jones, S.P, Murley, A.G., Holland, N., Regenthal, R., Tsvetanov, K., Wolpe, N., Barker, R., Williams-Gray, C., Robbins, T., Passamonti, L., and Rowe, J.B., 2020. Locus coeruleus integrity and the effect of atomoxetine on response inhibition in Parkinson's disease, medRxiv.
17. Kass, R.E. and Raftery, A.E., 1995. Bayes factors. Journal of the american statistical association, 90(430), pp.773-795.
18. Acosta-Cabronero, J., Betts, M.J., Cardenas-Blanco, A., Yang, S. and Nestor, P.J., 2016. In vivo MRI mapping of brain iron deposition across the adult lifespan. Journal of Neuroscience, 36(2), pp.364-374.
Figures