0214
Chenonceau: an entire ex vivo human brain 11.7T anatomical and diffusion MRI dataset at the mesoscopic scale1NeuroSpin (CEA), Paris, France, 2Université de Tours, Tours, France
Synopsis
In this study, we present the Chenonceau dataset : a novel 11.7T MRI dataset of the entire human brain, combining an ultra-high resolution anatomical scan at 100μm with diffusion scans at 200μm using strong diffusion sensitizations. To obtain this dataset, a unique acquisition protocol has been established : a fixed ex vivo brain has been cut into blocks compatible in size with a Bruker 11.7T MRI system. The blocks were scanned individually over an extended period of time. The collection of datasets was then registered back to a reference blockface acquired at 3T, thus resulting in a unique high resolution brain dataset.
Introduction
The modeling of the human brain structural connectome has been strongly pioneered by diffusion MRI1. Recent developments2,3,4 of dedicated sequence schemes on ultra-high field clinical MRI scanners allowed to reach the submillimeter resolution on post-mortem samples. Nevertheless, obtaining high spatial resolution and strong diffusion sensitization on clinical scanners remains a major challenge1,5 and hinders the creation of precise, highly specific, tractographies. Here, we present a novel 11.7T MRI dataset combining an ultra-high resolution anatomical scan at 100μm and diffusion scans at 200μm with strong diffusion sensitizations on an entire ex vivo human brain.Material and Methods
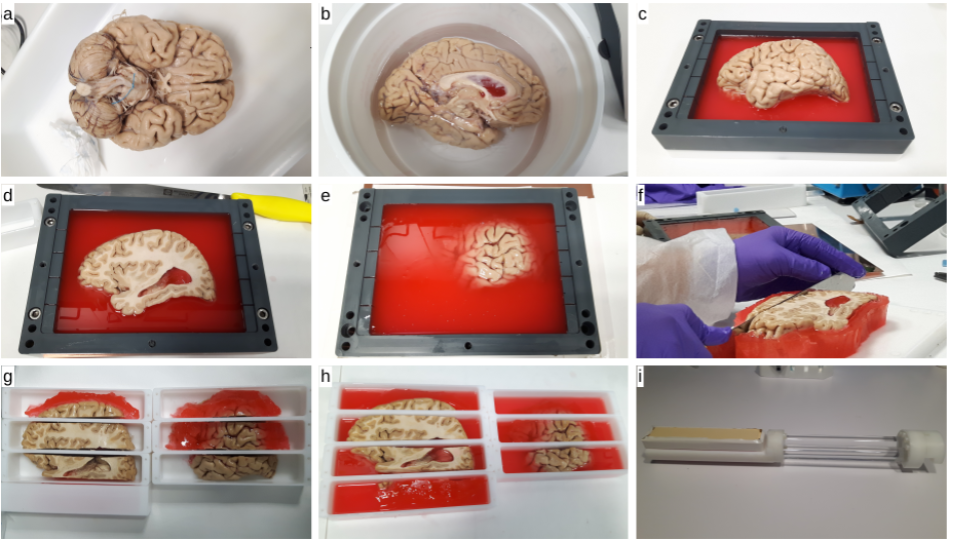
Human brain sample - a 92-years-old ex vivo human brain (Body Donation Program, Tours University) was extracted, perfused with a solution of 4% PFA and immersed in PFA during 4 months. Its two hemispheres were separated and cut individually into 7 blocks of 4.2cmx4.2cmx20cm along the antero-posterior direction. Each block was put in a plastic container and fixed using a sealing gel to avoid deformation over time and to allow a reproducible installation in a preclinical 11.7T MRI system (Fig 1).MRI protocol - the brain was scanned on a 11.7T MRI system (Bruker, Ettlingen) during a long period extending to 2.5 years and corresponding to more than 4000h of scanning. Specific attention was given to tissue preservation during this period. Each block was scanned during 3/4 sessions, each session of 103h covering a field of view (FOV) of 4.2cmx4.2cmx5.6cm. The imaging protocol included: 1) a T2w 3D-SE scan at 100μm (TE/TR=20/500ms, matrix 400x400, 560 slices, FA=90°, RBW=50kHz, 1 average, 22h13min); 2) a T2w 2D-SE scan at 150μm (TE/TR=16/6600ms, matrix 275x256, 374 slices, FA=90°, RBW=66kHz, 9 averages, 3h26min); a multiple-shell diffusion-weighted 3D segmented EPI scan at 200μm and at b=1500/4500/8000s/mm² along 25/60/90 directions with 17 b=0s/mm² volumes (TE/TR=24.3/250ms, δ/Δ=5/12.3ms, matrix 212x204, 280 slices, FA=90°, RBW=300kHz, 30 segments, Gmax=289/500/666mT/m, 1 average, 82h).
Preprocessing - as diffusion scans were performed with a large number of segments, they were deprived of susceptibility and eddy current artifacts. The collection of 45 anatomical and diffusion datasets over the various FOVs were corrected from noise using a NLM filtering approach. Anatomical images benefited from bias field correction6. To reconstruct the entire puzzle from its 45 FOVs over the 3 contrasts, a diffeomorphic registration pipeline, using the ANTs toolbox6, was developed. Its objective was to match every FOV to a blockface image of the specimen, scanned before the cutting, at 3T, using a SPACE sequence, at a resolution of 400μm.
Diffusion MR analysis - to explore the rich information of this novel mesoscopic anatomical/diffusion MRI dataset, several preliminary investigations were performed, using a regularized deterministic fiber tracking method7 (1 seed per voxel, forward step 25μm, aperture angle=6°, GFA-based regularization factor of 0.08) over a precomputed analytical Q-balls field8 (SH order 8, Laplace-Beltrami regularization factor of 0.006). GFA and color-encoded direction maps were also computed. The multiple shell diffusion sampling was exploited by computing the NODDI-based9 proxies for neurite density (ICVF) and orientation dispersion (OD) quantitative maps (D//=0.16x10-9m²/s and Diso =2x10⁻⁹m²/s).
Results and Discussion
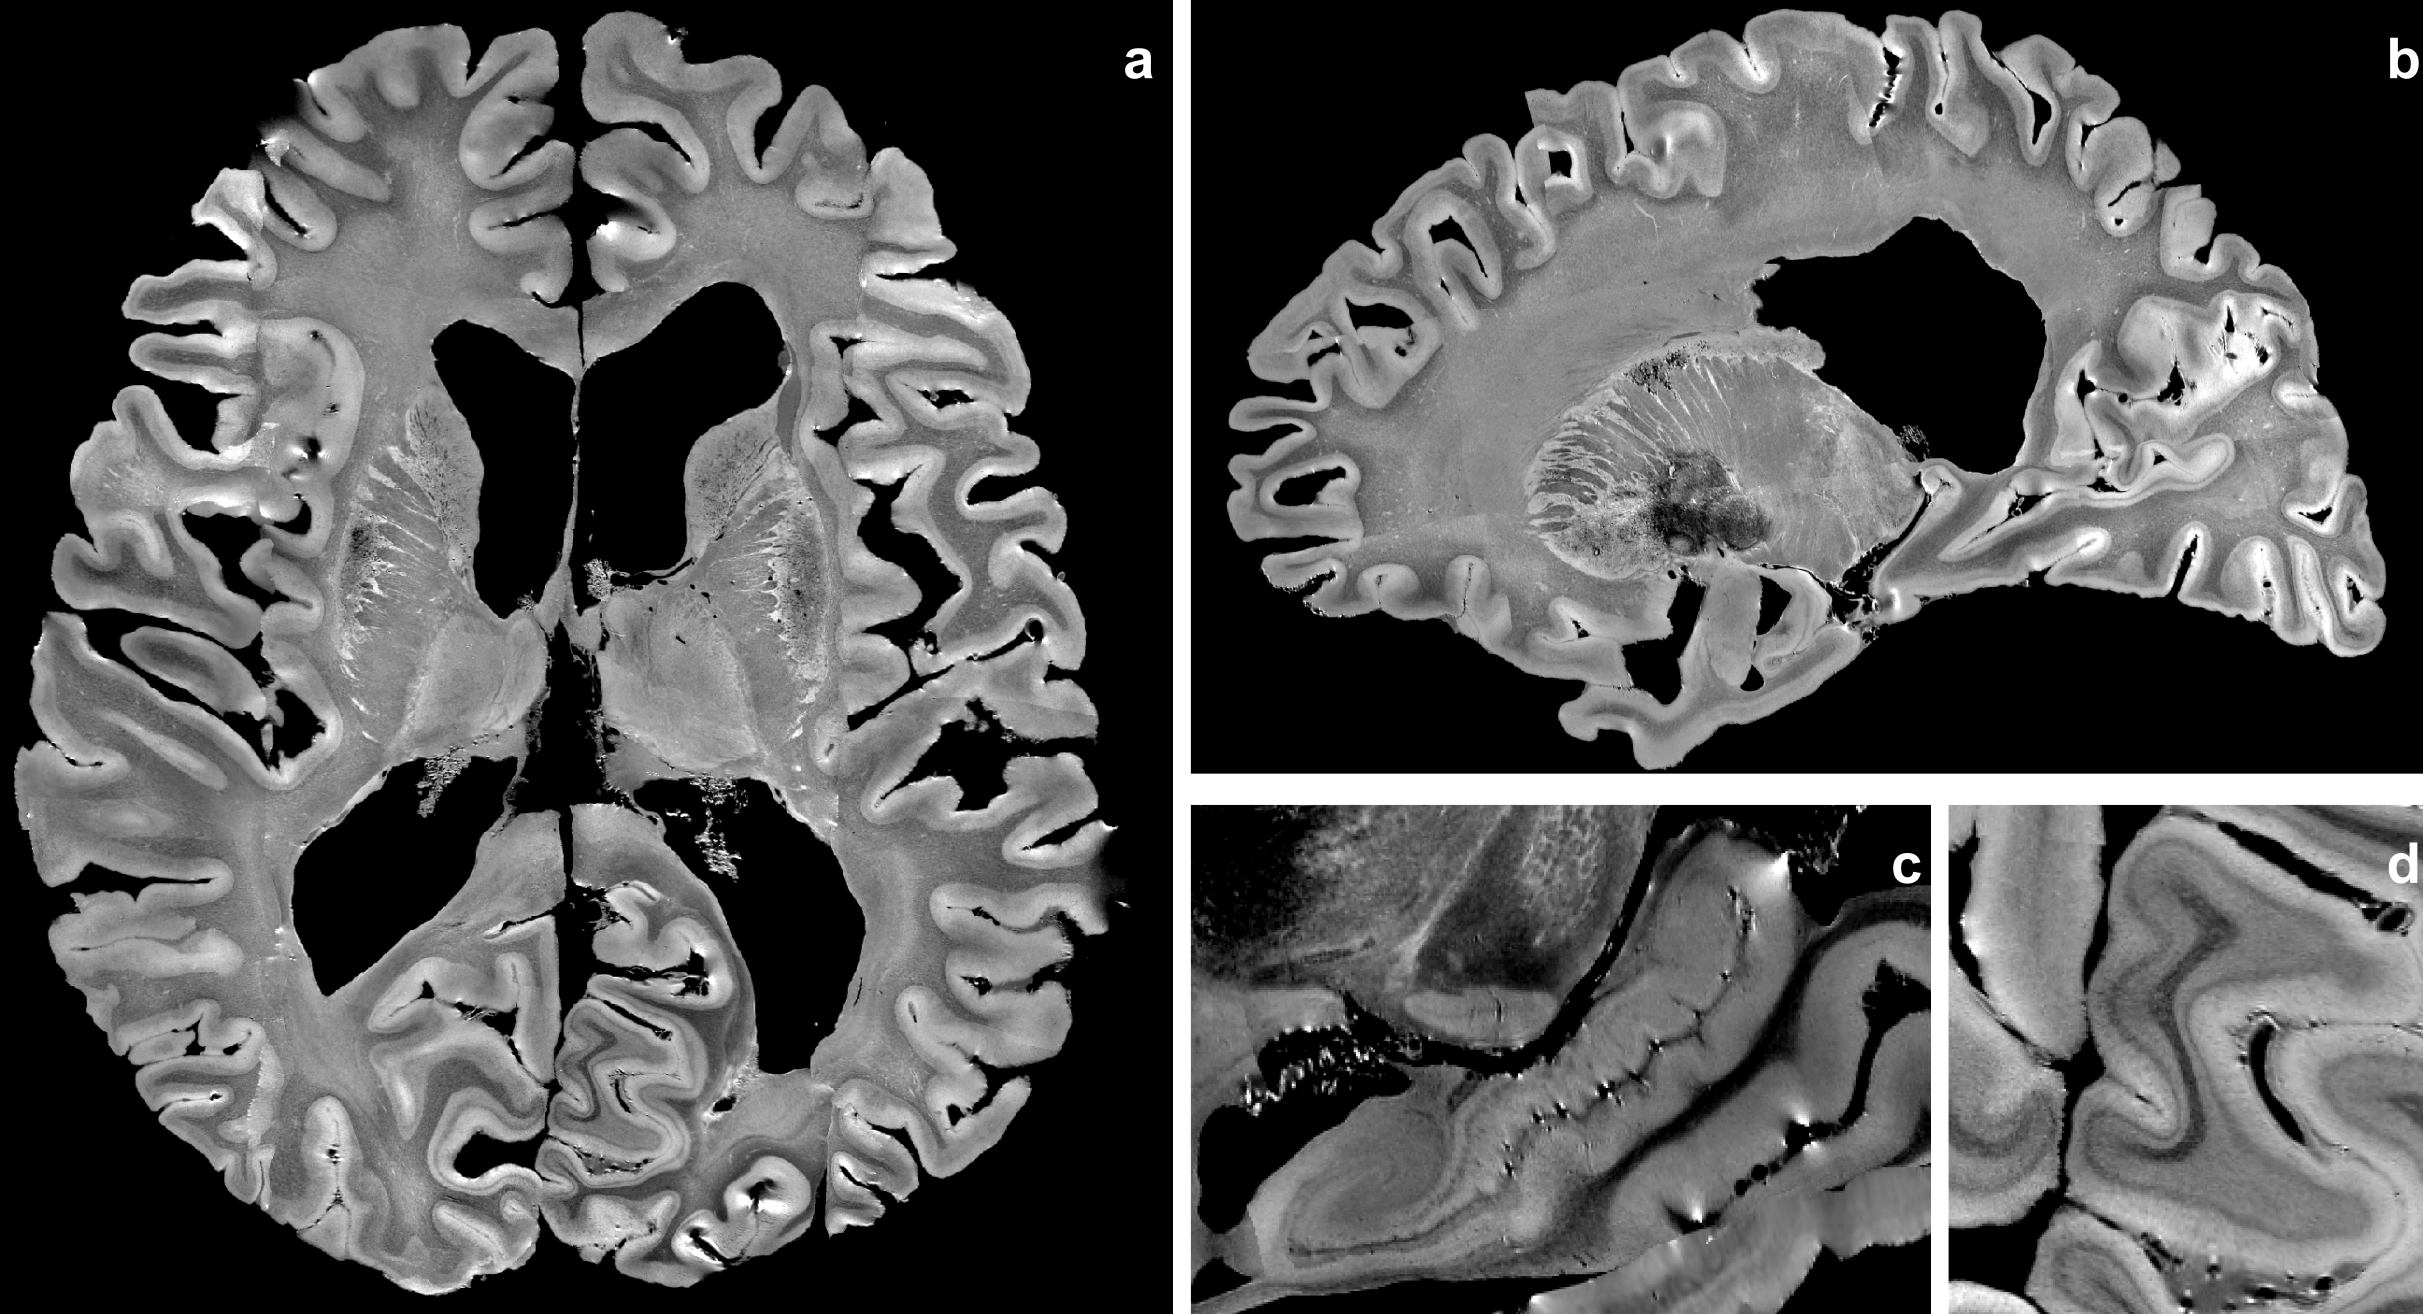
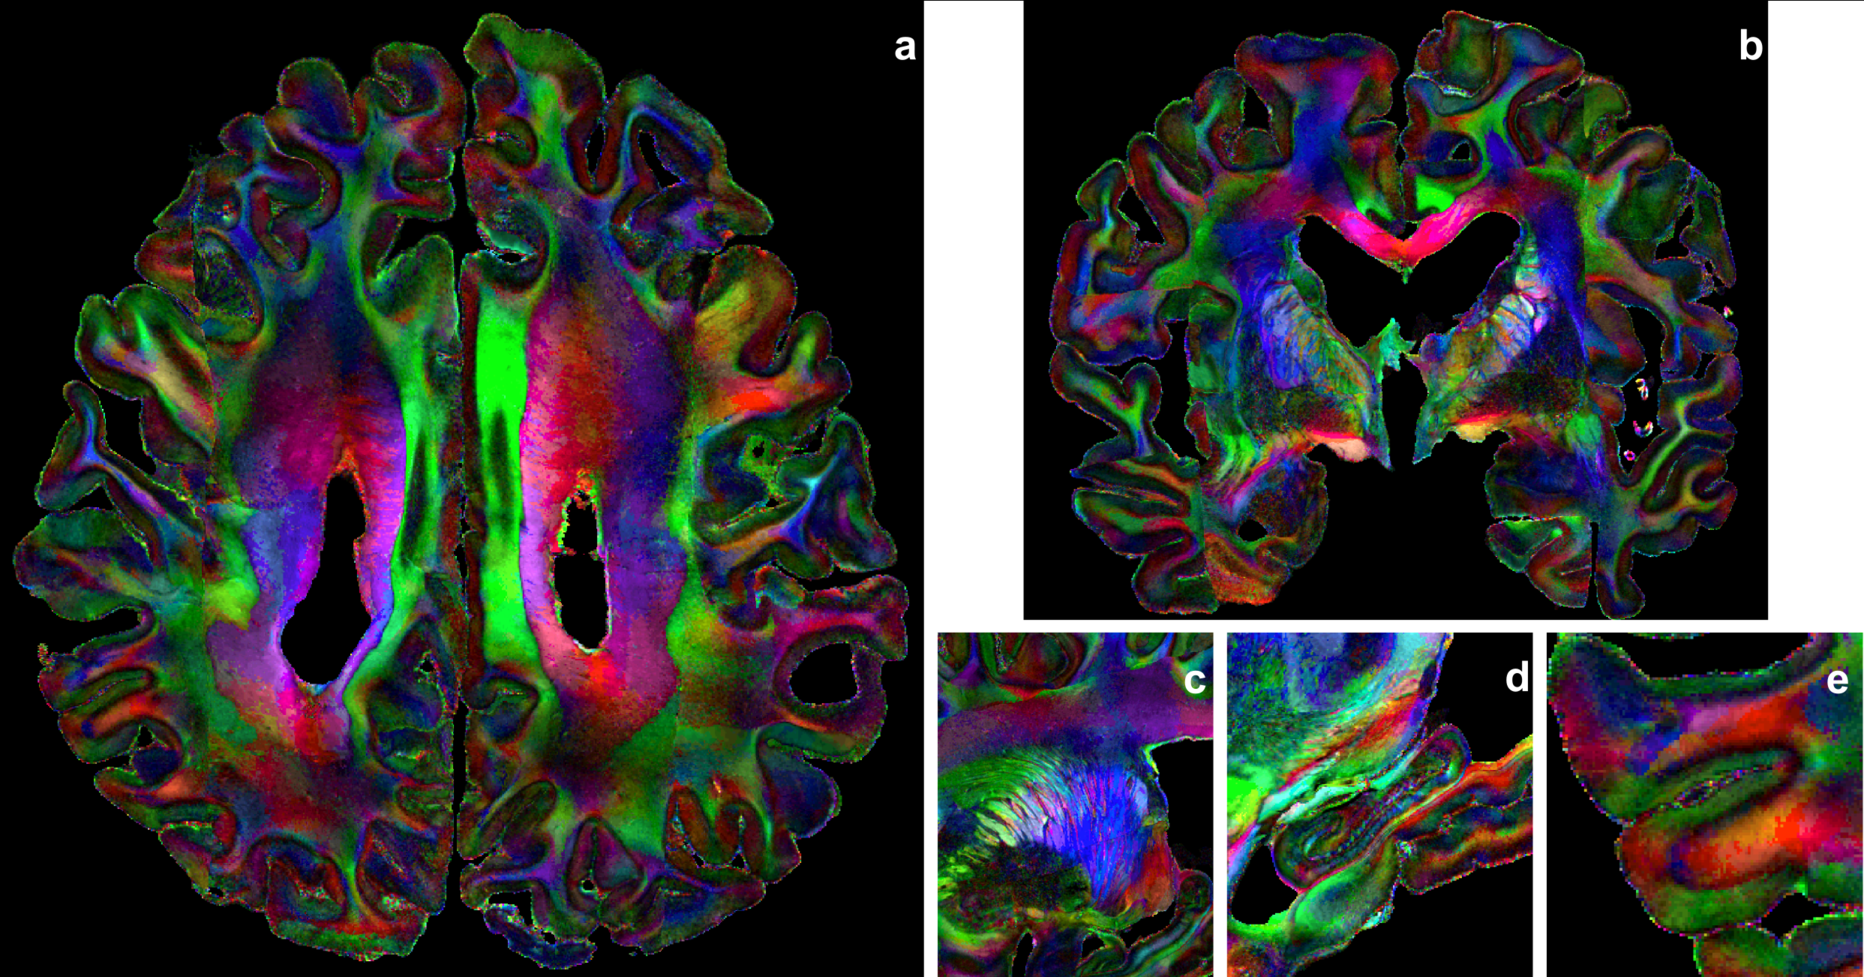
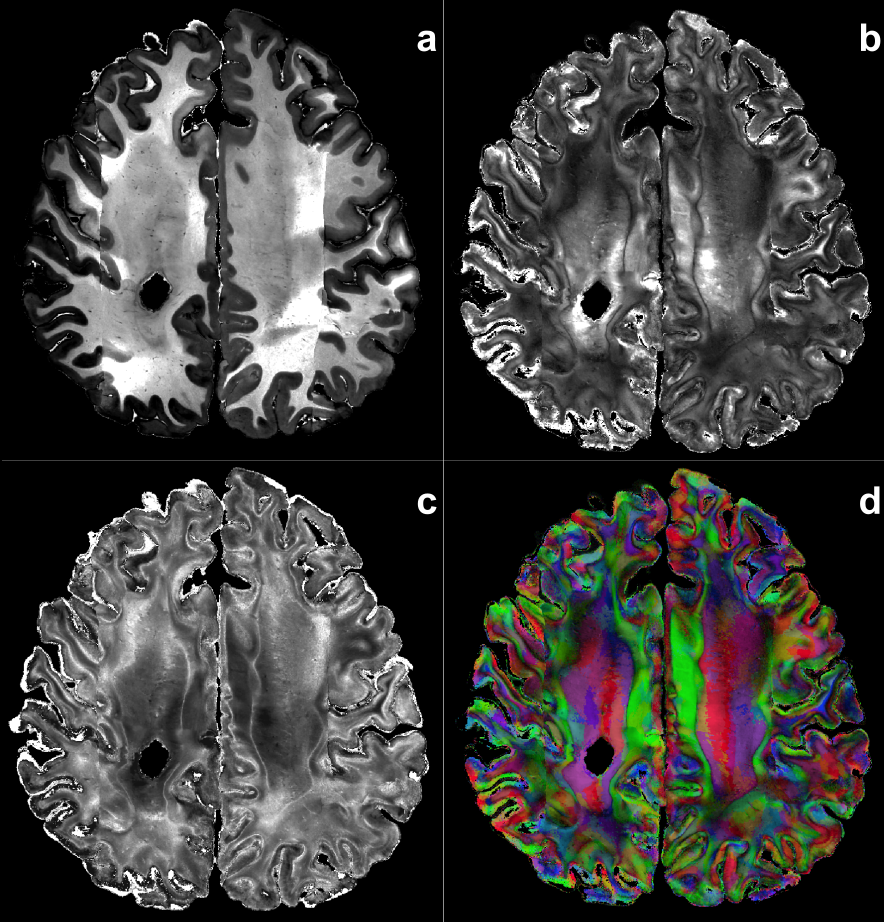
Anatomical MRI - Figure 2 depicts the 100μm T2-weighted MRI dataset and shows a high level of details within gray and white matter structures. The superficial white matter (WM) regions depict a specific contrast corresponding to the loco-regional WM bundles which seems to differ from the deep WM (Fig2ab). Fine anatomical structures like the hippocampus sub-regions are also revealed(Fig2c), as well as the cortex laminar structure(Fig2d). A comparable 100μm MRI scan, relying on a T2* contrast, has been published recently10. Both scans are complementary and are worth being compared in the future.Diffusion MRI - As shown in Fig3ab, diffusion MRI at 200μm provides a unique immersion into the fine microstructure-related anatomy in gray and white matter that cannot be reached at lower resolution. For instance, Fig3c clearly shows the 90° turn of the thalamic radiations towards the frontal lobe that cannot be assessed from in vivo millimeter diffusion scans. Fig3d depicts the great variability of the diffusion anisotropy and fiber orientation within the hippocampus. Fig3e highlights the orientational coherence existing within the cortical ribbon.
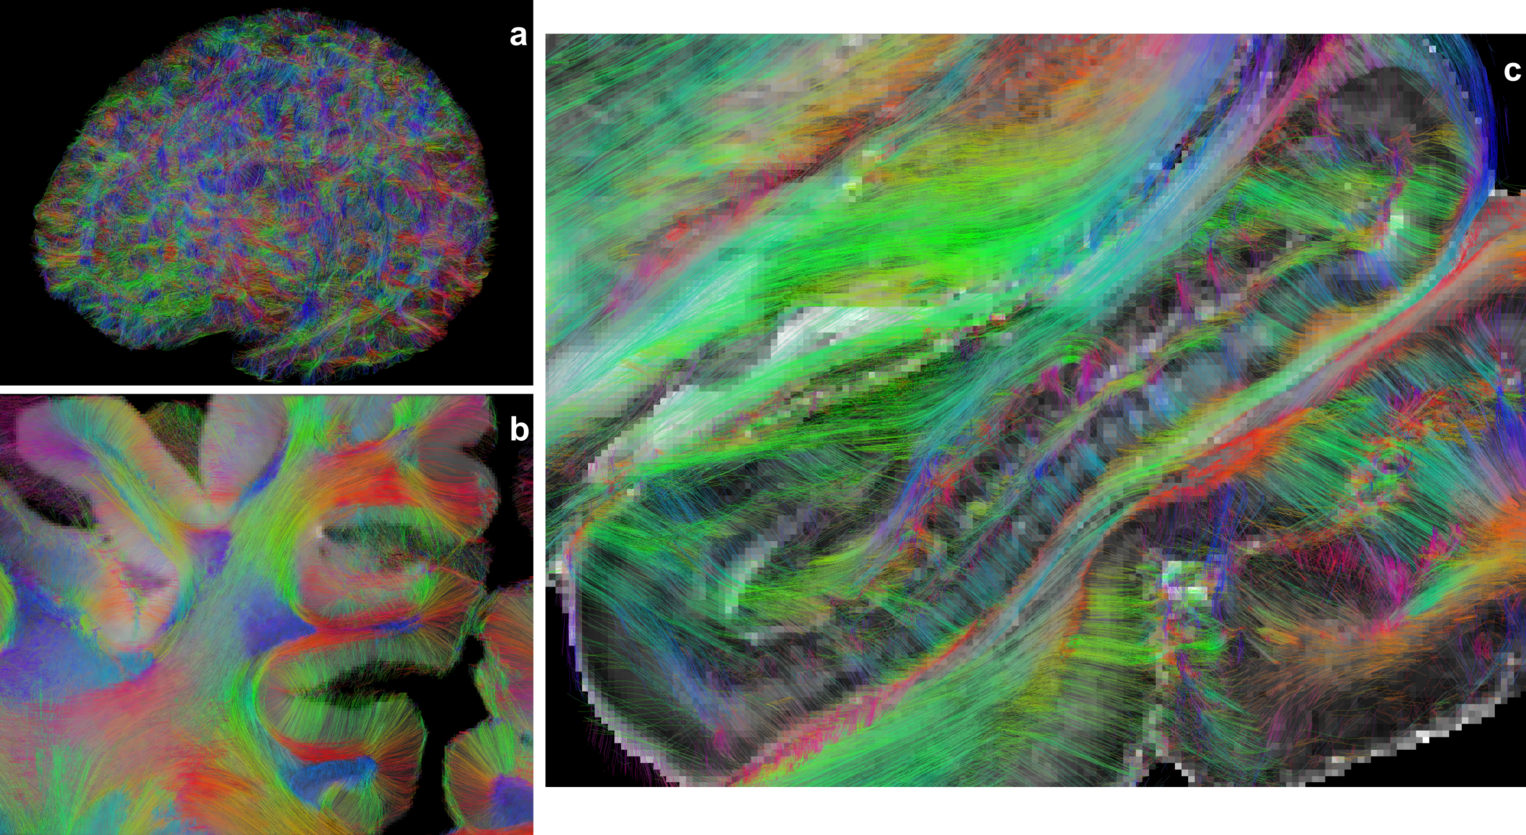
Structural connectivity - Figure 4a provides a rendering of the whole brain connectogram comprising more than 100 million fibers, established using a single seed per voxel. The mesoscopic resolution allows to finely reconstruct tracts at the level of the gyri or entering the cortex (Fig4b). In particular, the precision of the tractogram in the hippocampus (Fig4c), may allow to broaden previous studies11 and investigate the inner polysynaptic and direct pathways of the hippocampus as well as its outer connectivity to the medial temporal cortex.
Tissue microstructure - Fig5 provides renderings of mesoscopic neurite density maps (ICVF) and of their orientation dispersion showing the potential contribution of these cytoarchitectural features to better delineate the sub-regions of anatomical structures, like the hippocampus sub-regions.
Conclusion
The Chenonceau study presents the achievement of a long 2.5 years acquisition campaign, aimed at providing the diffusion MRI community with an anatomical and diffusion 11.7T MRI dataset of an entire ex vivo human brain, at an unprecedented mesoscopic resolution. It is a further step towards imaging the ground-truth anatomy and its analysis will certainly allow to better understand the human connectome at a finer scale.Acknowledgements
This project/research has received funding from the European Union’s Horizon 2020 FrameworkProgramme for Research and Innovation under the Specific Grant Agreement No. 945539 (Human Brain Project SGA3).References
[ 1 ] Klaus Maier-Hein et al.. “The challenge of mapping the human connectome based on diffusion tractography.” Nature Communications, Nature Publishing Group, 2017, 8 (1)
[ 2 ] Pallebage-Gamarallage, Menuka, et al. "Dissecting the pathobiology of
altered MRI signal in amyotrophic lateral sclerosis: a post mortem whole
brain sampling strategy for the integration of ultra-high-field MRI and
quantitative neuropathology." BMC neuroscience 19.1 (2018): 11.
[ 3 ] Fritz FJ, Sengupta S et al. “Ultra-high resolution and multi-shell
diffusion MRI of intact ex vivo human brains using kT-dSTEAM at 9.4T.”
Neuroimage. 2019 Nov 15;202:116087.
[ 4 ] Foxley S, et al. “Improving diffusion-weighted imaging of post-mortem
human brains: SSFP at 7 T.” Neuroimage. 2014 Nov 15;102 Pt 2:579-89.
[ 5 ] Jones DK, et al., “Microstructural imaging of the human brain with a 'super-scanner': 10 key advantages of ultra-strong gradients for diffusion MRI. Neuroimage. 2018 Nov 15;182:8-38.
[ 6 ] Avants, Brian B., et al. "Symmetric diffeomorphic image registration with cross-correlation: evaluating automated labeling of elderly and neurodegenerative brain." Medical image analysis 12.1 (2008): 26-41.
[ 7 ] Perrin M. et al. “Fiber Tracking in q-Ball Fields Using Regularized Particle Trajectories”. In: Christensen G.E., Sonka M. (eds) Information Processing in Medical Imaging. IPMI 2005. Lecture Notes in Computer Science, vol 3565.
[ 8 ] Descoteaux M. et al. “Regularized, fast, and robust analytical Q-ball imaging.” Magn Reson Med. 2007 Sep;58(3):497-510.
[ 9 ] Zhang, Hui, et al. "NODDI: practical in vivo neurite orientation dispersion and density imaging of the human brain." Neuroimage61.4(2012): 1000-1016.
[ 10 ] Edlow, Brian L., et al. "7 Tesla MRI of the ex vivo human brain at 100 micron resolution." Scientific data 6.1 (2019): 1-10.
[ 11 ] Beaujoin J et al. “Post-mortem inference of the human hippocampal connectivity and microstructure using ultra-high field diffusion MRI at 11.7 T.” Brain Struct Funct. 2018 Jun;223(5):2157-2179.
Figures