0213
Redefining the architecture of white matter damage in paediatric concussions and their relationship with symptoms1Department of Neurology and Neurosurgery, McGill University, Montreal, QC, Canada, 2Neuroscience and Mental Health Program, Hospital for Sick Children, Toronto, ON, Canada, 3Department of Physiology, University of Toronto, Toronto, ON, Canada, 4Department of Biomedical Engineering, McGill University, Montreal, QC, Canada, 5Department of Computer Science, Université de Sherbrooke, Sherbrooke, QC, Canada
Synopsis
Concussion heterogeneity remains a major challenge for clinical and scientific research. Yet, most studies continue to employ group comparison approaches that assume consistent one-to-one relationships between brain structure and symptoms. To parse concussion heterogeneity, we employed a double-multivariate approach using diffusion MRI of children with histories of concussion. Multivariate white-matter structural features captured more information about symptoms than all individual features. Results also revealed how different white-matter abnormalities led to similar symptom profiles. Lastly, multivariate features significantly predicted adverse psychiatric outcomes. These results suggest that concussion heterogeneity arising from complex structure/symptom relationships can be well captured by our double-multivariate approach.
Introduction
Concussion heterogeneity has been identified as a major obstacle within clinical and basic science research.1 However, studies continue to assume consistent, one-to-one structure/symptom relationships and employ traditional group comparisons, averaging out idiosyncratic patterns in favour of shared ones. Studies have attempted to parse clinical heterogeneity by clustering patients based on symptoms.2-3 Heterogeneity of white matter structure in concussions has also been addressed through the use of approaches aimed at summarizing deviations from healthy controls in multivariate space.4-5 However, no studies have considered heterogeneity in brain structure and symptoms simultaneously. Brain abnormalities due to concussion are diffuse and can elicit several symptoms that may interact with each other, potentially creating multi-tract/multi-symptom relationships. In this study, we leveraged advanced diffusion MRI (dMRI) methods as well as a double-multivariate approach to parse concussion heterogeneity in white matter structure and symptoms simultaneously.Methods
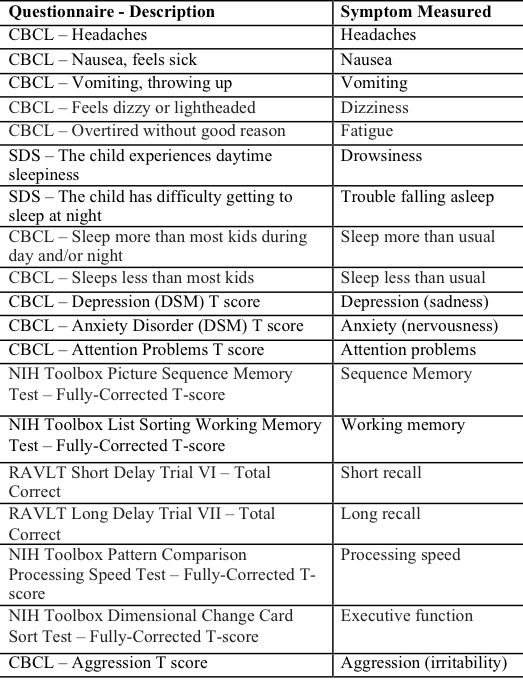
Within the Adolescent Brain and Cognitive Development dataset,6 we identified 306 children ages 9-10 with a history of concussion who had behavioural measures reflecting different concussion symptoms (FIGURE 1), diffusion-weighted (1.7mm isotropic, b500 (6-directions), b1000 (15-directions), b2000 (15-directions), b3000 (60-directions)) and T1-weighted scans (1mm isotropic). We processed imaging data using Tractoflow7 and Freesurfer to fit Desikan-Killiany-Tourville parcellations.8 We applied these parcellations to tractograms to build connectivity matrices which we thresholded by only keeping connections that existed across 90% of participants. We split the dataset into a discovery set (n=214) and a replication set (n=92) and weighted connectivity matrices in the discovery set by fractional anisotropy, mean, radial, axial diffusivities, number of fiber orientations, and apparent fiber density along fixels (AFDf). We then performed principal components analysis (PCA) on the concatenated set of measures across subjects and connections, generating connectivity matrices weighted by principal component (PC) scores. We selected the top 200 connections most correlated with any symptom. Using this and the symptom data, we performed partial least squares correlation (PLSc) analysis. This approach allowed us to identify latent modes, combinations of connectivity features (“connectivity latent factors (LFs)”) that maximally covaried with combinations of symptoms (“symptom LFs”). We assessed the significance of each mode through permutation testing, and determined which individual variables significantly contributed to each LF through bootstrapping analyses. Finally, we used the expression of connectivity LFs to predict adverse psychiatric outcome, defined as any current psychiatric diagnosis obtained from the Kiddie Schedule for Affective Disorders and Schizophrenia.Results
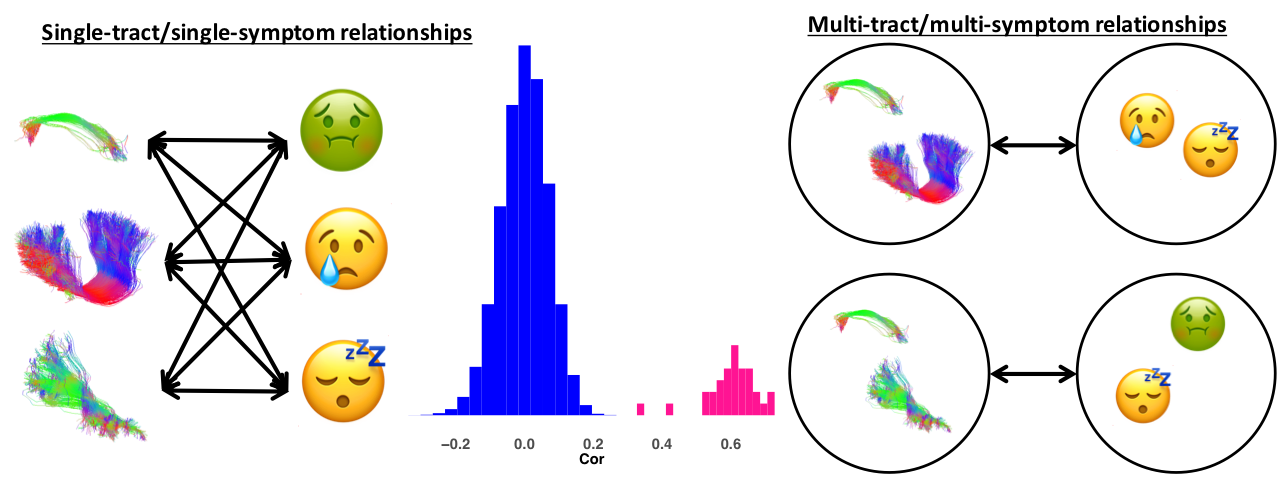
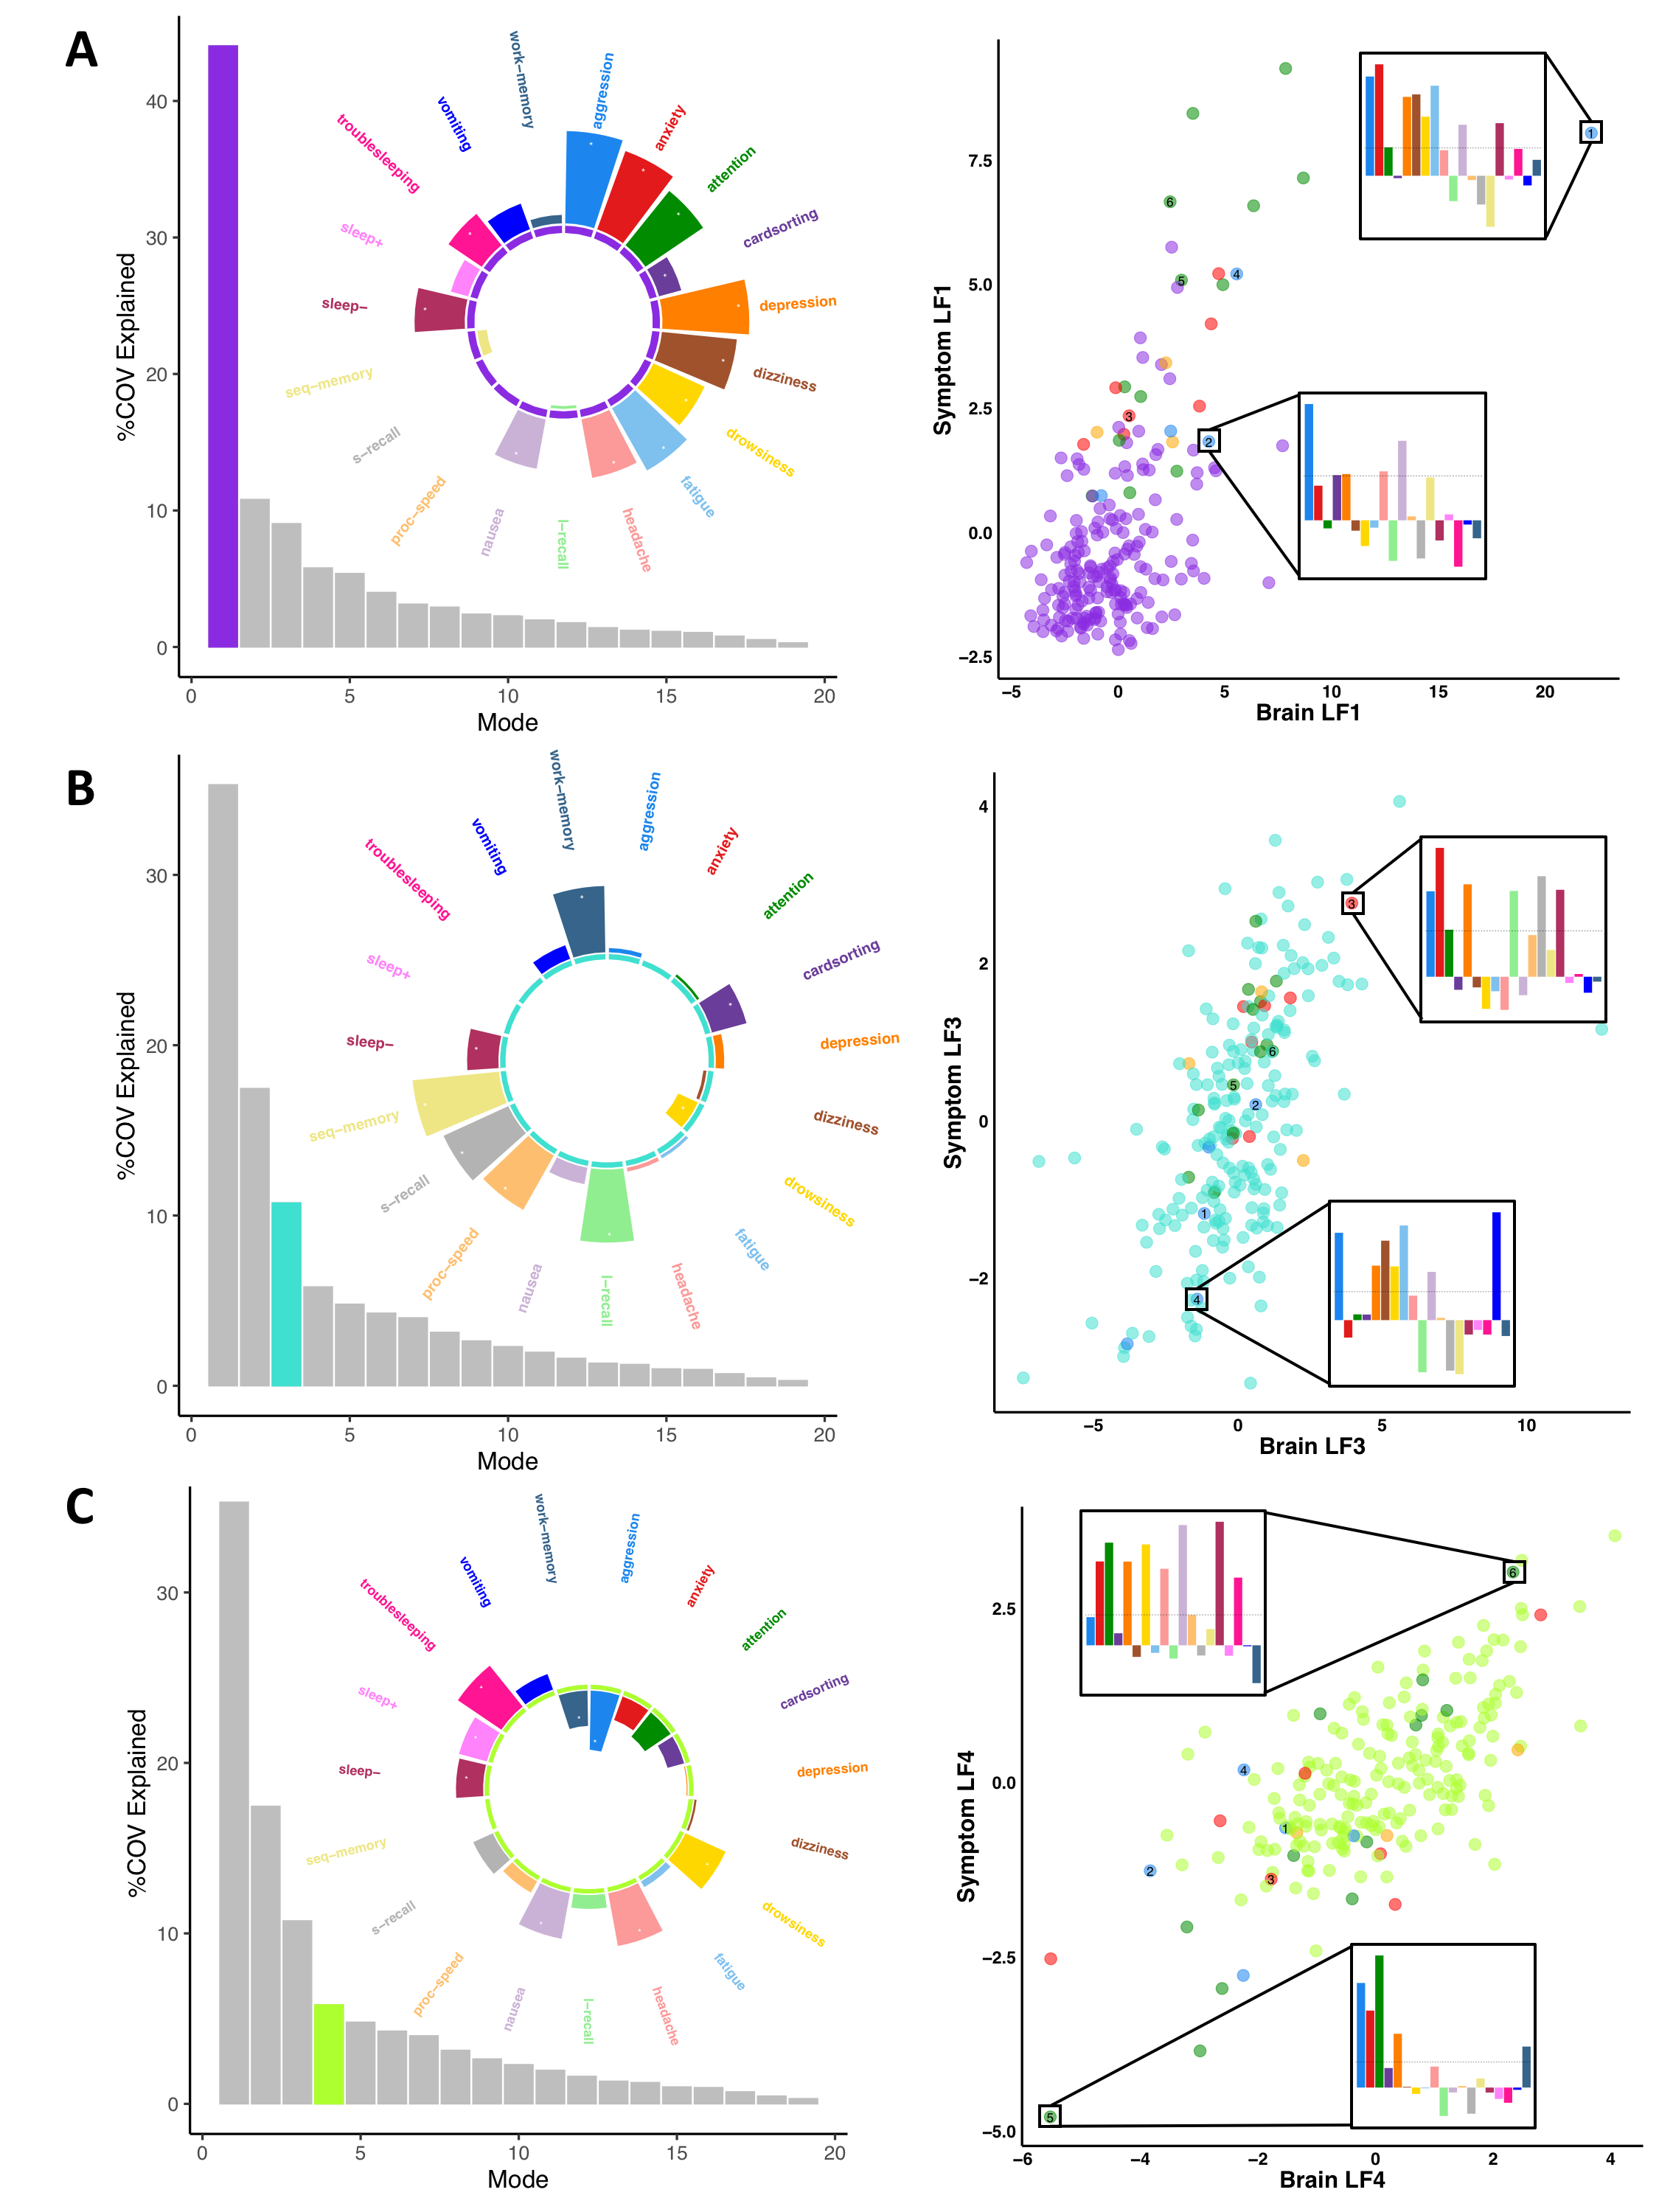
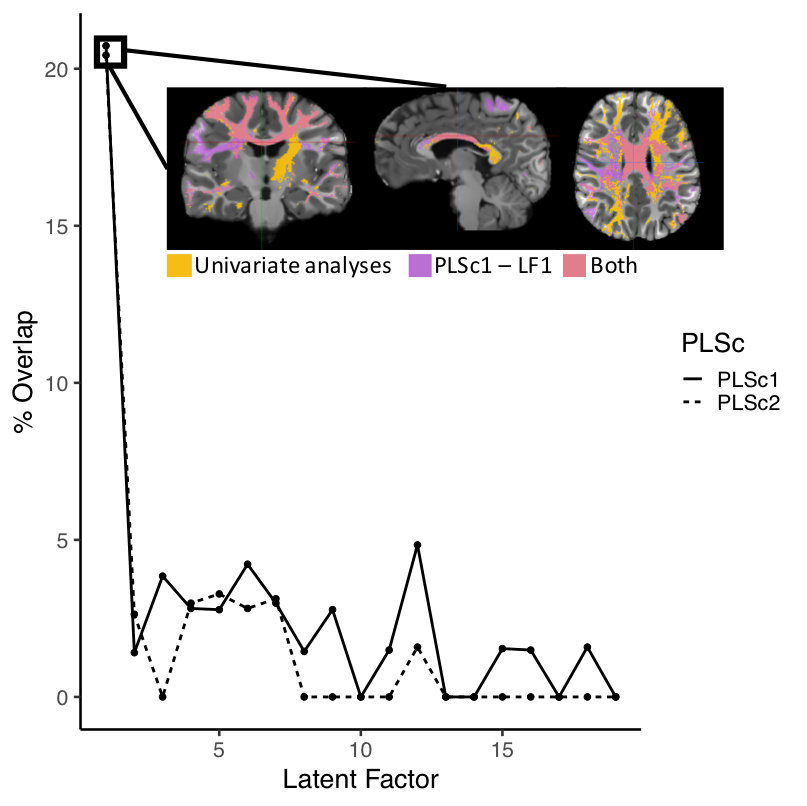
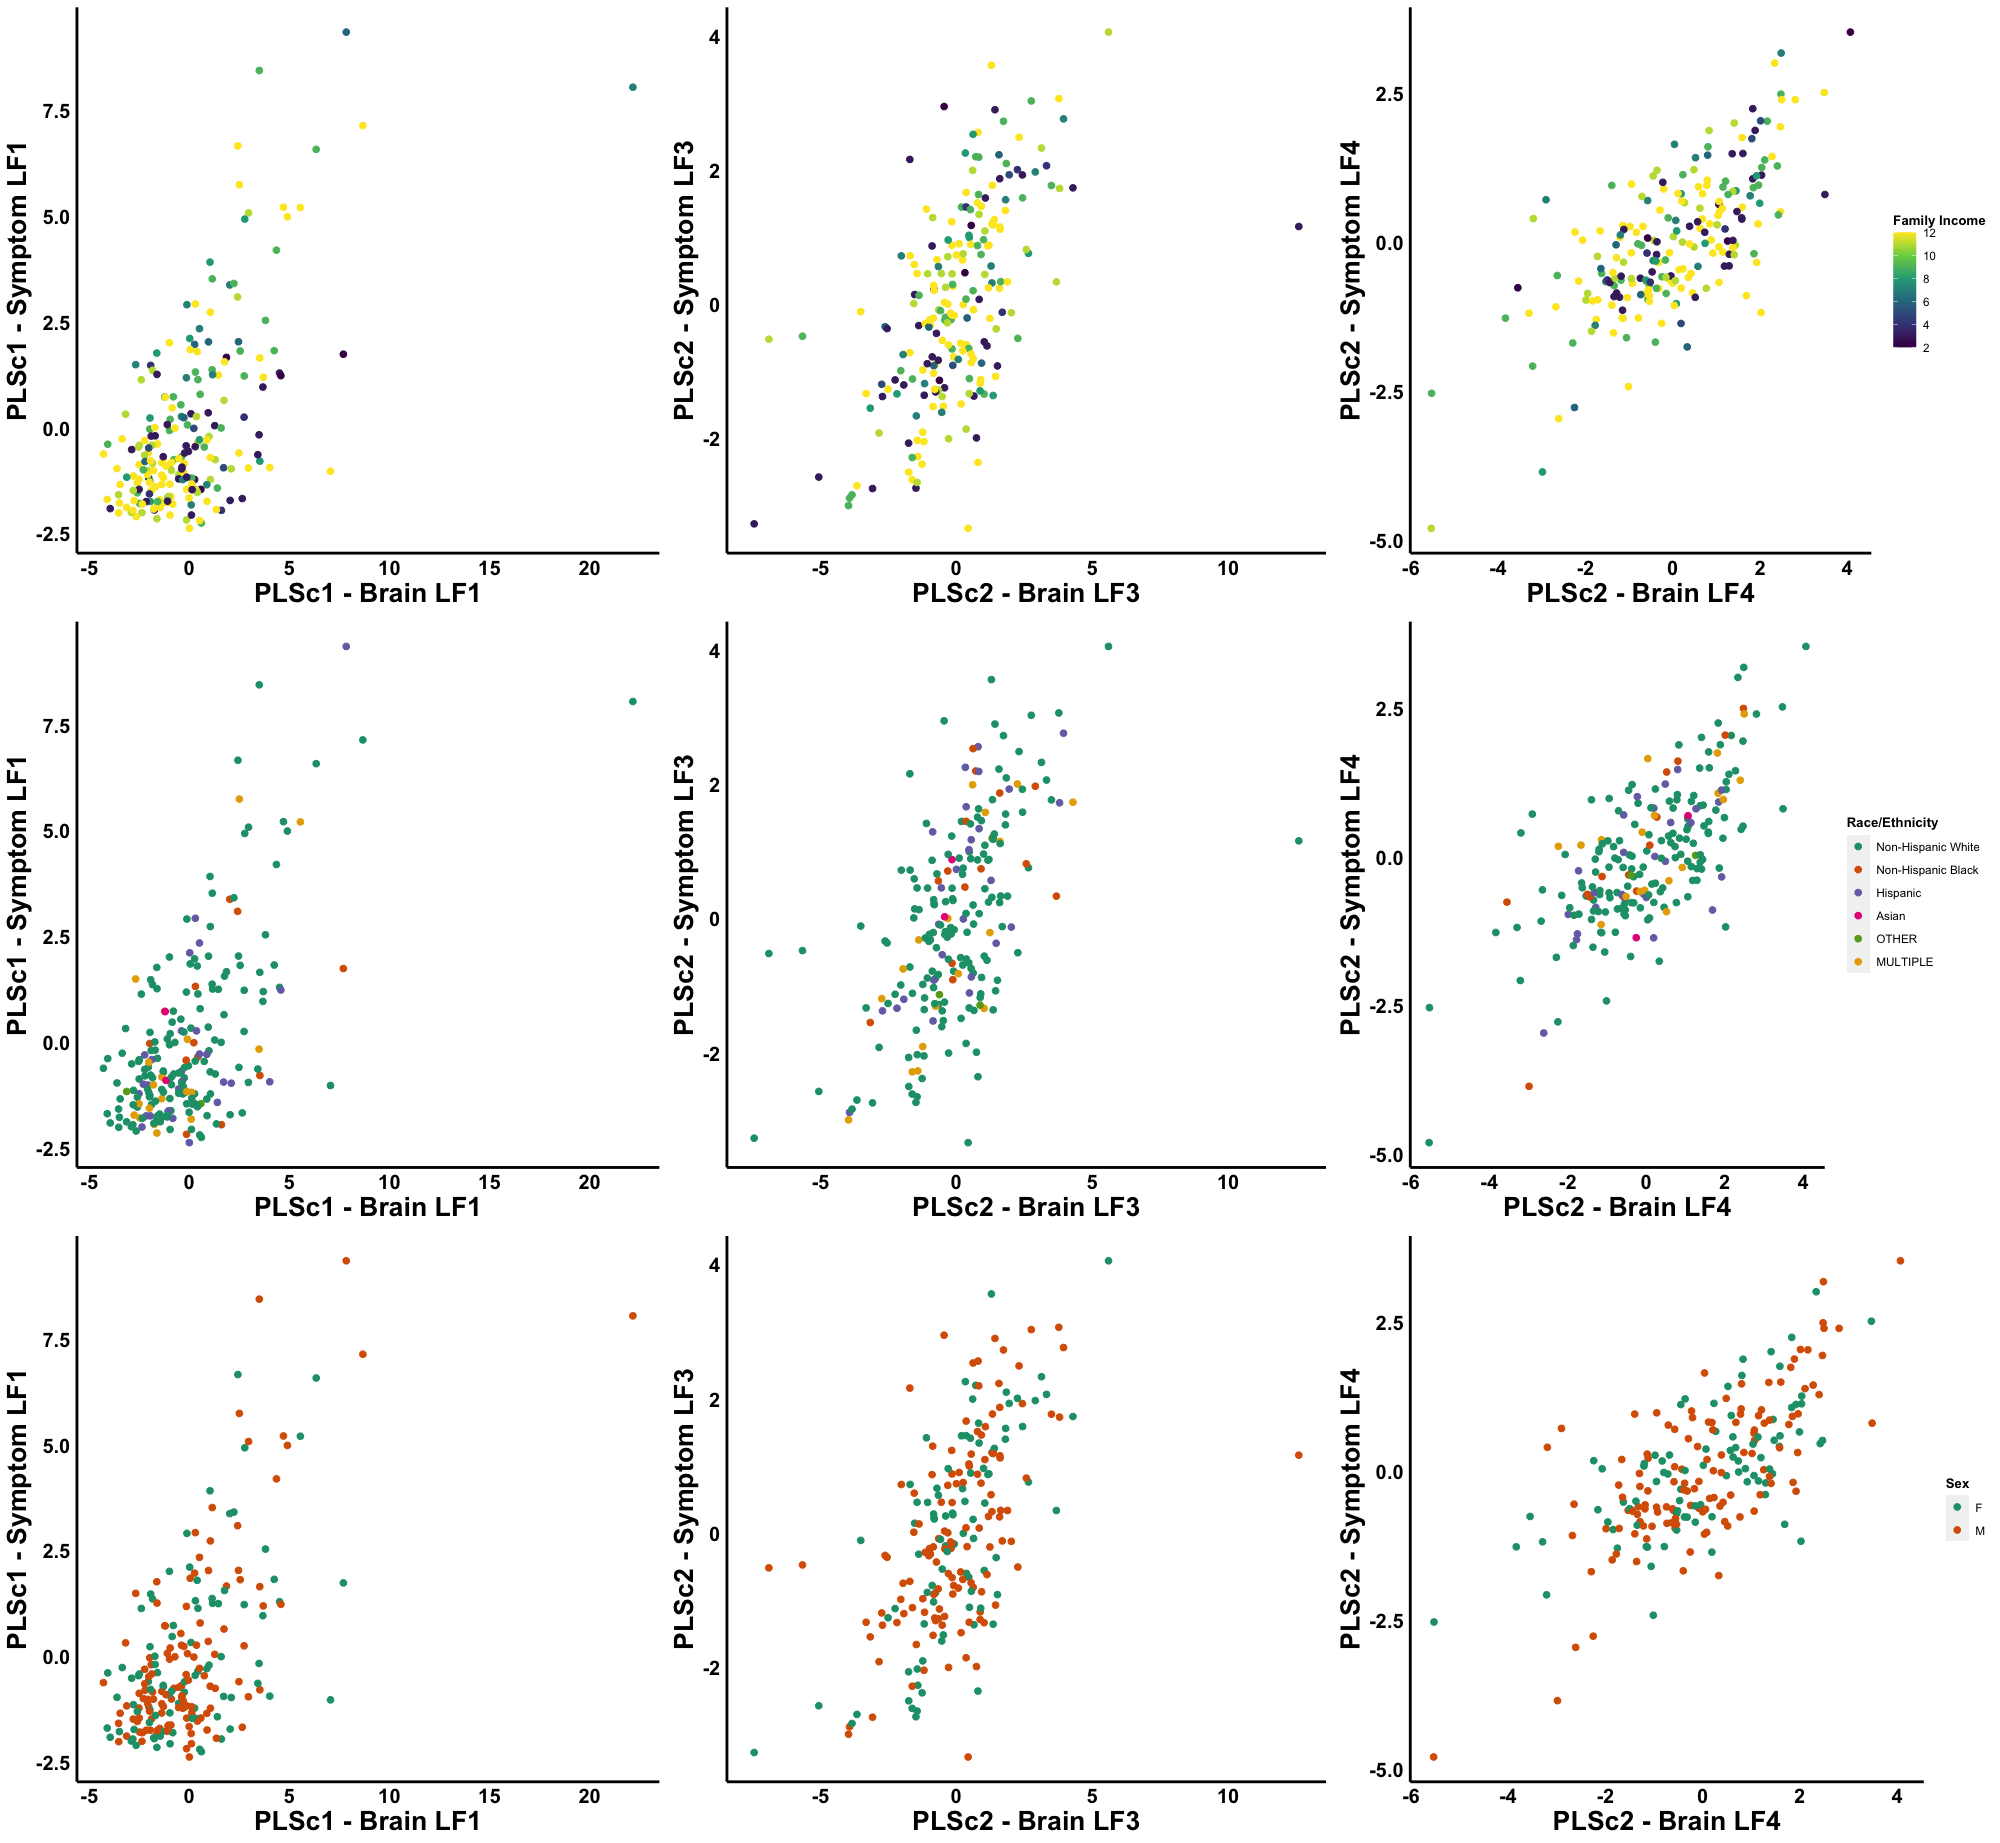
With our PCA, we identified two biologically-interpretable components that explained 97% of the variance in dMRI measures. The first (PC1) represented all diffusion measures except AFDf, whereas the second (PC2) reflected AFDf exclusively. Correlations between connectivity/symptom LFs across all modes were higher than all single-tract/single-symptom correlations (FIGURE 2). We identified 28 individuals with scores above 70 in Child-Behavioural-Checklist (CBCL) Attention Problems, Depression, Anxiety, or Aggression scales, considered to be the clinical range.10 Despite belonging to the same clinical group, these individuals were differentiable in symptom and connectivity LF spaces (FIGURE 3). We compared ECN and LCN scores across all 200 connections between individuals with and without clinical-level CBCL scores, and calculated how many connections were also significant in multivariate analyses. The highest overlap occurred with LF1 (21-22%) from both PLSc analyses (FIGURE 4). LFs were equivalently expressed across the studied sociodemographic strata (FIGURE 5). Finally, using PC1 scores from the discovery set, we identified 6 connectivity LFs, 2 behavioural measures (CBCL Attention Problems and Anxiety), and one single tract that predicted adverse psychiatric outcome. We projected connectivity features for the previously-unseen 92 children onto PC1 space, selected the same 200 features, and projected this data onto the latent spaces of the 6 relevant LFs identified in the discovery set. On this unseen data, after accounting for CBCL measures of psychopathology and PC1 score for the connection identified in univariate analyses, two LFs significantly predicted adverse psychiatric outcome.Discussion
In the present study, we leveraged novel dMRI methods and a double-multivariate approach to derive informative cross-demographic latent representations of multi-tract/multi-symptom relationships. Participants with clinical-level psychopathology displayed marked differences in symptom and connectivity LF expression. Univariate group comparisons identified connections that overlapped with LF1 from both PLSc analyses. These first modes, which explained the most covariance, displayed high loadings on all symptoms, reflecting general problems, not specifically psychopathology. Both connectivity LF1s and univariate analyses strongly implicated callosal tracts, consistent with previous group-comparison studies. These results confirm that, by pooling participants, even univariate group comparisons based on clinically-meaningful categories identify shared connectivity differences at the expense of more symptom-specific idiosyncratic features. The present multivariate features were expressed similarly across sociodemographic drivers of white matter structure. To account for heterogeneity in pre-injury factors, ongoing large-scale studies are collecting data across sociodemographic strata.10-12 The present results suggest that cross-demographic features may also be important drivers of concussion heterogeneity. Finally, expression of two connectivity LFs predicted psychiatric diagnoses in a previously-unseen dataset after controlling for behavioural measures of psychopathology and structure in tracts identified in univariate analyses, demonstrating the clinical potential of the present approach.Conclusion
Leveraging advanced dMRI and a double-multivariate approach to parse concussion heterogeneity may lead to improved stratification strategies and identification of treatment targets for the benefit of future clinical trials and basic science studies.Acknowledgements
We would like to thank Dr. Derek Beaton, Ms. Eman Nishat, Dr. Manon Edde, Dr. Rajeet Singh Saluja, and Dr. Jen-Kai Chen for their helpful comments on this project.References
1. Kenzie, E. S., Parks, E. L., Bigler, E. D., Lim, M. M., Chesnutt, J. C., & Wakeland, W. (2017). Concussion As a Multi-Scale Complex System: An Interdisciplinary Synthesis of Current Knowledge. Front Neurol, 8, 513. doi:10.3389/fneur.2017.005132.
2. Yeates, K. O., Tang, K., Barrowman, N., Freedman, S. B., Gravel, J., Gagnon, I., . . . Pediatric Emergency Research Canada Predicting Persistent Postconcussive Problems in Pediatrics Concussion, T. (2019). Derivation and Initial Validation of Clinical Phenotypes of Children Presenting with Concussion Acutely in the Emergency Department: Latent Class Analysis of a Multi-Center, Prospective Cohort, Observational Study. J Neurotrauma, 36(11), 1758-1767. doi:10.1089/neu.2018.60093.
3. Langdon, S., Konigs, M., Adang, E., Goedhart, E., & Oosterlaan, J. (2020). Subtypes of Sport-Related Concussion: a Systematic Review and Meta-cluster Analysis. Sports Med, 50(10), 1829-1842. doi:10.1007/s40279-020-01321-94.
4. Ware, J. B., Hart, T., Whyte, J., Rabinowitz, A., Detre, J. A., & Kim, J. (2017). Inter-Subject Variability of Axonal Injury in Diffuse Traumatic Brain Injury. J Neurotrauma, 34(14), 2243-2253. doi:10.1089/neu.2016.48175.
5. Taylor, P. N., Moreira da Silva, N., Blamire, A., Wang, Y., & Forsyth, R. (2020). Early deviation from normal structural connectivity: A novel intrinsic severity score for mild TBI. Neurology, 94(10), e1021-e1026. doi:10.1212/WNL.00000000000089026.
6. Garavan, H., Bartsch, H., Conway, K., Decastro, A., Goldstein, R. Z., Heeringa, S., . . . Zahs, D. (2018). Recruiting the ABCD sample: Design considerations and procedures. Dev Cogn Neurosci, 32, 16-22. doi:10.1016/j.dcn.2018.04.0047.
7. Theaud, G., Houde, J. C., Bore, A., Rheault, F., Morency, F., & Descoteaux, M. (2020). TractoFlow: A robust, efficient and reproducible diffusion MRI pipeline leveraging Nextflow & Singularity. Neuroimage, 218, 116889. doi:10.1016/j.neuroimage.2020.1168898.
8. Klein, A., & Tourville, J. (2012). 101 labeled brain images and a consistent human cortical labeling protocol. Front Neurosci, 6, 171. doi:10.3389/fnins.2012.001719.
9. Biederman, J., Monuteaux, M. C., Kendrick, E., Klein, K. L., & Faraone, S. V. (2005). The CBCL as a screen for psychiatric comorbidity in paediatric patients with ADHD. Arch Dis Child, 90(10), 1010-1015. doi:10.1136/adc.2004.05693710.
10. Yue, J. K., Vassar, M. J., Lingsma, H. F., Cooper, S. R., Okonkwo, D. O., Valadka, A. B., . . . Investigators, T.-T. (2013). Transforming research and clinical knowledge in traumatic brain injury pilot: multicenter implementation of the common data elements for traumatic brain injury. J Neurotrauma, 30(22), 1831-1844. doi:10.1089/neu.2013.297011.
11. Dennis, E. L., Baron, D., Bartnik-Olson, B., Caeyenberghs, K., Esopenko, C., Hillary, F. G., . . . Wilde, E. A. (2020). ENIGMA brain injury: Framework, challenges, and opportunities. Hum Brain Mapp. doi:10.1002/hbm.2504612.
12. Tosetti, P., Hicks, R. R., Theriault, E., Phillips, A., Koroshetz, W., Draghia-Akli, R., & Workshop, P. (2013). Toward an international initiative for traumatic brain injury research. J Neurotrauma, 30(14), 1211-1222. doi:10.1089/neu.2013.2896
Figures