0210
Unique insights into visual network development over childhood and adolescence from microstructure informed tractography1Department of Computer Science, University of Verona, Verona, Italy, 2CUBRIC, School of Psychology, Cardiff University, Cardiff, United Kingdom, 3Image Sciences Institute, University Medical Center Utrecht, Utrecht, Netherlands, 4Department of Radiology, Bernard and Irene Schwartz Center for Biomedical Imaging, New York University School of Medicine, New York, NY, United States, 5Mary MacKillop Institute for Health Research, Australian Catholic University, Melbourne, Australia
Synopsis
We employed the Convex Optimization Modeling for Microstructure Informed Tractography (COMMIT) approach to construct microstructure-informed connectomes and study the distinct patterns of age-related development in structural whole-brain network and sub-networks using global graph metrics. Whole brain analyses showed that with the new edge-weighting, the shortest-path length between all pairs of nodes decreases with age and thus efficiency increases. This reduction in shortest-path length is probably driven by previously reported age-related increases in the intra-axonal signal fraction. Sub-networks analyses revealed unique visual network characteristics over development and confirmed previously observed maturational pattern of posterior regions across childhood and adolescence.
Introduction
The best way to quantify connection strength in structural connectomes is an open question1. Recent works questioned the typical way of weighting white matter connections using the streamlines count2,3. To define more quantitative edge-weights for the structural connectome, tractometry approach was introduced in4 and employed to study normal development5. This involves mapping microstructural measures along the tractography-reconstructed pathways and averaging their values for quantitative comparisons between metrics. However, when multiple bundles interdigitate within the same voxel, this approach can bias the actual microstructural content of each pathway since it is not possible to disentangle the individual contribution of each bundle to the average6. The Convex Optimization Modelling for Microstructure Informed Tractography (COMMIT7,8) approach addresses this problem by deconvolving specific microstructural features on each fibre to recover individual streamline contributions to the measured signal and has the potential to provide a more ‘biologically-informative’ assessment of brain connectivity9. Here, we apply COMMIT in a study of age-related differences in network properties.Methods
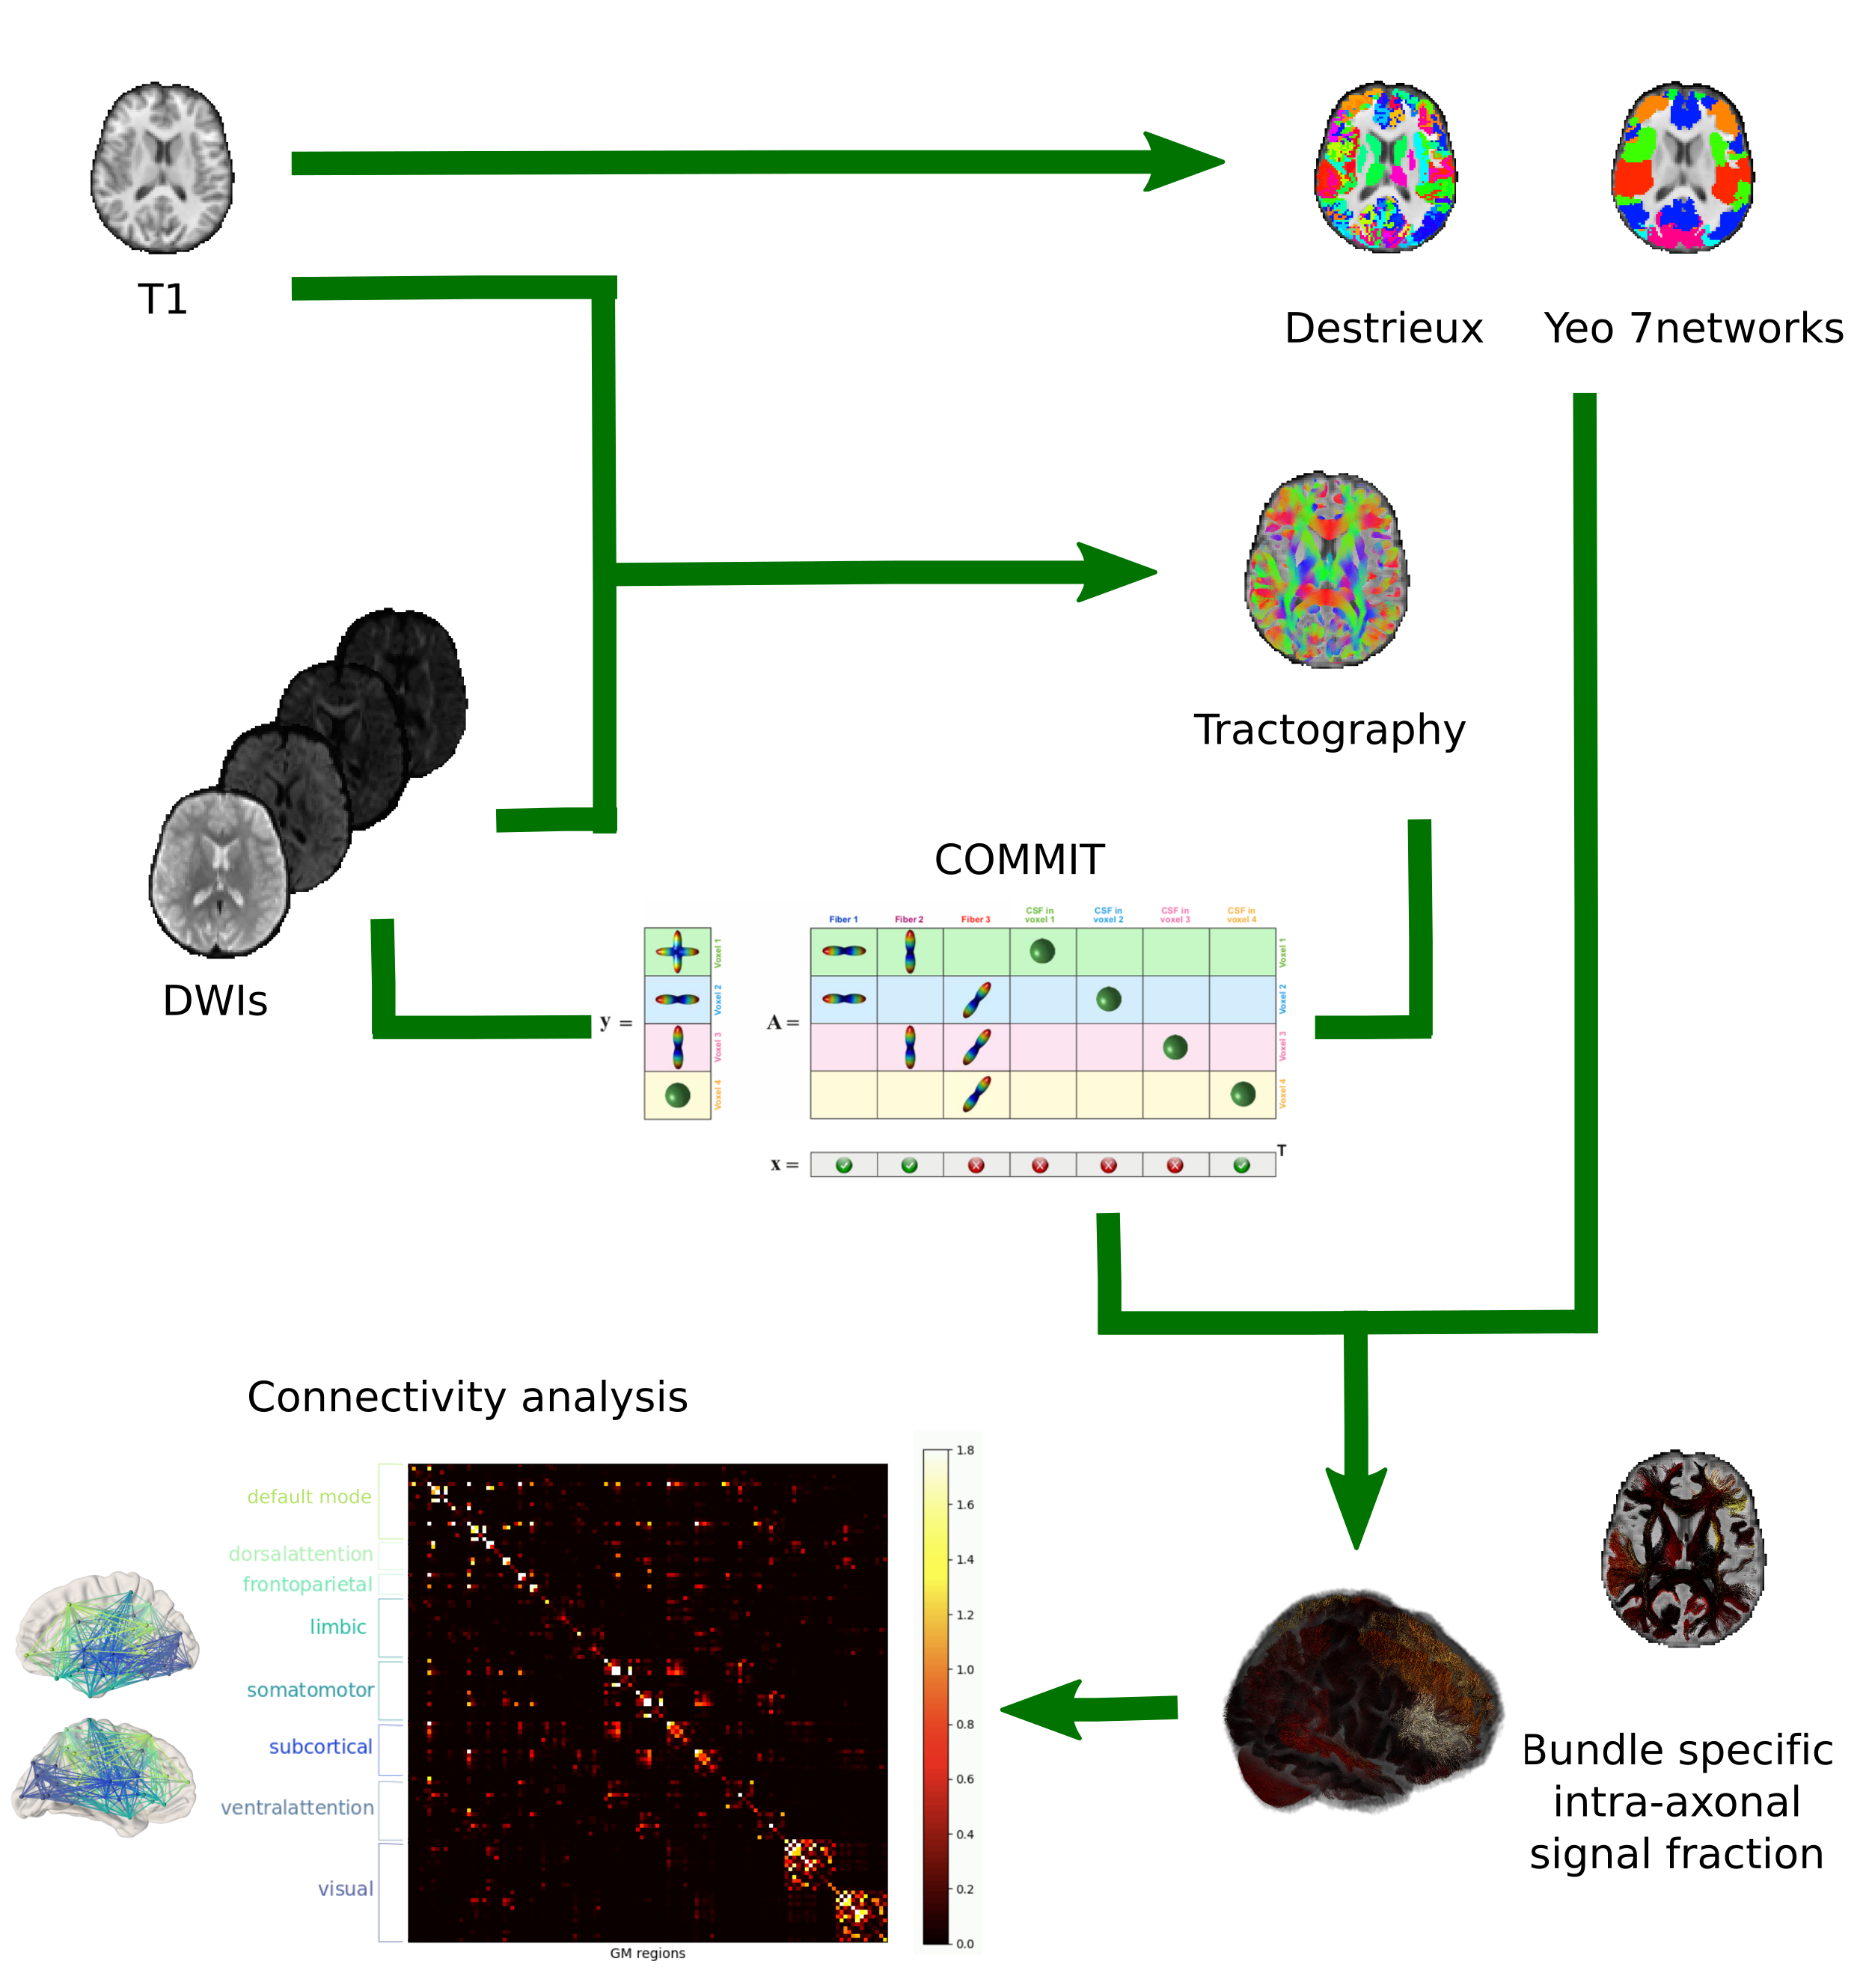
88 participants (aged 8-18yrs) were scanned on a 3T Siemens Connectom system with ultra‐strong ($$$300$$$mT/m) gradients, using: multi‐shell dMRI acquisition ($$$TE/TR=59/3000$$$ms; resolution $$$2\times2\times2$$$mm3) with $$$b\in\{500,1200,2400,4000,6000\}$$$s/mm2 in 30,30,60,60,60 directions, respectively and additional 14 $$$b=0$$$s/mm2 interleaved volumes; 3D MPRAGE ($$$TE/TR=2/2300$$$ms; resolution $$$1\times1\times1$$$mm3). dMRI data were processed as detailed in10. Additionally, we performed standard MRtrix311 probabilistic tractography and applied COMMIT with a stick-zeppelin-ball model12 to simultaneously filter out implausible streamlines and assign an intra-axonal signal fraction (IASF) to each one. To set the diffusivities in COMMIT we performed voxel-wise estimations in one young and one older subject. Although between the two subjects we observed small differences in voxel-wise estimations of $$$d_{par}$$$ and $$$d_{{par}_{zep}}$$$, when running COMMIT within the two subjects by changing these parameters we did not notice any prominent difference in the IASF assigned to the connections. Thus, for all subjects we set the following diffusivities $$$d_{par}=d_{{par}_{zep}}=1.7\times10^{-3}$$$mm2/s, $$$d_{perp}=0.6\times10^{-3}$$$mm2/s, $$$d_{iso}\in\{1.7,3.0\}\times10^{-3}$$$mm2/s. Then, connectomes were built using the FreeSurfer Destrieux parcellation13 as nodes and by assigning the total IASF associated to each bundle as edge-weights9. Finally, we overlapped the Destrieux parcels with networks from the Yeo atlas14 to obtain: default mode, dorsal attention, frontoparietal, limbic, somatomotor, ventral attention and visual networks (Figure 1).Network analysis Global network measures were extracted from the entire connectome, as well as within each sub-network: modularity (reflecting network segregation), global efficiency (corresponding to the average inverse shortest weighted-path length and inversely related to the characteristic path length), clustering coefficient (reflecting the degree to which the nodes tend to cluster together), and mean strength (corresponding to the average of all the nodal strengths, where the nodal strength is the sum of the weights of links connected to the node).
Statistical analysis First, linear mixed-effects modeling was performed to determine patterns of age-related development (age by network-type interactions). Then, individual general linear models were run to determine age-related development of specific network characteristics. Follow-up analyses of feature importance (26 ROIs) for age-prediction in the visual network was performed using ElasticNet regularization (training set size:70, validation set size:18) to identify specific cortical regions driving age-relationships in local efficiency.
Results and Discussion
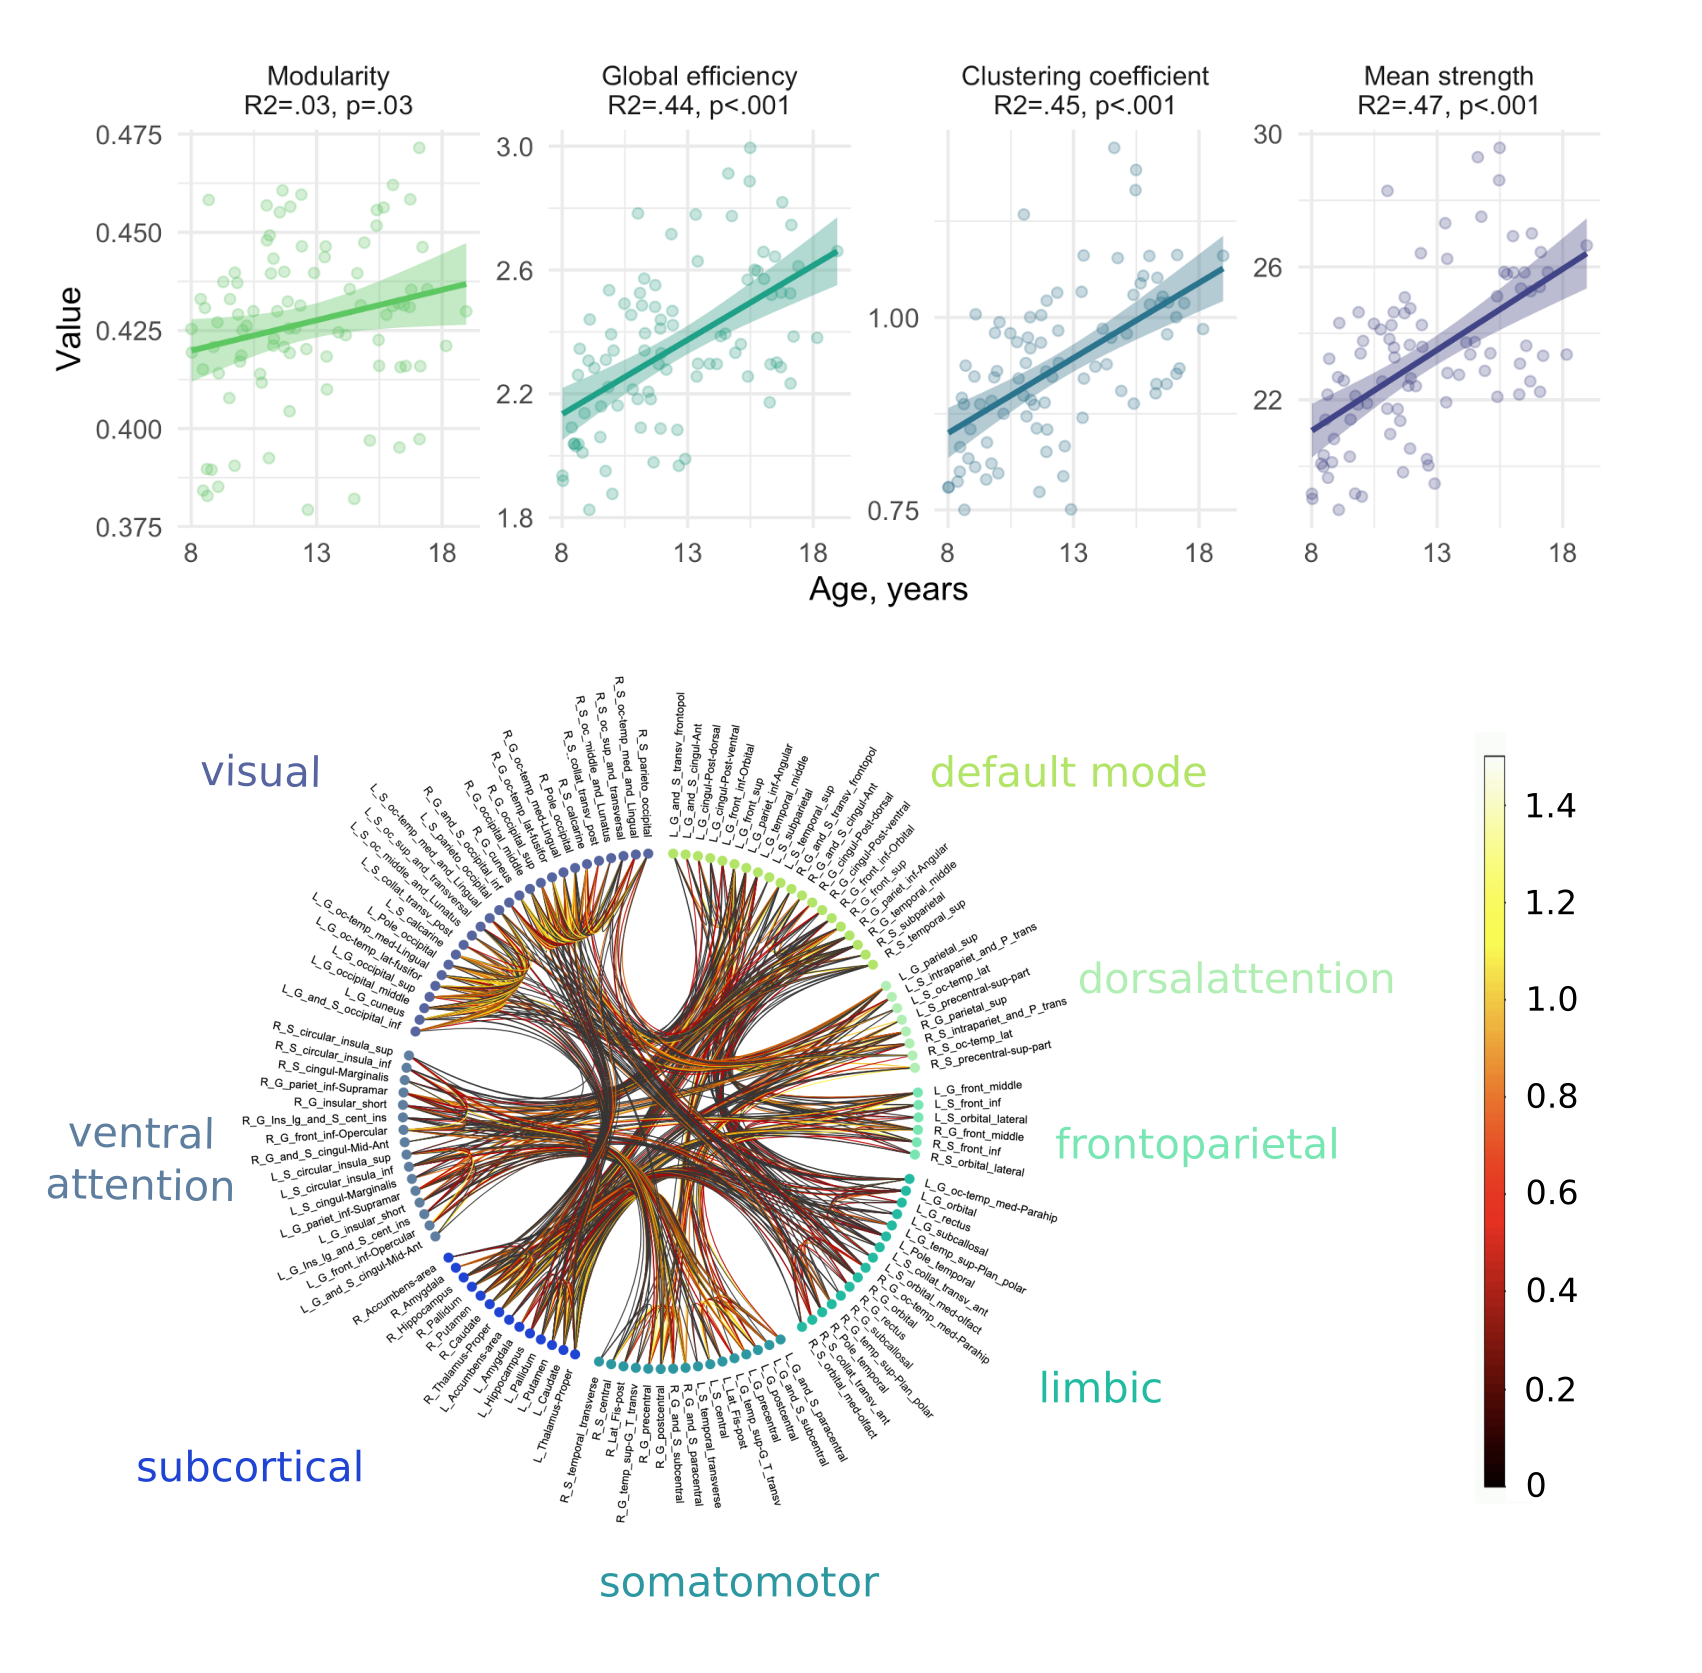
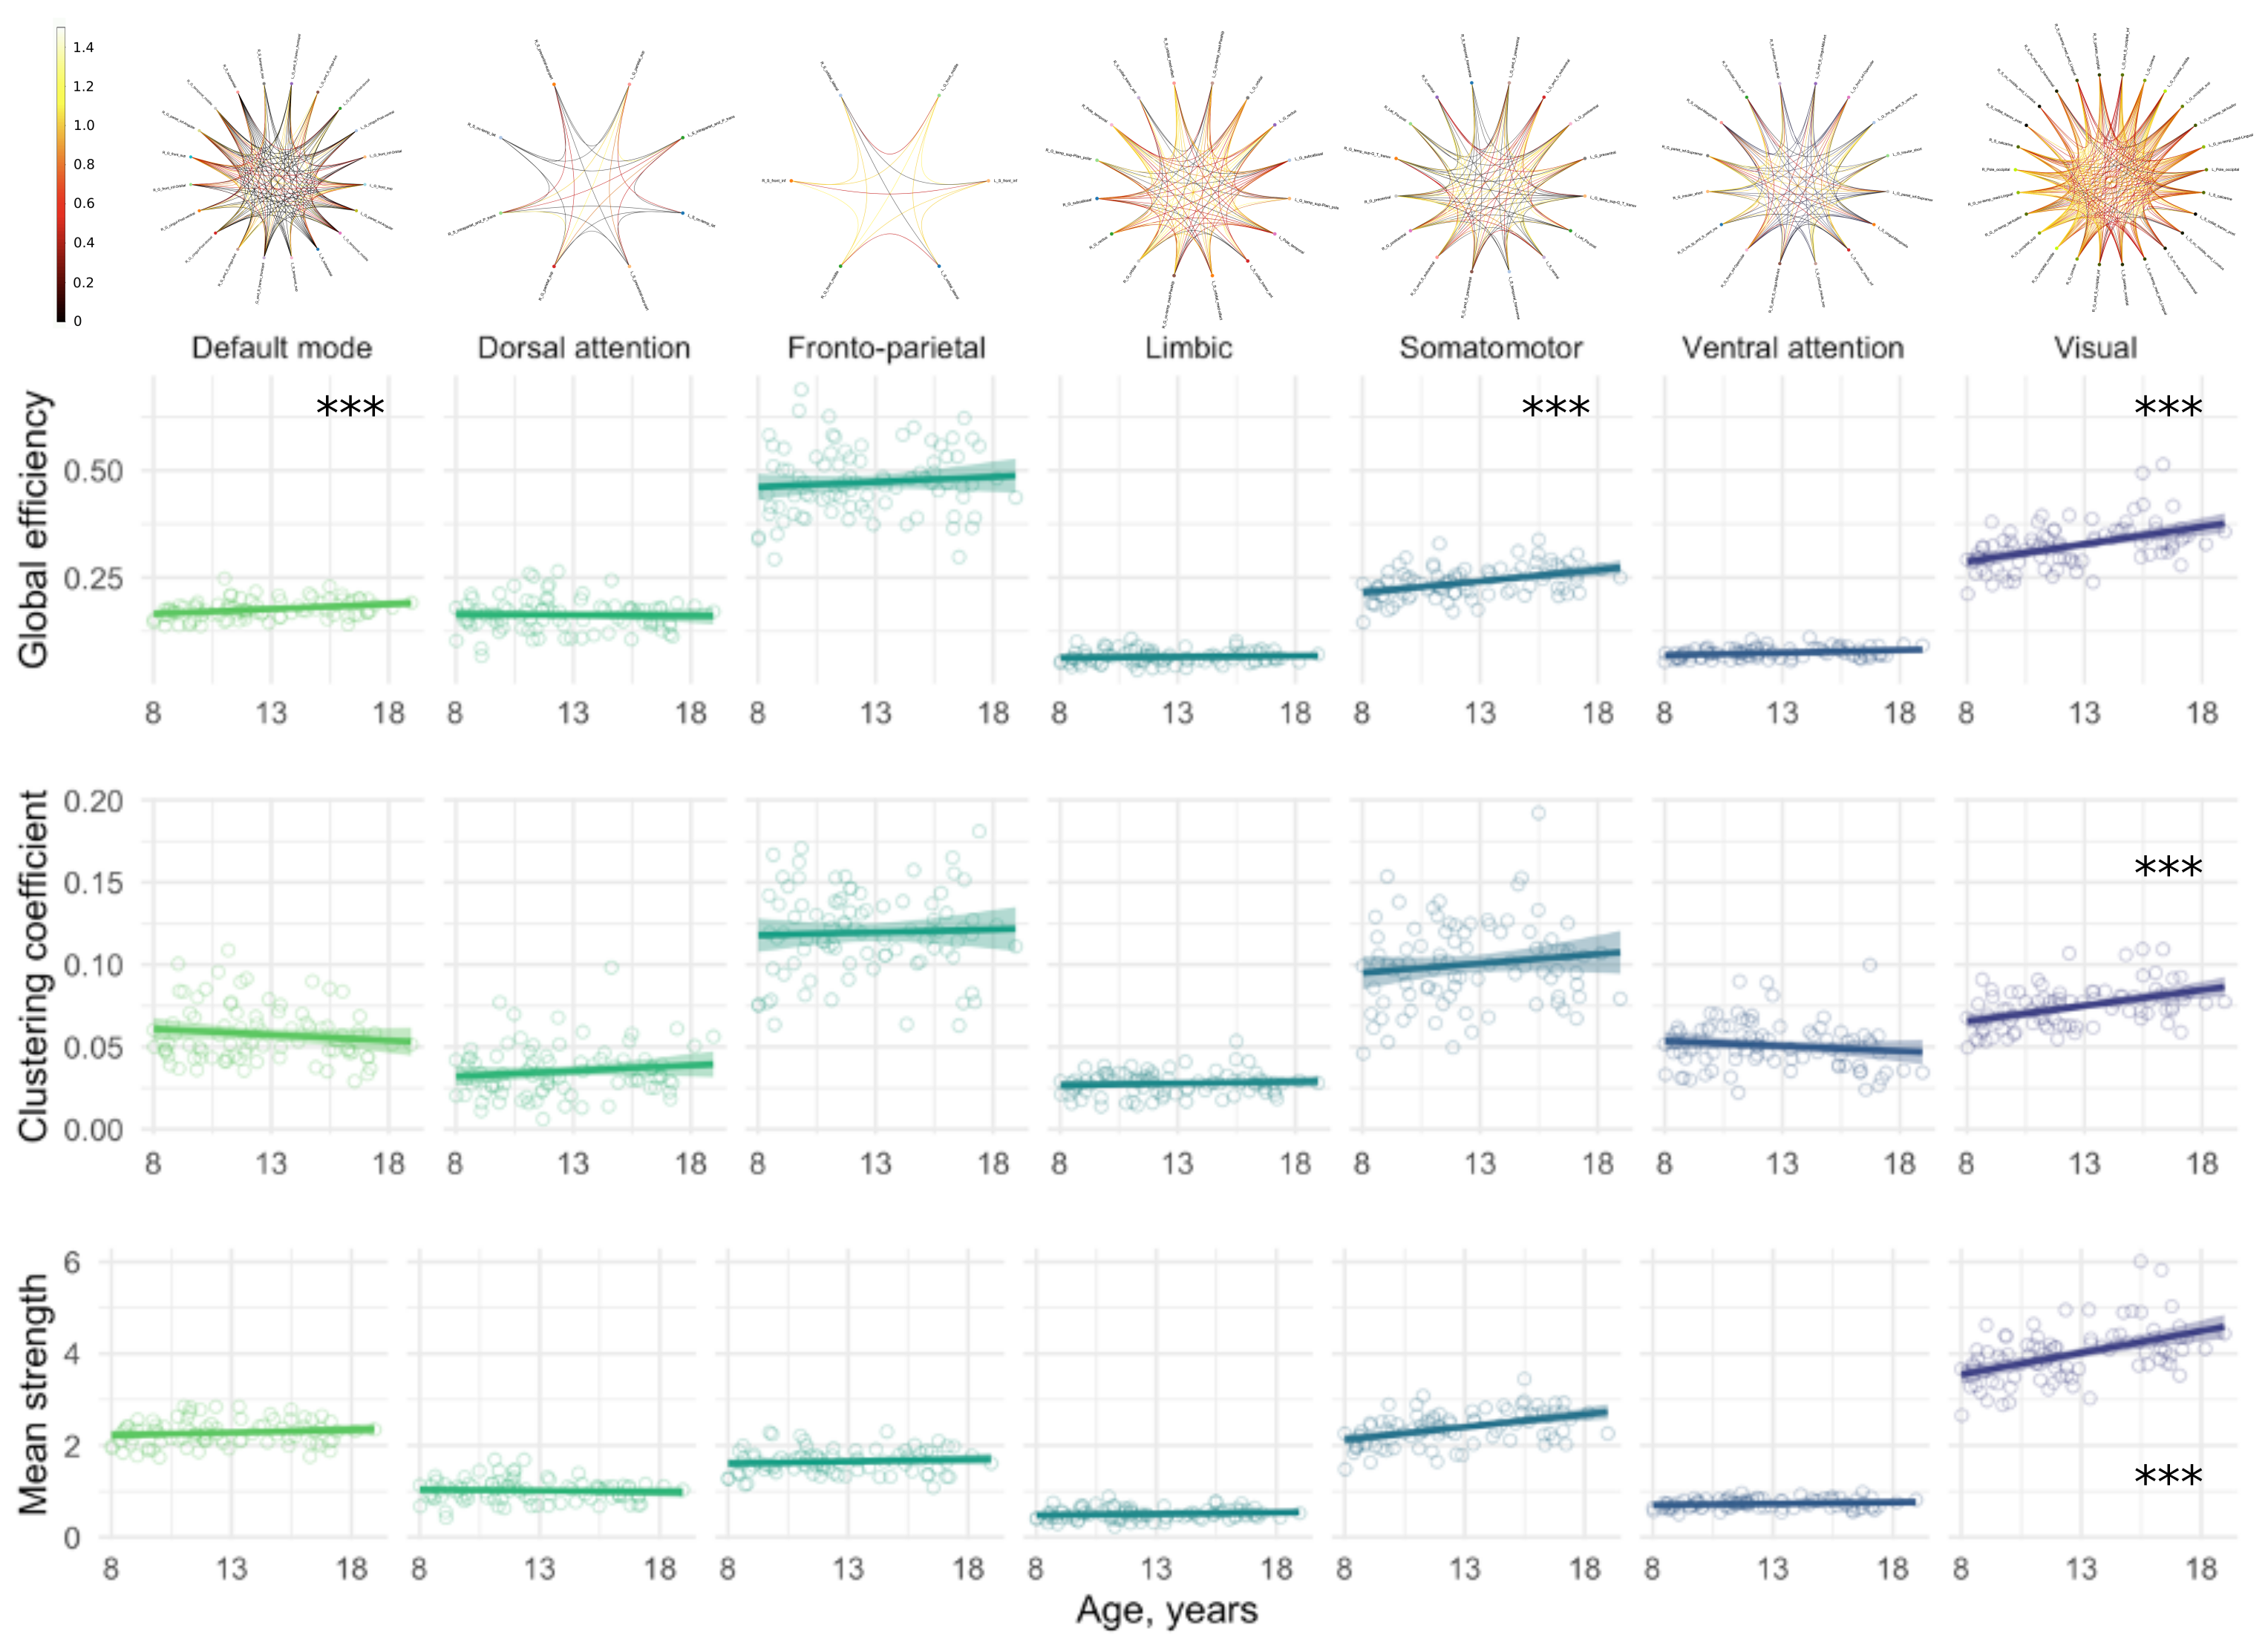
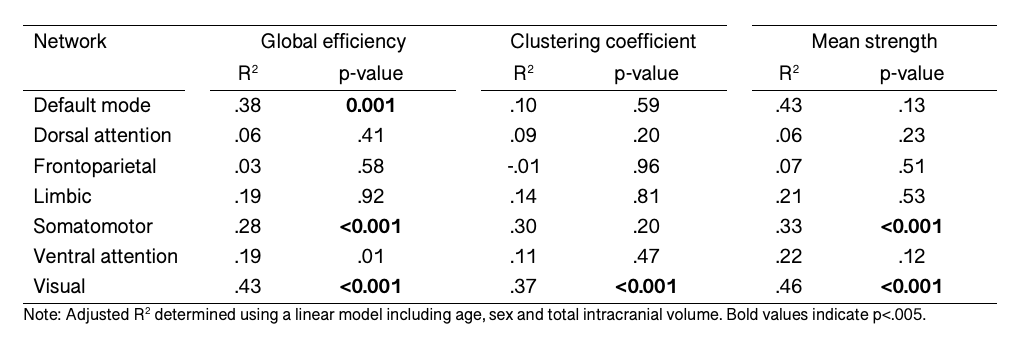
We observed a positive relationship between age and global efficiency ($$$R^2=.44,p<.001$$$), clustering coefficient ($$$R^2=.45,p<.001$$$) and mean strength ($$$R^2=.47,p<.001$$$) (Figure 2). This suggests that the shortest path between nodes decreases with age allowing more efficient transfer of information. As a result, the nodes tend to cluster together to form hubs and the strength of each connection increases with age, a finding which is supported by white matter studies which reveal substantial increases in IASF with age10.In terms of global sub-networks characteristics, we observed regional differences in age-related development of specific sub-networks (Figure 3 and Table 1). Age by network interactions were apparent for the visual network (global efficiency: $$$t=3.1,p=.002$$$; clustering coefficient: $$$t=3.3,p=.001$$$; mean strength: $$$t=6.6,p<.001$$$) and for the somatomotor network (mean strength: $$$t=3.4,p<.001$$$). Linear regression in individual networks revealed a statistically significant relationship between age and global efficiency for default mode ($$$R^2=.38,p<.001$$$), somatomotor ($$$R^2=.28,p<.001$$$) and visual networks ($$$R^2=.43,p<.001$$$) as well as for clustering coefficient ($$$R^2=.37,p<.001$$$) and mean strength ($$$R^2=.46,p<.001$$$) of the visual network. Previous work has identified increases in global efficiency over adolescent development15-17. Our specific findings in the visual cortex are in line with previously observed temporal patterns of white matter maturation18,19. It is likely that the observed age-related development of efficiency, clustering coefficient and mean strength in the visual network is tightly linked with age-related increases in IASF10. Future work will aim to link these microstructure-based network findings with measures of cortical microstructure to confirm known patterns of functional network development.
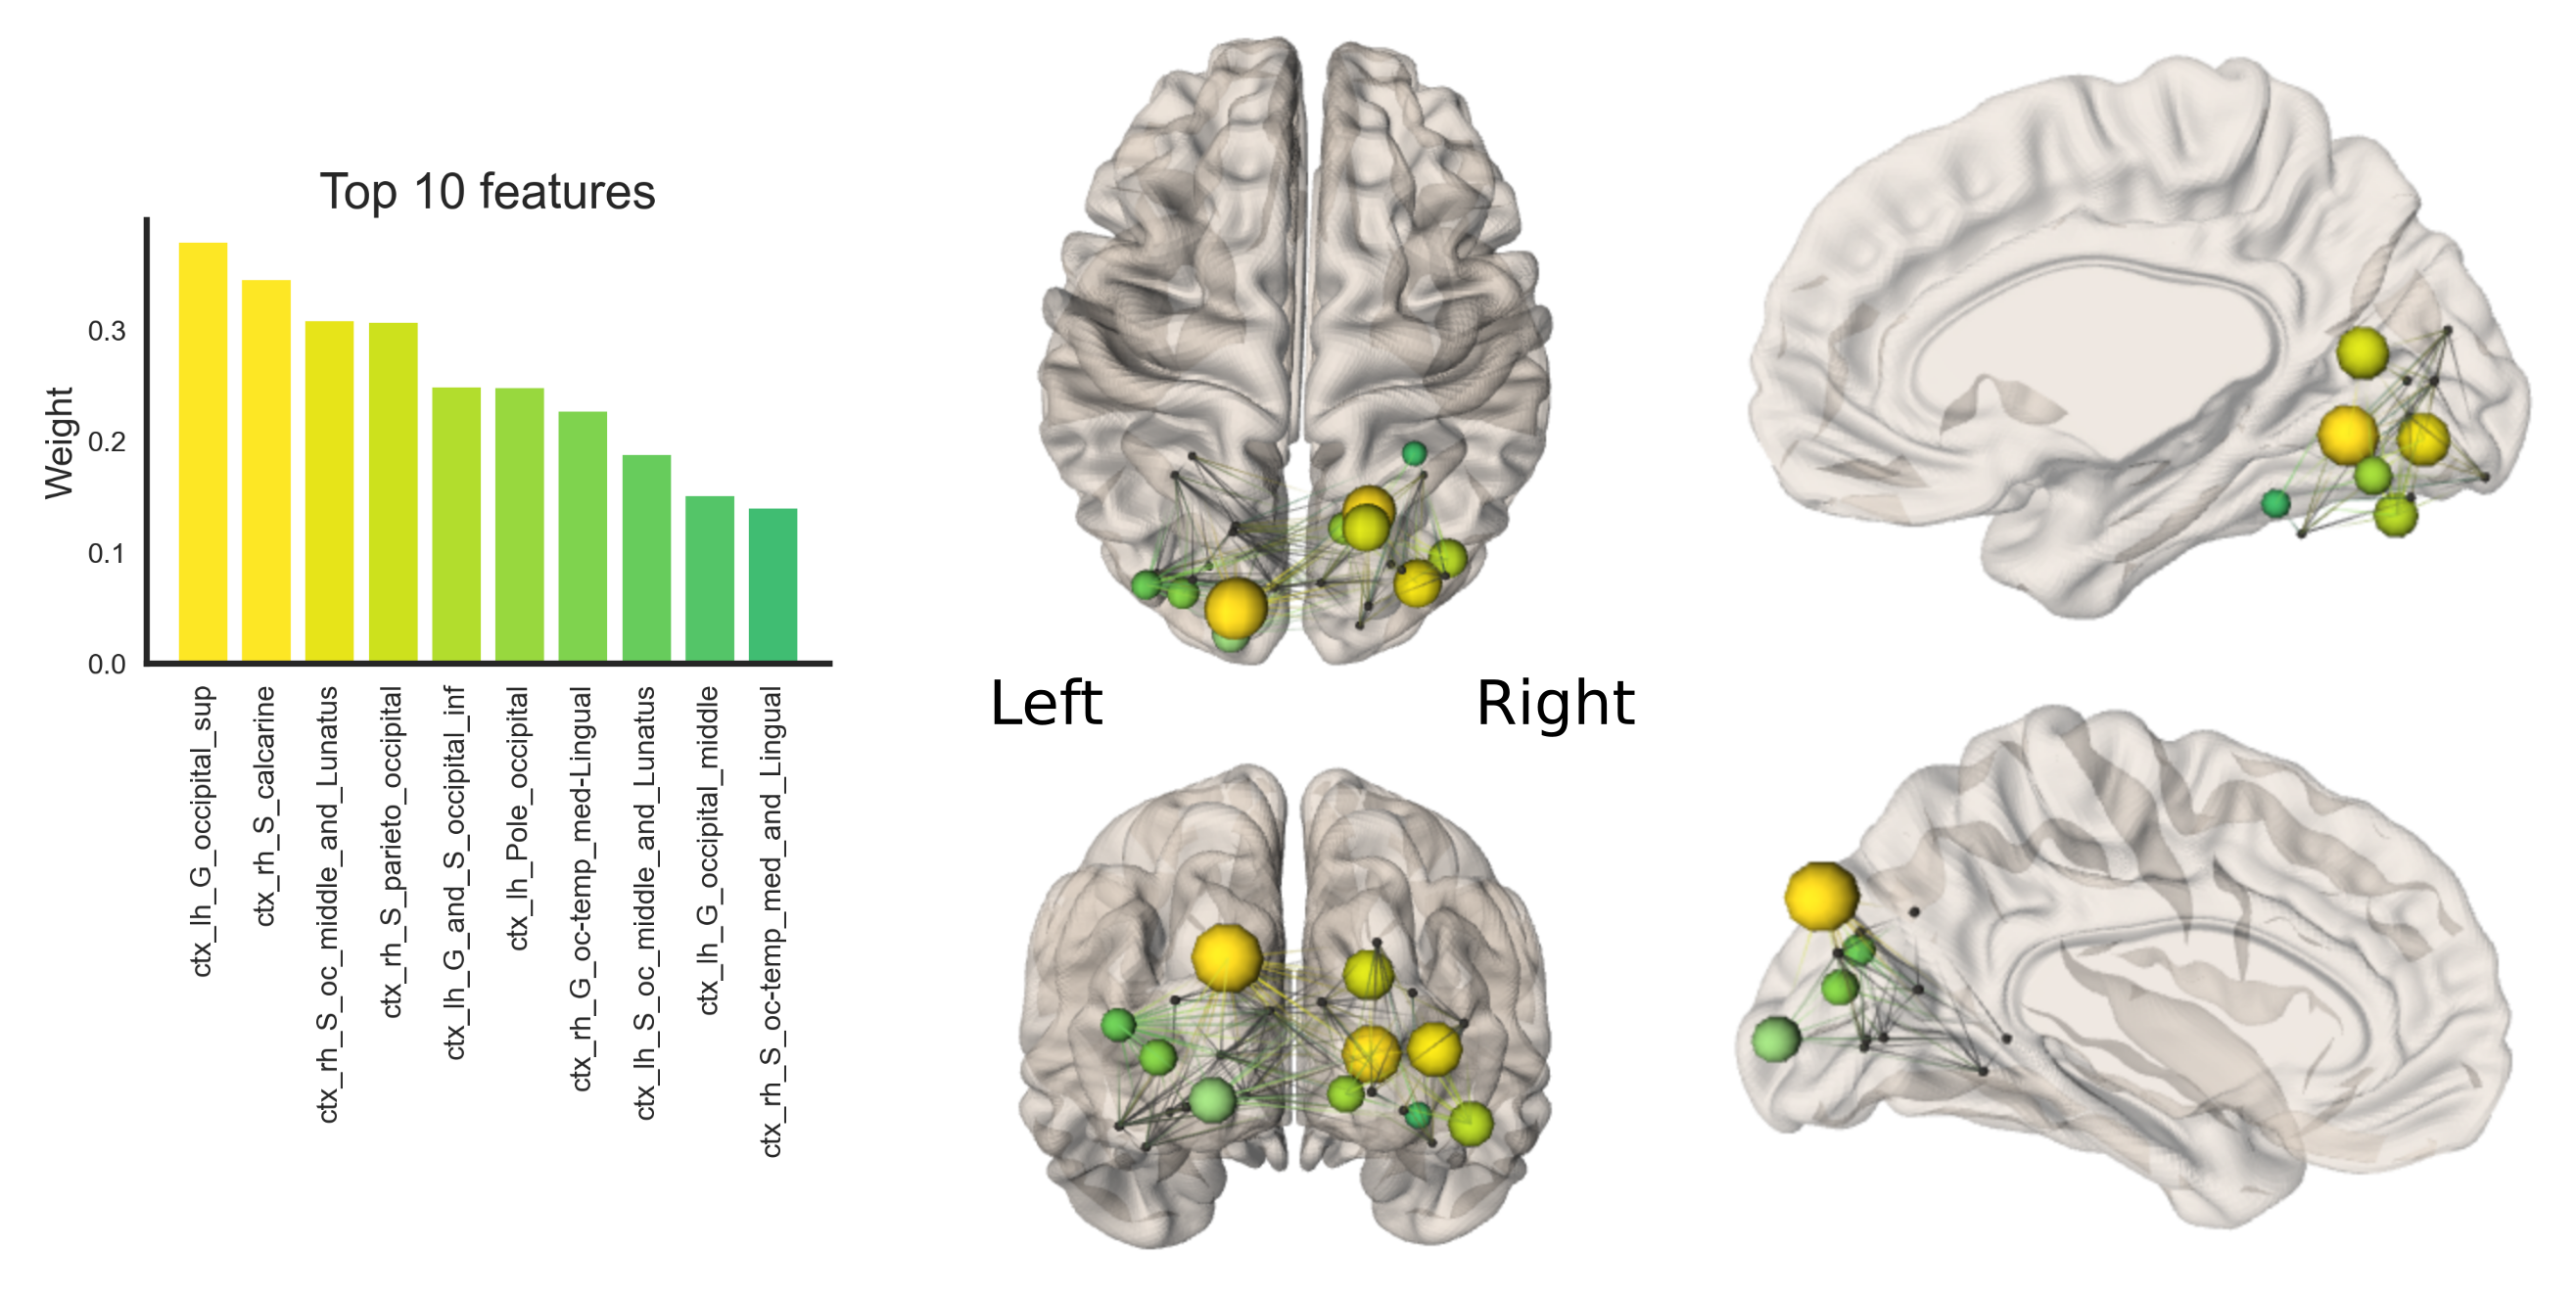
Finally, Figure 4 shows the results of feature importance to identify specific nodes driving age-related increases in local efficiency of the visual network. The 10 most sensitive nodes are balanced between hemispheres (5 nodes in right hemisphere, and 5 in the left) although the nodes involved appeared to be different in each hemisphere and only the occipital middle and Lunatus ROIs appears in the list for both hemispheres.
Conclusions
Employing COMMIT to construct microstructure-informed connectomes and derive more biologically-informative graph global measures, we found unique visual network characteristics over age-related development in structural brain networks and confirmed previously observed maturational pattern of posterior regions.Acknowledgements
The data were acquired at the UK National Facility for In Vivo MR Imaging of Human Tissue Microstructure funded by the EPSRC (grant EP/M029778/1), and The Wolfson Foundation.
SS received funding from the University of Verona Internationalisation Programme 2019 (Action 4C). CMWT was supported by a Sir Henry Wellcome Fellowship (215944/Z/19/Z) and a Veni grant (17331) from the Dutch Research Council (NWO). DKJ is supported by a Wellcome Trust Investigator Award (096646/Z/11/Z) and a Wellcome Trust Strategic Award (104943/Z/14/Z).
References
- R. Smith, D. Raffelt, J-D Tournier, A. Connelly. Quantitative Streamlines Tractography: Methods and Inter-subject Normalisation. OSF Preprints. July 20.
- D.K. Jones, T.R. Knösche, R. Turner. White matter integrity, fiber count, and other fallacies: The do's and don'ts of diffusion MRI. NeuroImage, 73: 239-254, 2018.
- C-H Yeh, D.K Jones, X. Liang, M. Descoteaux, A. Connelly. Mapping Structural Connectivity Using Diffusion MRI: Challenges and Opportunities. J Magn Reson Imaging, 2020.
- S. Bells, M. Cercignani, S. Deoni, Y. Assaf, O. Pasternak, C.J. Evans, A. Leemans, D.K. Jones. Tractometry Comprehensive Multi-modal Quantitative Assessment of White Matter Along Specific Tracts. Proc. Intl. Soc. Mag. Reson. Med. 19, 0678, 2011.
- M. Chamberland, E. P. Raven, S. Genc, K. Duffy, M. Descoteaux, G. D. Parker, C. M. W. Tax and D. K. Jones. Dimensionality reduction of diffusion MRI measures for improved tractometry of the human brain. Neuroimage 200: 89-100, 2019.
- S. Schiavi, P.-J. Lu, M. Weigel, D.K. Jones, L. Kappos, C. Granziera, A. Daducci. Myelin weighted tractography: a new way to investigate bundles myelination in-vivo? Proc. Intl. Soc. Mag. Reson. Med. 28, 2020.
- A. Daducci, A. Dal Palú, A. Lemkaddem and J.P. Thiran. A convex optimization framework for global tractography. In Proc. IEEE ISBI, 524–7, 2013.
- A. Daducci, A. Dal Palù, A. Lemkaddem, J.P. Thiran. COMMIT: Convex Optimization Modeling for Microstructure Informed Tractography. IEEE Trans. Med. Imaging., 33:246-57, 2014.
- S. Schiavi, M. Petracca, M. Battocchio, M.M. El Mendili, S.Paduri, L. Fleysher, M. Inglese, A. Daducci. Sensory-motor network topology in multiple sclerosis: Structural connectivity analysis accounting for intrinsic density discrepancy. Hum Brain Mapp, 1–13, 2020.
- S. Genc, C.M.W. Tax, E.P. Raven, M. Chamberland, G.D. Parker, D.K. Jones. Impact of b‐value on estimates of apparent fibre density. Hum Brain Mapp, 41:2583–2595, 2020.
- J.-D. Tournier, R.E. Smith, D. Raffelt, R. Tabbara, T. Dhollander, M. Pietsch, D. Christiaens, B. Jeurissen, C.-H. Yeh, A. Connelly. MRtrix3: A fast, flexible and open software framework for medical image processing and visualisation. NeuroImage, 202:116–37, 2019.
- E. Panagiotaki, T. Schneider, B. Siow, M.G. Hall, M.F. Lythgoe, D.C. AlexanderCompartment models of the diffusion MR signal in brain white matter: a taxonomy and comparison. NeuroImage, 59(3):2241-2254, 2012.
- C. Destrieux, B. Fischl, A. Dale, E. Halgren. Automatic parcellation of human cortical gyri and sulci using standard anatomical nomenclature. NeuroImage, 53(1):1-15, 2010.
- BT Yeo, FM Krienen, J Sepulcre, MR Sabuncu, D Lashkari, M Hollinshead, JL Roffman, JW Smoller, L Zollei, JR Polimeni, B Fischl, H Liu, RL Buckner. The organization of the human cerebral cortex estimated by intrinsic functional connectivity. J Neurophysiol 106(3):1125-65, 2011.
- S.T.E. Baker, D.I. Lubman, M. Yücel, N.B. Allen, S.Whittle, B.D. Fulcher, A. Zalesky, A. Fornito. Developmental Changes in Brain Network Hub Connectivity in Late Adolescence. Journal of Neuroscience 35(24):9078-9087, 2015.
- M. Koenis, R. Brouwer, S. Swagerman, I. Van Soelen, D.I. Boomsma, H. Hulshoff Pol. Association betweenstructural brain network efficiency and intelligence increasesduring adolescence. Hum Brain Mapp. 39:822–836, 2018.
- M.P. Van Den Heuvel, O. Sporns. Network hubs in the human brain. Trends in Cognitive Sciences, 17(12):683-696, 2013.
- S. Genc, M. L. Seal, T. Dhollander, C. B. Malpas, P. Hazell, T. J. Silk. White matter alterations at pubertal onset. NeuroImage 156:286-292, 2017.
- J.B. Colby, J.D. Van Horn, E. R. Sowell. Quantitative in vivo evidence for broad regional gradients in the timing of white matter maturation during adolescence. NeuroImage 54(1):25-31, 2011.
Figures