0207
Human brain in vivo correlation tensor MRI on a clinical 3T system
Lisa Novello1, Rafael Neto Henriques2, Andrada Ianuş2, Thorsten Feiweier3, Noam Shemesh2, and Jorge Jovicich1
1Center for Mind/Brain Sciences - CIMeC, University of Trento, Rovereto, Italy, 2Champalimaud Research, Champalimaud Centre for the Unknown, Lisbon, Portugal, 3Siemens Healthcare GmbH, Erlangen, Germany
1Center for Mind/Brain Sciences - CIMeC, University of Trento, Rovereto, Italy, 2Champalimaud Research, Champalimaud Centre for the Unknown, Lisbon, Portugal, 3Siemens Healthcare GmbH, Erlangen, Germany
Synopsis
Resolving the underlying sources of kurtosis in biological systems is emerging as a promising strategy for non-invasive quantitative characterization of tissue microstructure. Recently, a novel framework termed Correlation Tensor Imaging (CTI), based on double-diffusion-encoding MRI, was shown to disentangle anisotropic, isotropic, and microscopic kurtosis sources in mouse brains. Here, we implemented CTI on a clinical 3T MRI system and scanned normal humans for the first time. The ensuing CTI-driven non-Gaussian inter/intra-compartmental estimates are promising and agree with expectations: positive intra-compartmental kurtosis for gray and white matter, larger for gray than white matter, and around zero for cerebrospinal fluid.
Introduction
Double-Diffusion-Encoding (DDE) is an advanced MRI acquisition strategy that offers promising possibilities for quantifying tissue microstructure that are more specific relative to those estimated from standard single-diffusion-encoding methods1,2. In particular, the Correlation Tensor Imaging (CTI) framework has been recently introduced3, which harnesses DDE to resolve the sources of kurtosis, which are all conflated in conventional diffusion kurtosis MRI (DKI) and completely ignored in the classical diffusion tensor model. In particular, CTI enables the estimation of microscopic kurtosis arising from restriction or disorder (intra-compartmental kurtosis, KINTRA). The initial work was performed on preclinical systems on mouse brains; to our knowledge, the CTI framework has never been performed in humans. In this study, we implemented and estimated, for the first time, in vivo human CTI using a clinical 3T MRI system.Methods
Acquisition: Two healthy adults (1 female 22 years, 1 male 29 years) were studied using a 3T clinical scanner (MAGNETOM Prisma, Siemens Healthcare, Erlangen, Germany) with a 64-channel head-neck RF receive coil. A prototype twice-refocused DDE sequence was used: TR/TE 5500/127 ms, 2.5 mm isotropic voxels, full-brain axial coverage, GRAPPA/SMS 2/4, δ/Δ/TM 16/32/15 ms. Four DDE shells (b1/s/mm2; b2/s/mm2; n-gradients) were acquired (anterior-to-posterior phase-encoding, A>>P): shell #1) [2000; 0; 604], shell #2) [1000; 1000; 60 parallel4], shell #3) [1000; 1000; 60 perpendicular5], shell #4) [1000; 0; 604]. The protocol was repeated twice with opposite gradient polarities6 to mitigate cross terms. Shells with two b=0 s/mm2 volumes, with A>>P and P>>A were added for geometric distortion correction. A T1-weighted multi-echo MPRAGE image was acquired for anatomical reference. The acquisition time of the entire diffusion protocol was 58 min.Analyses: Data pre-processing included PCA denoising (MRtrix v.3.0.2) with visual inspection of residuals, TOPUP distortion correction (FSL, always v.6.0.4), eddy current and head motion correction concatenating data from the two opposite polarities for each shell. For each direction index n, pairs of volumes acquired with opposite diffusion directions were geometrically averaged to reduce imaging cross-terms effects6. KINTRA can be estimated from data of shells #1 and #2 ( $$$ E_n(b,0) $$$ and $$$ E_n(\frac{b}{2}, \frac{b}{2}) $$$ signals) as:
$$ K_{INTRA} = \frac{12}{MD^2 b^2}(log(E_n(b,0)_{PA}) - log(E_n(\frac{b}{2},\frac{b}{2})_{PA})) $$
with PA referring to the powder-average of the signals (i.e. averaging the signals of the different pairs of directions). To assess the presence of tissue intra-compartmental kurtosis source independent of the estimation of mean diffusivity (MD), in this study we explore the difference between $$$ log(E_n(b,0)_{PA}) $$$ and $$$ log(E_n(\frac{b}{2},\frac{b}{2})_{PA}). $$$ Note that difference is expected to be positive or negative if KINTRA is positive or negative, respectively. Cortical and subcortical gray matter (cGM, scGM), white matter (WM), and lateral ventricles cerebrospinal fluid (CSF) masks were derived from anatomical data (FreeSurfer v.7.1) to evaluate KINTRA distributions within each tissue.
Results
Figure 1 shows the maps of signal-to-noise ratio on b=0 s/mm2 volumes (SNRb=0) from the raw and pre-processed data. Global SNRb=0 increased by approximately 40% after pre-processing. Figure 2 shows the angular contrast-to-noise ratio for shells #1 and #2 in each subject (standard deviation of predicted signal relative to standard deviation of residuals, across all sampled directions in each shell7). Figure 3 shows the powder average, in one subject, across diffusion directions for each shell used to estimate KINTRA. Figure 4 shows representative tissue masks on which estimations of KINTRA were computed (Figure 5). Mean(standard-deviation) KINTRA values for each tissue were the following: cGM sub01: KINTRA = 0.055(0.046), sub02: KINTRA = 0.061(0.057); scGM sub01: KINTRA = 0.046(0.036), sub02: KINTRA = 0.042(0.072); WM sub01: KINTRA = 0.037(0.03), sub02: KINTRA = 0.043(0.037); CSF sub01: KINTRA = 0.011(0.053), sub02: KINTRA = 0.023(0.09).Discussion
In agreement with animal experiments3, we observed that human brain KINTRA distributions peaked towards positive values in WM and GM tissue. These positive trends in KINTRA are in line with the non-Gaussian diffusion effects arising from tissue disorder (e.g. compartments with variable cross-section dimensions or in the presence of sub-structures in both intra- and extra-cellular spaces)3,8,9. KINTRA was slightly lower in WM than in GM, and similar in cortical and subcortical GM, and it peaked at zero for CSF. The evaluation of human in vivo KINTRA might be valuable for assessing the limits of models assuming multiple Gaussian compartments10,11.Conclusions
We show for the first time human brain in vivo estimations of tissues’ intra-compartment kurtosis using a clinical 3T MRI system. Preliminary results are promising and show quantitative indices with expected tissue properties, obtained without assumptions of microstructural properties or constraints11. The protocol duration is not yet conformant with clinical demands. Further work is ongoing to expand the sample size, explore human tissue properties, as well as strategies to reduce total acquisition time and related biases.Acknowledgements
No acknowledgement found.References
- Henriques RN, Palombo M, Jespersen SN, et al. Double diffusion encoding and applications for biomedical imaging. J Neurosci Methods. 2020; 108989.
- Yang G, Tian Q, Leuze C, et al. Double diffusion encoding MRI for the clinic. Magn Reson Med. 2018; 80:507-520.
- Henriques RN, Jespersen SN, Shemesh N. Correlation tensor magnetic resonance imaging. Neuroimage. 2020; 211:116605.
- Hardin RH and Sloane NJA., Discrete and Computational Geometry, 1996; 15:429-441
- Jespersen SN, Lundell H, Sønderby CK, Dyrby TB. Orientationally invariant metrics of apparent compartment eccentricity from double pulsed field gradient diffusion experiments. NMR Biomed. 2013; 26:1647-62.
- Neeman, M., Freyer, J. P., & Sillerud, L. O. A simple method for obtaining cross‐term‐free images for diffusion anisotropy studies in NMR microimaging. Magn Reson Med. 1991; 21(1):138-143.
- Bastiani M, Cottaar M, Fitzgibbon SP, et al. Automated quality control for within and between studies diffusion MRI data using a non-parametric framework for movement and distortion correction. Neuroimage. 2019; 184:801-812.
- Dhital, B., Kellner, E., Kiselev, V. G., & Reisert, M. The absence of a restricted water pool in brain white matter. Neuroimage. 2018; 182:398-406.
- Lee, H. H., Papaioannou, A., Kim, S. L., Novikov, D. S., & Fieremans, E. A time-dependent diffusion MRI signature of axon caliber variations and beading. Communications biology. 2020; 3(1):1-13.
- Jespersen, S. N., Olesen, J. L., Ianuş, A., & Shemesh, N. Effects of non-Gaussian diffusion on “isotropic diffusion” measurements: An ex-vivo microimaging and simulation study. Journal of Magnetic Resonance. 2019; 300:84-94.
- Topgaard, D. Multidimensional diffusion MRI. Journal of Magnetic Resonance. 2017; 275:98-113.
Figures
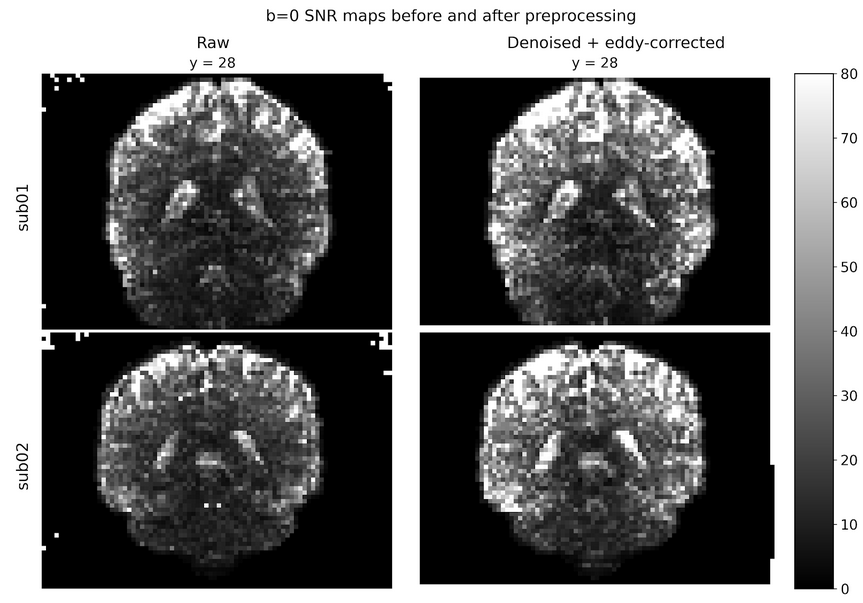
Figure 1: Signal-to-noise ratio maps on b=0 s/mm2 volumes of raw and pre-processed data. For subject 1, mean raw SNRb=0 = 25.8 mean preprocessed SNRb=0 = 35.3. For subject 2, mean raw SNRb=0 = 24.6, mean preprocessed SNRb=0 = 34.9.
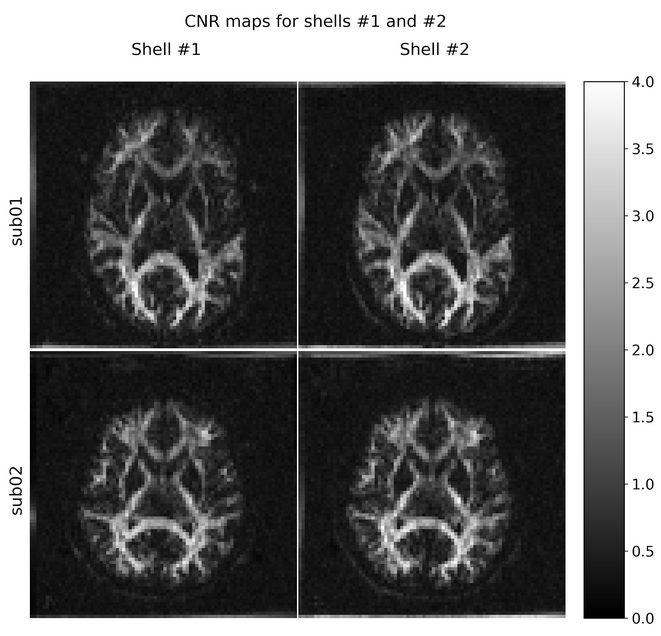
Figure 2: Contrast-to-noise ratio images of the two shells (shells #1 and #2) used to compute intra-compartmental kurtosis, for both subjects.
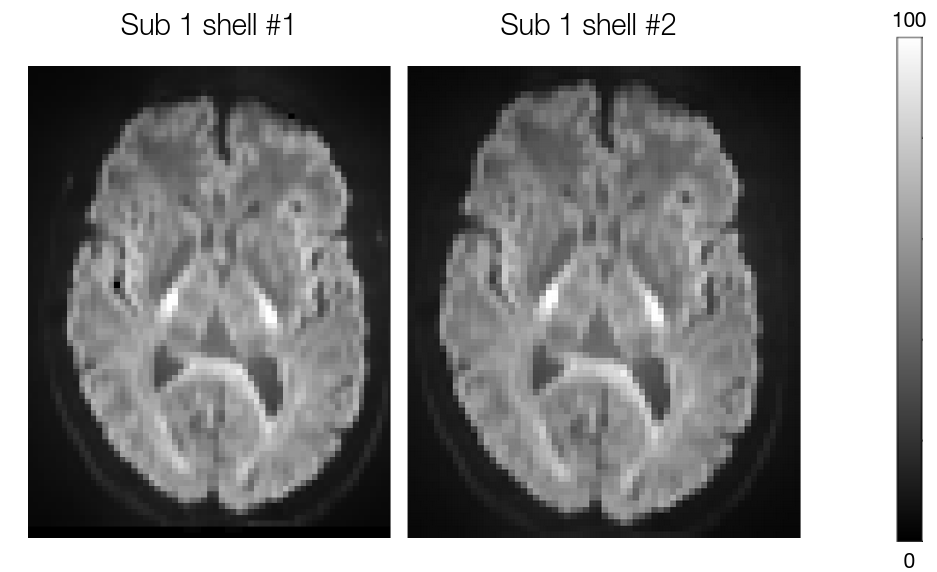
Figure 3: Powder average images in the two shells used to estimate intra-compartmental kurtosis (subject 1).
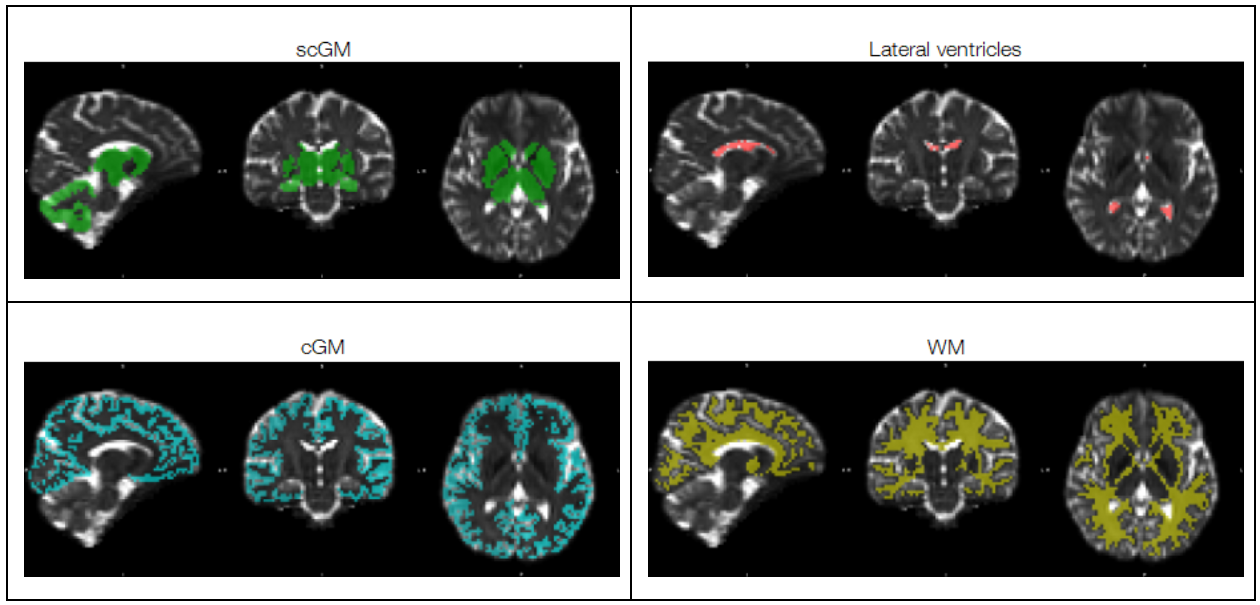
Figure 4: Representative tissue masks (subject 2) used to investigate intra-compartmental kurtosis distributions (Figure 5): subcortical gray matter (scGM), cortical GM (cGM), white matter (WM), and lateral ventricles cerebrospinal fluid (CSF).
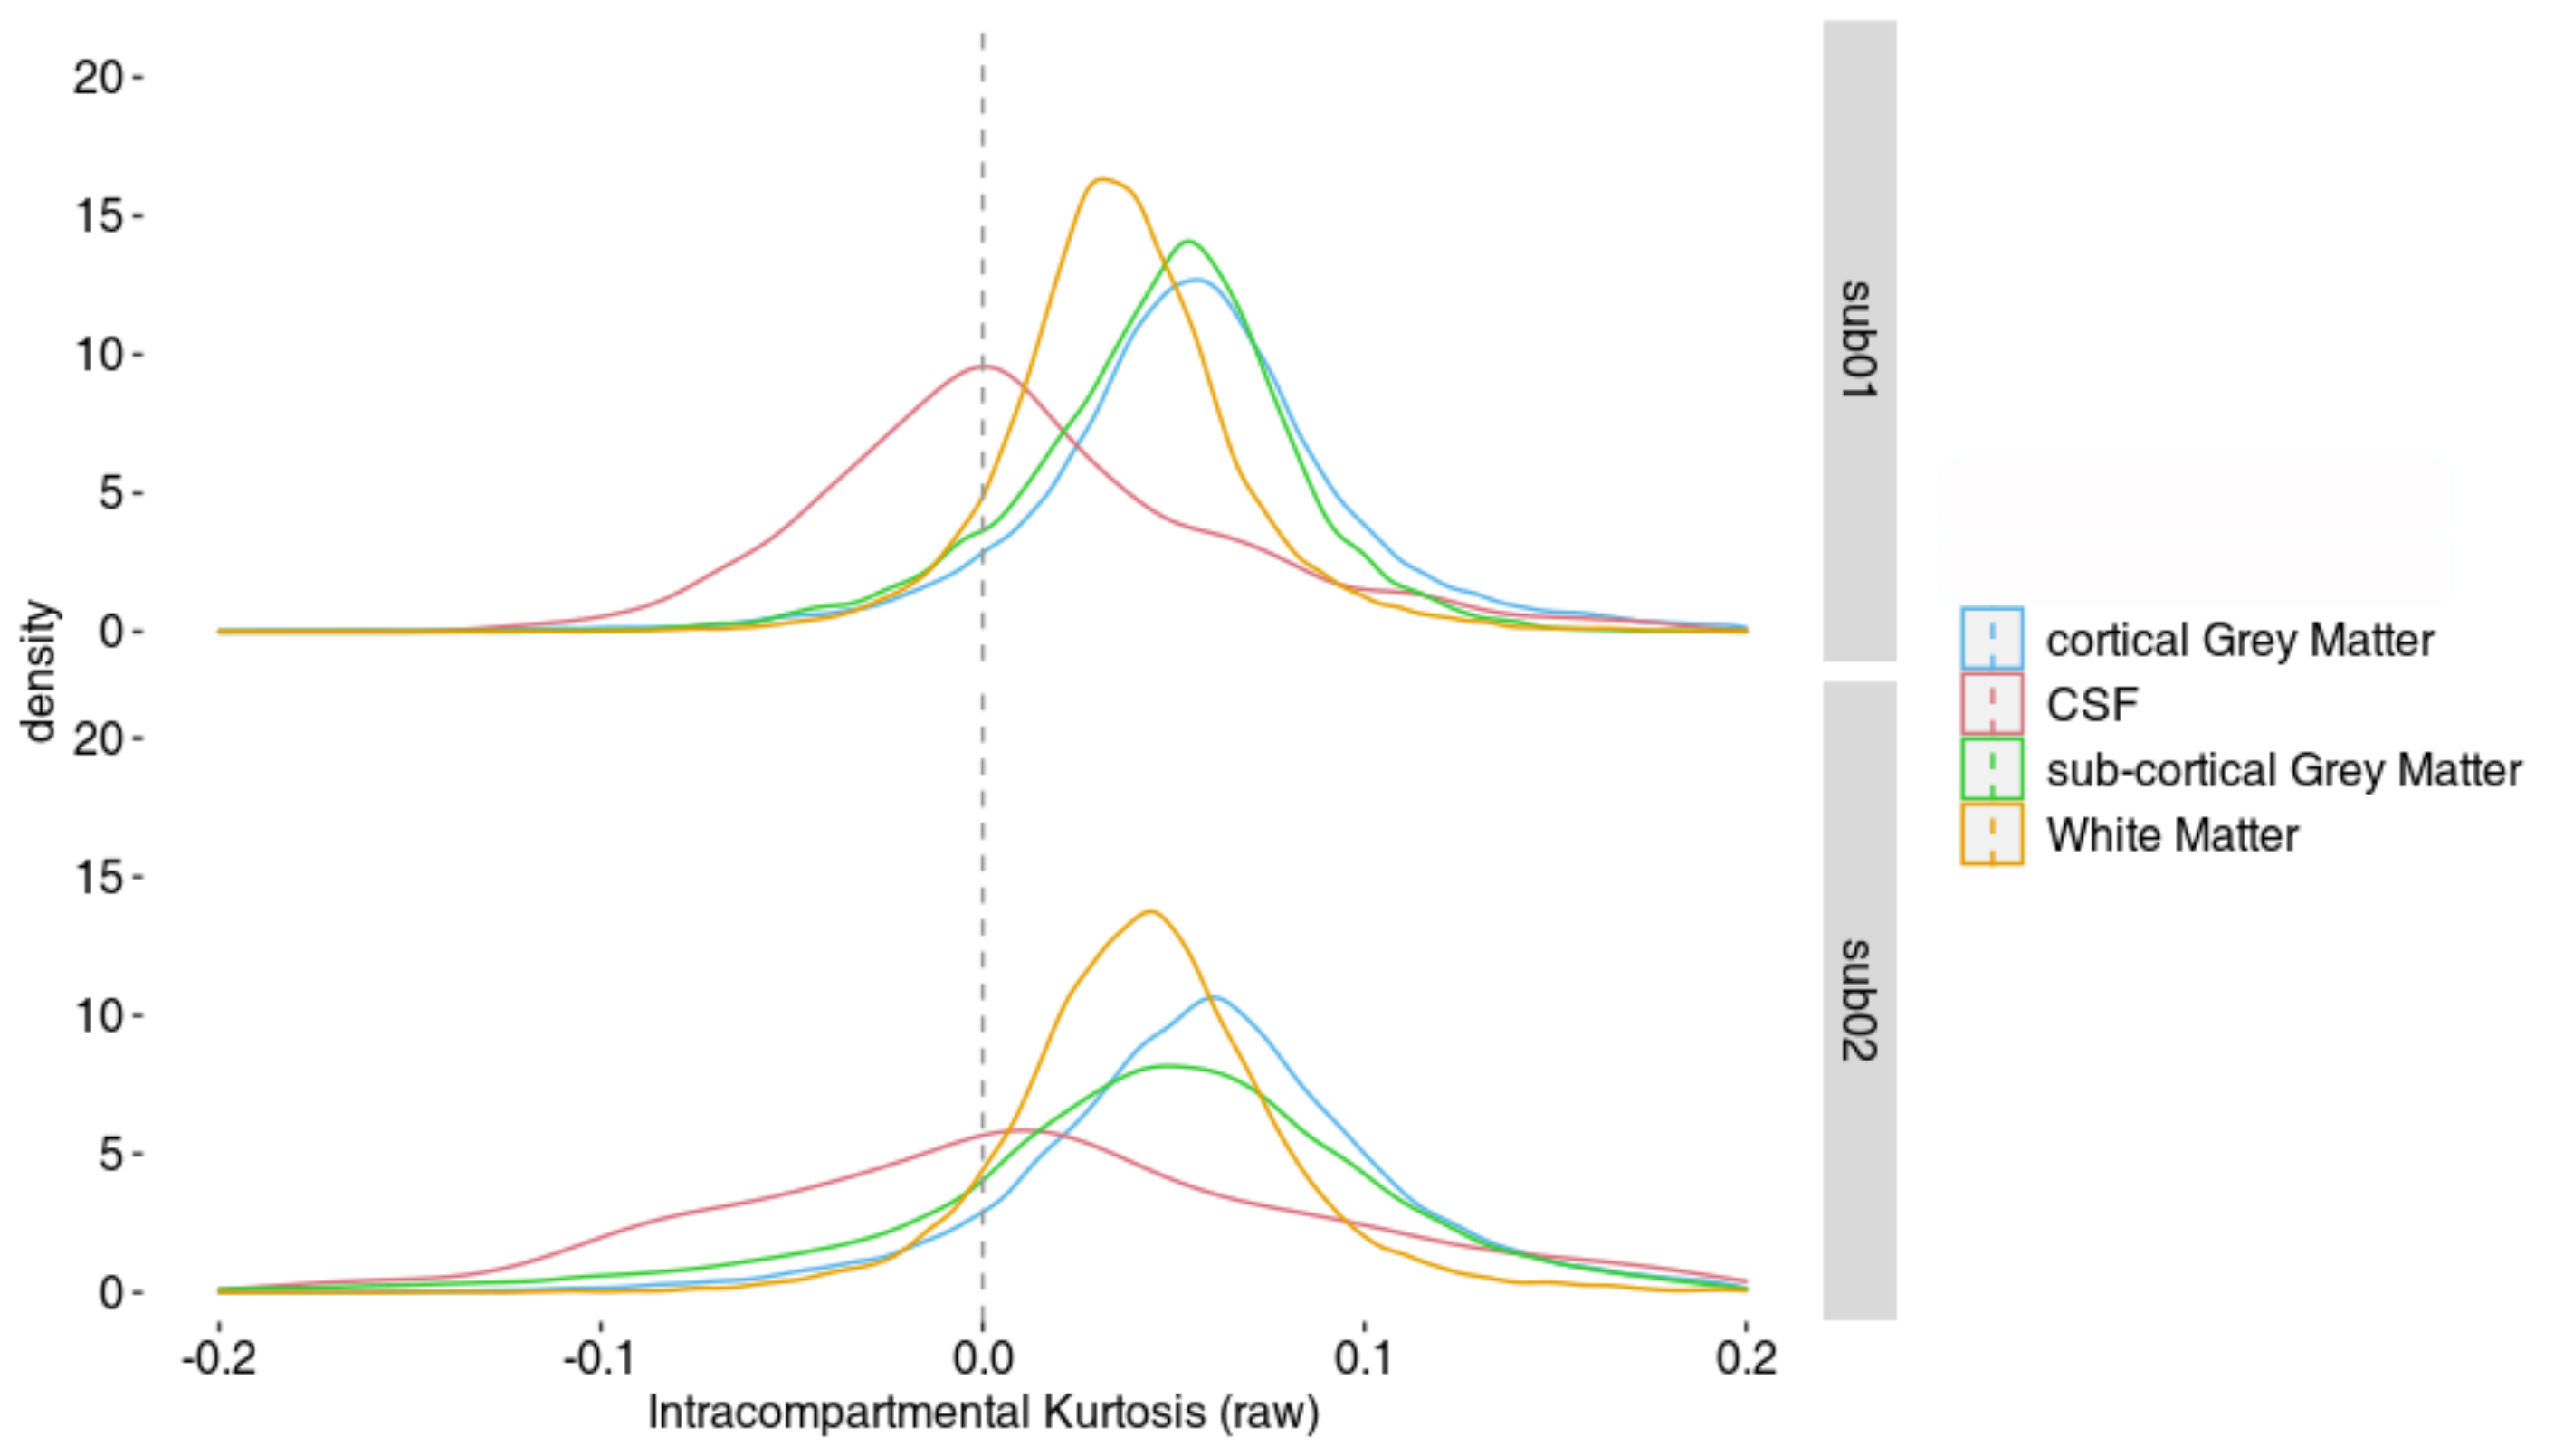
Figure 5: Human in vivo distributions of intra-compartmental kurtosis (KINTRA) in the tissues described in Fig. 4.