0206
Evaluation of White Matter Microstructure in an HIV Population at Risk of Cerebral Small Vessel Disease using Microscopic Fractional Anisotropy1Department of Neurology, University of Rochester, Rochester, NY, United States, 2Electrical & Computer Engineering, University of Rochester, Rochester, NY, United States, 3Imaging Sciences, University of Rochester, Rochester, NY, United States
Synopsis
White matter microstructural abnormalities are well documented in HIV-infected individuals. DTI derived fractional anisotropy (FA) is frequently used to assess the abnormalities but it has some limitations. In this work, we compared FA and microscopic fractional anisotropy (μFA) in an HIV cohort, and our results indicate that μFA seems to provide better sensitivity than the conventional FA for detecting white matter microstructure changes associated with HIV infection, especially in the areas with crossing fibers.
Introduction:
HIV-infected individuals (HIV+) even when treated with combination antiretroviral therapy (cART) have persistent chronic inflammation thus are increased risk of developing brain injury and cerebral small vessel disease (CSVD) 1, 2. Demyelination, edema and gliosis are the most common outcomes of neuroinflammation and also CSVD, and are visible as white matter hyperintensities in standard MR images (i.e., in FLAIR) 1. Typically, reduced fractional anisotropy (FA) is observed in CSVD, which can be mapped with diffusion tensor imaging (DTI) 3, 4. However, FA cannot be directly linked with the axonal density due to its sensitivity to other factors such as the orientation dispersion 5. To resolve this issue microscopic FA (μFA), a metric of the tensor-valued diffusion encoding technique, can be used to disentangle microscopic anisotropy and orientation dispersion in sub-voxel level 6-8. In this work, we compared μFA and conventional FA to assess white matter microstructural abnormalities in HIV+ compared to HIV uninfected (HIV-) individuals.Methods:
Sixteen participants (HIV+: N=8, age=53±13 years, male/female=7/1; HIV-: N=8, age=57±9 years, male/female=4/4) were evaluated for the presence of CSVD in an ongoing study. After obtaining written informed consent, all the participants were scanned at a 3T MRI (Siemens Prisma Fit, Germany) equipped with 64-channel head coil. The MRI protocol includes: 1) a T1w image using MPRAGE sequence [inversion time TI=926 ms, TR=1840 ms, TE=2.45 ms, voxel size = 1.0×1.0×1.0 mm3]; 2) 3D T2-weighted fluid attenuated inversion recovery (FLAIR) imaging (TI=1800 ms, TR = 5000 ms, TE=215 ms, voxel size = 1.0×1.0×1.0 mm3); 3) multi-shell diffusion weighted imaging (DWI) was performed using 2D single-shot spin echo echo-planar imaging (SE-EPI) sequence (TR= 4300 ms, TE= 69.0 ms; voxel size = 1.5×1.5×1.5 mm3, 64 gradients per shell with b=1,000 and 2,000 s/mm2 with 7 b=0 s/mm2 reference image); 4) Tensor-valued diffusion MRI was acquired using free wave form (FWF) encoding sequence (https://github.com/filip-szczepankiewicz/fwf_seq_resources): two tensor shapes of diffusion encodings such as linear and spherical tensor encodings (LTE and STE) for four b-values (100, 700, 1400, 2000 s/mm2), 80 non-colinear directions (43 LTE and 37 STE), TR=4100 ms, TE=91.0 ms; phase patrial Fourier=6/8, band width=1786 Hz/Px, voxel size = 2.0×2.0×4.0 mm3.DWI data were corrected for eddy current-induced distortion, motion and susceptibility-induced distortion using the “topup” and “eddy” tools in FSL 9. DTI metrics including FA were calculated using FSL “dtifit” 10. The tensor-valued data were corrected for eddy-currents and motion in ElastiX 11 using extrapolated reference images 12. A mild smoothing of 1.25 mm FWHM using a Gaussian kernel was applied to the corrected images. The μFA maps were computed using the Multidimensional diffusion MRI toolbox, available at https://github.com/markus-nilsson/md-dmri 13.
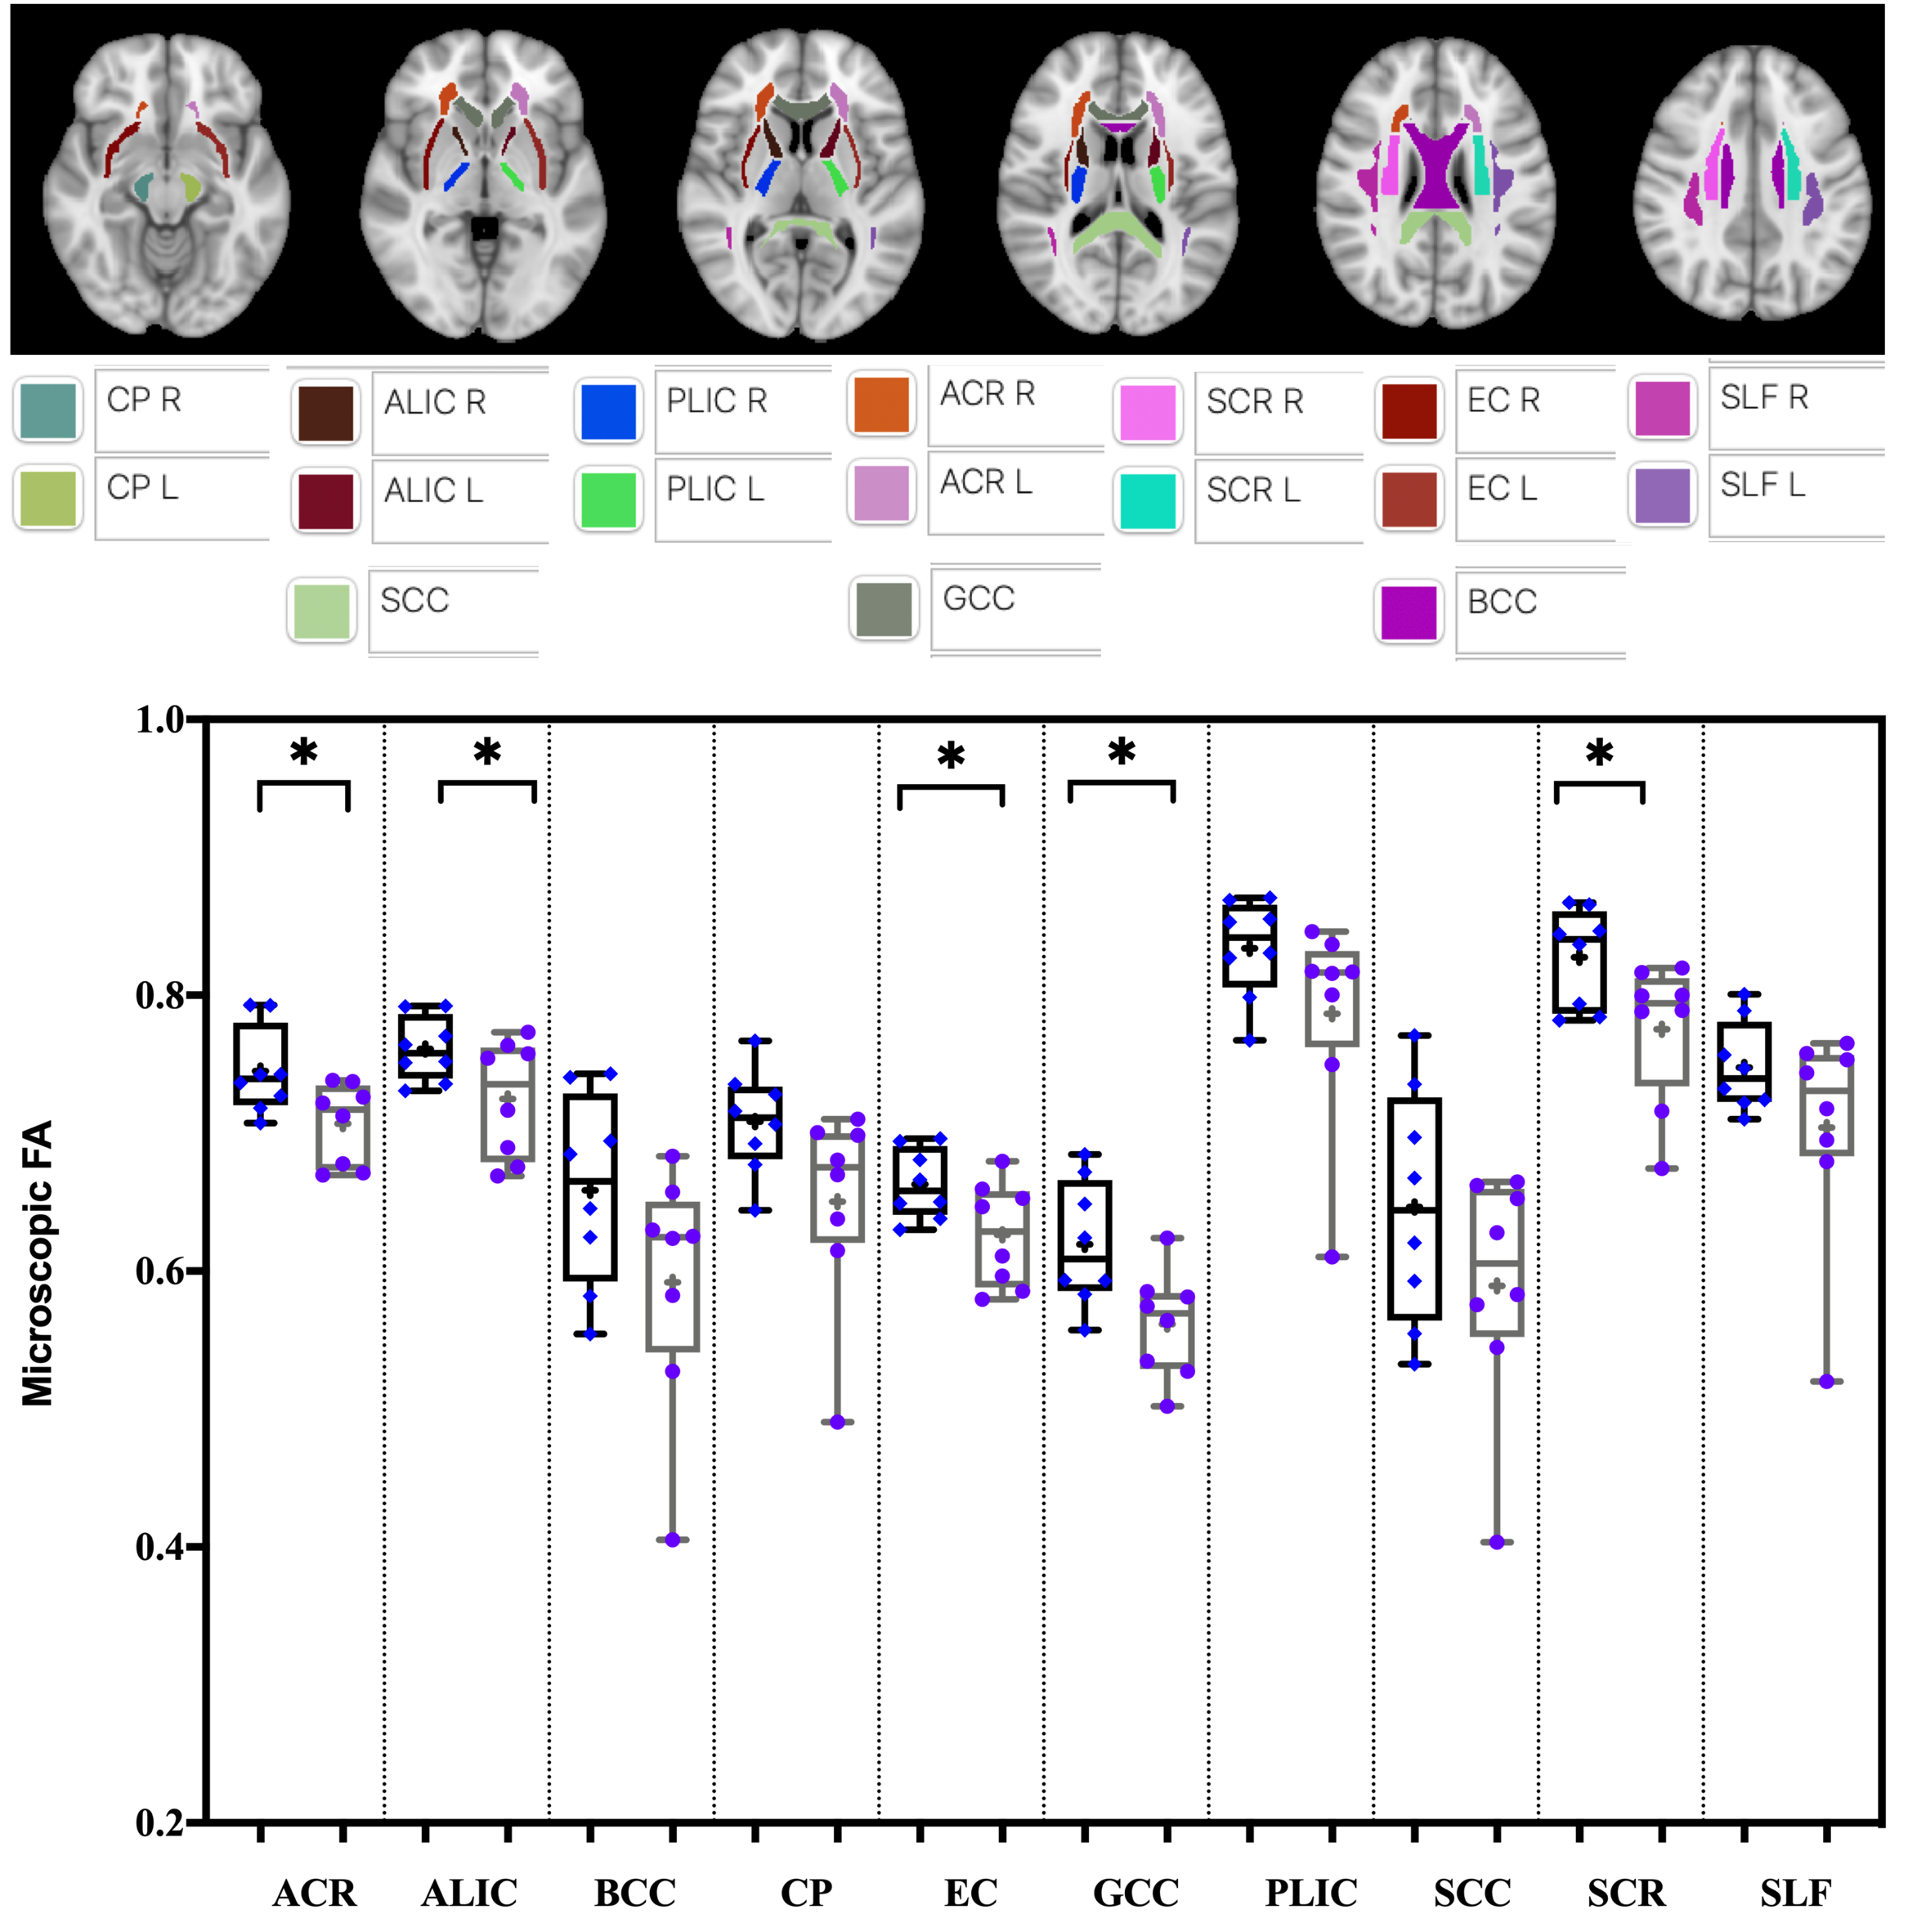
To map significant differences between FA and μFA, a voxel-wise statistical analysis was performed using tract based spatial statistics (TBSS) implemented in FSL 14. The JHU WM atlas was used to calculate region averages in native space for 17 pre-defined regions-of-interest (ROIs) [i.e., 3 unilateral structures - SCC: Splenium of the corpus callosum; GCC: Genu of the corpus callosum; BCC: Body of corpus callosum; and 7 bilateral structures - ALIC: Anterior limbic internal capsule; PLIC: Posterior limbic internal capsule; EC: External capsule; SLF: Superior longitudinal fasciculus; CP: Cerebral Peduncle; ACR: Anterior Corona Radiata; and SCR: Superior Corona Radiata. Unpaired t-test was used to compare the differences in ROIs between the two cohorts.
Results:
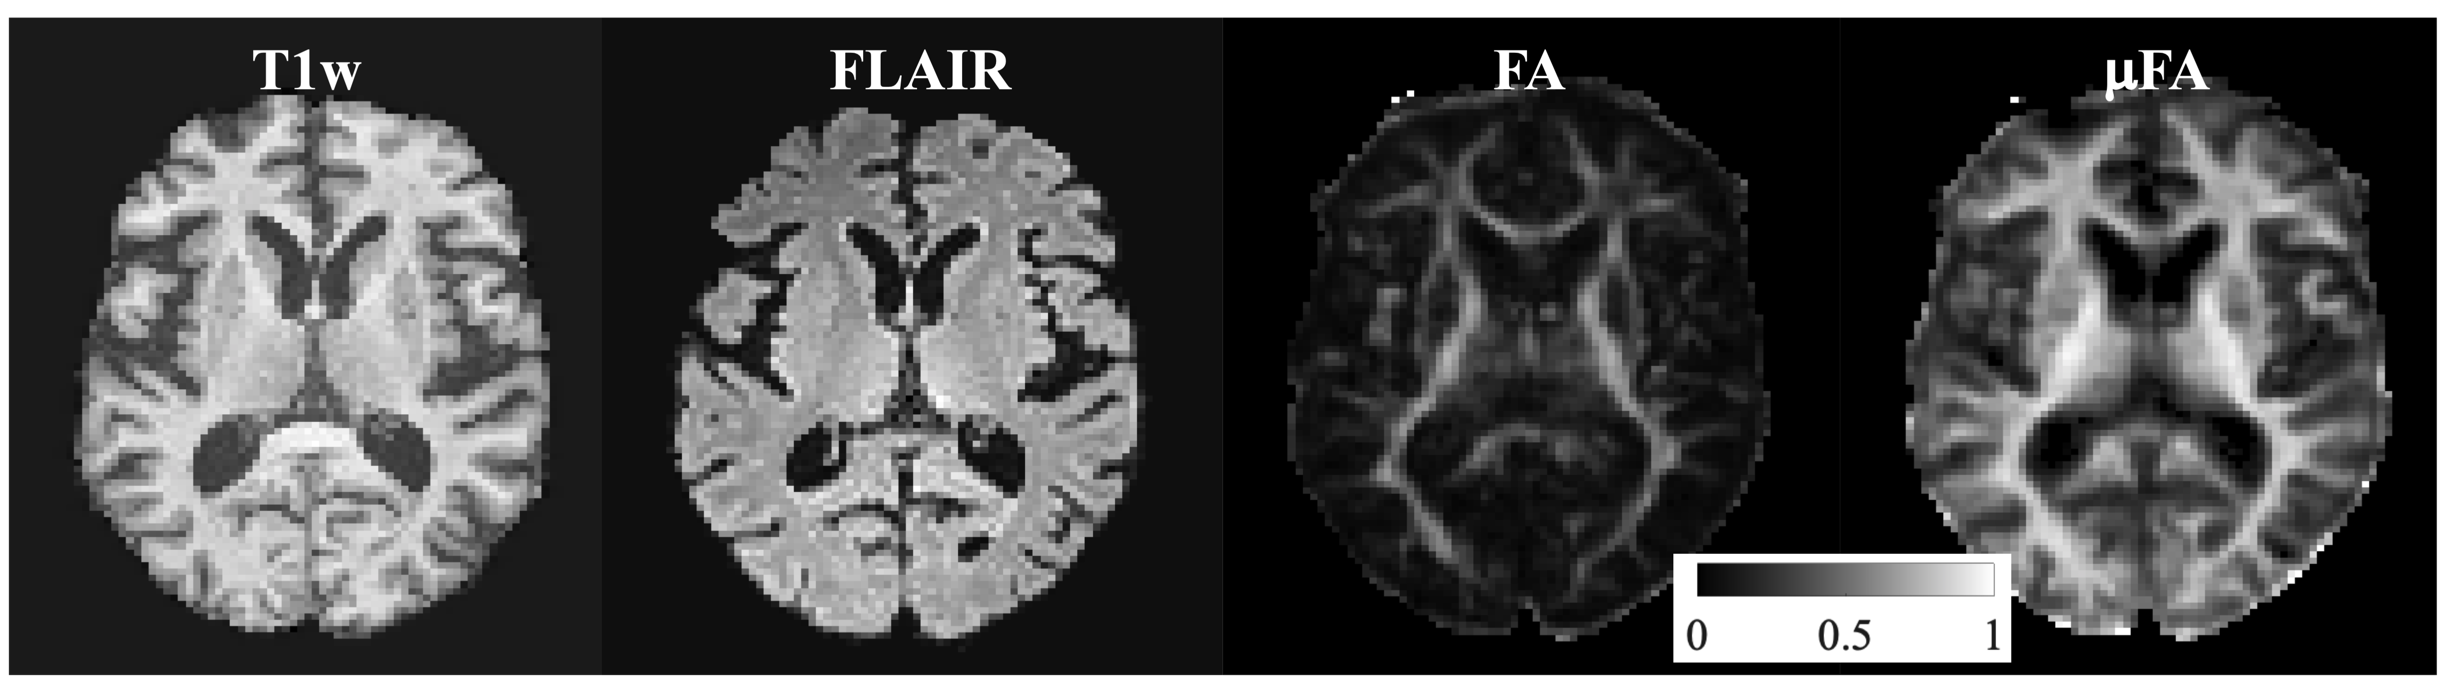
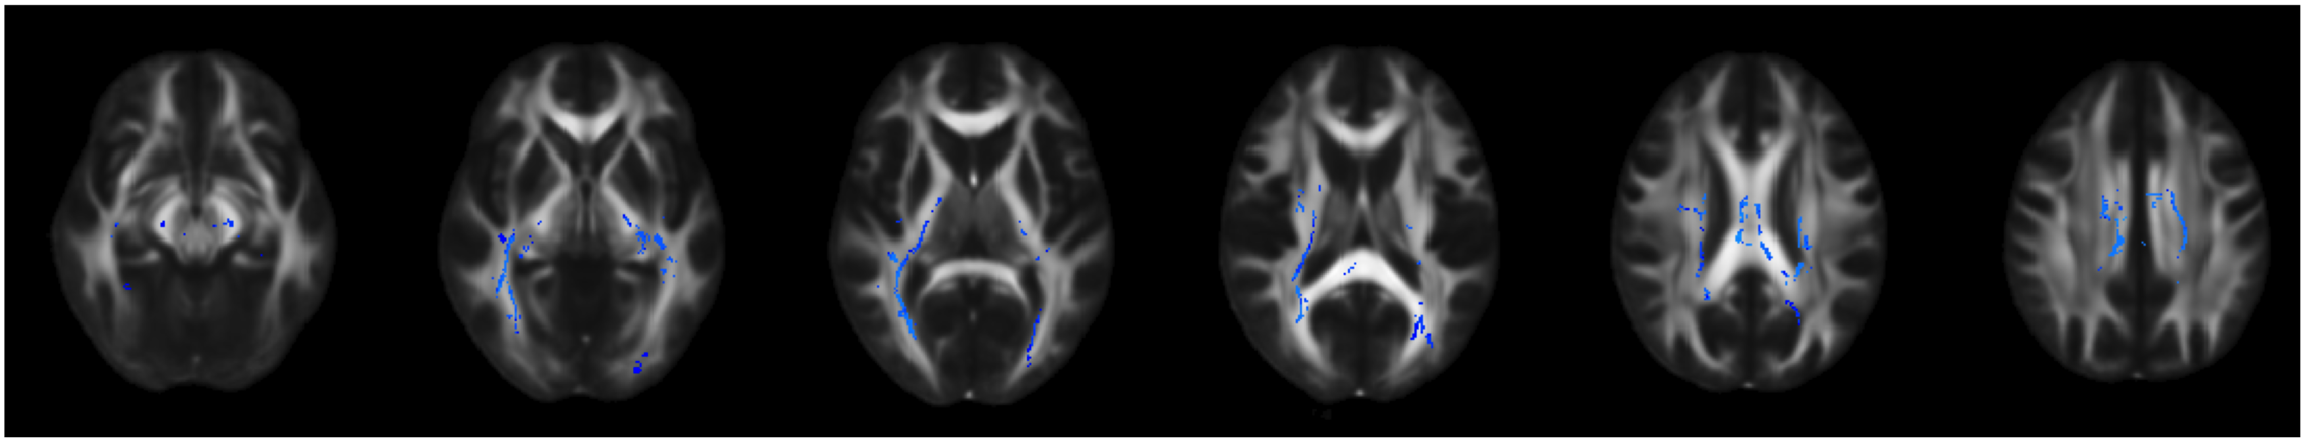
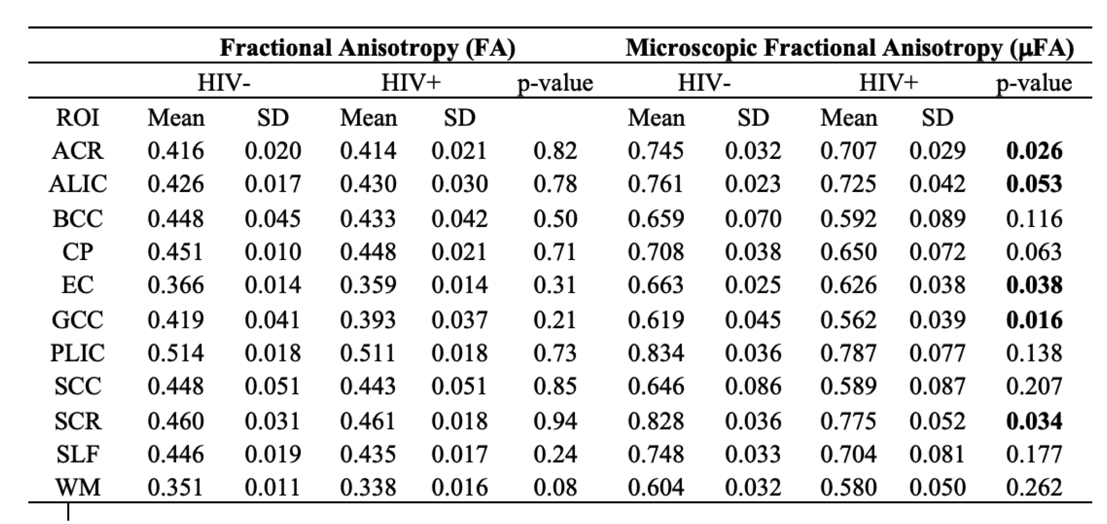
Figure 1 represents example images (anatomical images: T1w, T2-FLAIR; diffusion metrics: FA and μFA maps) from a 61 years old HIV+ participant. It’s evident that μFA has greater conspicuity compared to conventional FA. TBSS analyses revealed a significant change in μFA for HIV+ vs. HIV- participants (Figure 2). However, FA did not show any significant changes between HIV+ and HIV- though FA values decreased in most of the WM structures (Table 1). Figure 3 presents whisker-box plots comparing μFA in 10 different WM structures for HIV+ vs. HIV- cohorts. μFA values were significantly decreased, mainly in the ACR, SCR, ALIC, EC, and GCC while no ROI showed any significance for FA (Table 1). A previous study reported that the corona radiata (ACR and SCR) contains crossing fibers that project from the brain stem to the prefrontal cortex via internal capsule 15. Decreased μFA in those ROIs likely reflects axonal pathology in WM. Our preliminary results indicate that μFA seems to provide better sensitivity than the conventional FA for detecting WM microstructure changes associated with HIV infection, especially in the areas with crossing fibers.Conclusion:
μFA can be used to evaluate WM microstructural abnormalities associated with HIV infection and may overcome the limitation of FA with regard to fiber architecture.Acknowledgements
This work was supported by the National Institutes of Health (Grant Numbers: R01 AG054328, and R01MH118020), and the Del Monte Institute of Neuroscience, University of Rochester (Pilot grant).References
1. Su, T., et al., White matter hyperintensities in relation to cognition in HIV-infected men with sustained suppressed viral load on combination antiretroviral therapy. Aids, 2016. 30(15): p. 2329-2339.
2. Haddow, L.J., et al., Magnetic Resonance Imaging of Cerebral Small Vessel Disease in Men Living with HIV and HIV-Negative Men Aged 50 and Above. AIDS research and human retroviruses, 2019.
3. Caunca, M.R., et al., Neuroimaging of cerebral small vessel disease in normal cognitive aging. Frontiers in aging neuroscience, 2019. 11: p. 145.
4. Jokinen, H., et al., Global Burden of Small Vessel Disease–Related Brain Changes on MRI Predicts Cognitive and Functional Decline. Stroke, 2019: p. STROKEAHA. 119.026170.
5. Douaud, G., et al., DTI measures in crossing-fibre areas: increased diffusion anisotropy reveals early white matter alteration in MCI and mild Alzheimer's disease. Neuroimage, 2011. 55(3): p. 880-890.
6. Szczepankiewicz, F., et al., Tensor-valued diffusion encoding for diffusional variance decomposition (DIVIDE): Technical feasibility in clinical MRI systems. PloS one, 2019. 14(3): p. e0214238.
7. Nilsson, M., et al., Tensor-valued diffusion MRI in under 3 minutes: An initial survey of microscopic anisotropy and tissue heterogeneity in intracranial tumors. arXiv preprint arXiv:1902.09986, 2019.
8. Szczepankiewicz, F., S. Hoge, and C.-F. Westin, Linear, planar and spherical tensor-valued diffusion MRI data by free waveform encoding in healthy brain, water, oil and liquid crystals. Data in brief, 2019. 25: p. 104208.
9. Andersson, J.L., S. Skare, and J. Ashburner, How to correct susceptibility distortions in spin-echo echo-planar images: application to diffusion tensor imaging. Neuroimage, 2003. 20(2): p. 870-888.
10. Zhang, H., et al., NODDI: practical in vivo neurite orientation dispersion and density imaging of the human brain. Neuroimage, 2012. 61(4): p. 1000-16.
11. Klein, S., et al., Elastix: a toolbox for intensity-based medical image registration. IEEE transactions on medical imaging, 2009. 29(1): p. 196-205.
12. Nilsson, M., et al., Extrapolation-based references improve motion and eddy-current correction of high b-value DWI data: application in Parkinson’s disease dementia. PloS one, 2015. 10(11): p. e0141825.
13. Nilsson, M., et al. An open-source framework for analysis of multidimensional diffusion MRI data implemented in MATLAB. in Proc Intl Soc Mag Reson Med. 2018.
14. Smith, S.M., et al., Tract-based spatial statistics: voxelwise analysis of multi-subject diffusion data. Neuroimage, 2006. 31(4): p. 1487-1505.
15. Elliott, L., B. Mancall, and J. David, Gray's clinical neuroanatomy: the anatomic basis for clinical neuroscience. 2011: ELSEVIER INDIA.
Figures