0204
Application of graph theory across multiple frequency bands in obsessive-compulsive disorder1Department of Physics, Sichuan university, chengdu, China, 2Huaxi Magnetic Resonance Research Centre (HMRRC), West China Hospital of Sichuan University, chengdu, China
Synopsis
Graph theoretical approaches across multiple frequency bands were adopted to investigate whether there exist specific frequency band-related changes of brain functional connectome in OCD patients. We found significant between-group differences of global metrics only at slow-3 band (.074–0.198 Hz), On local metrics, we observed a frequency-dependent characteristic. The results suggested that multiband measurement indeed provided some new insight about the nature of brain functional connectome changes in OCD, future studies should take the different frequency bands into account when measure brain’s spontaneous activity.
Purpose
Obsessive-compulsive disorder (OCD) is a relatively widespread chronic neuropsychiatric disease with a lifetime prevalence of 1%-3% [1] . Accumulated neuroimaging studies of OCD have indicated abnormal brain structure and dyfunction of several large-scale networks, such as default-mode networks (DMN), salience networks (SN), frontoparietal networks (FPN) and fronto-limbic networks (SN) [2-5]. Recently, graph theory has attracted growing interests for exploring the topological features of the coherent brain activities during resting-state in OCD patients. Conventionally, rs-fMRI literature has restricted the spontaneous blood oxygen level dependent (BOLD) signals to the frequency bands between 0.01 and 0.08Hz. However, several studies have showed other frequency bands(>0.08Hz) may contain valuable information [6-8]. Here, we employed graph theoretical approaches to analysis whole-brain functional system across four frequency bands in OCD and healthy controls.Materials and Methods
We recruited 74 drug-naïve OCD patients and 93 healthy control subjects (HCs) matched for sex and age via poster advertisements (Table1). All images were acquired using a 3T GE MRI scanner with an 8-channel phase-array head coil. The following scanning parameters were used: number of slices=30, time repetition(TR) = 2000ms, time echo = 30ms, flip angle=90◦, slice thickness = 5mm with no slice gap, field of view =240×240mm2, and 200 volumes in each run. The rs-fMRI data was preprocessed using Data Processing Assistant for Resting-State fMRI (DPARSF). We subdivided the overall BOLD frequency band between .0 and .25 Hz (TR=2s) into four distinct frequency bands including slow-2 (0.199–0.25 Hz), slow-3 (.074–0.198 Hz), slow-4 (.027–.073 Hz) and slow-5 (.01-0.27Hz). On each band, we used the automated anatomical labeling (AAL) atlas to generated a 90×90 correlation matrix for each subject. We selected a sparsity range of 0.1-0.4 to construct a binary undirected graph and calculated the graph-theory metrics for all bands by using the Graph Theoretical Network Analysis (GRETNA) toolbox v2.0 [11]. Global metrics included small-world parameters (small-worldness, σ ; normalized clustering coefficient, γ ; normalized characteristic path length, λ ), global efficiency(Eg) and modularity(Q). Local measures included degree centrality, betweenness centrality, nodal clustering coefficient and shortest path. Area under the curve (AUC) across the full range of sparsity with 0.01 intervals was calculated for each metric. These AUC values were used for statistical comparisons. These analyses were also calculated in traditional low-frequency band (0.01–0.08 Hz) to provide findings comparable to earlier studies. Two sample t-test was used for all metrics. The p values were corrected using False Discovery Rate (FDR).Results
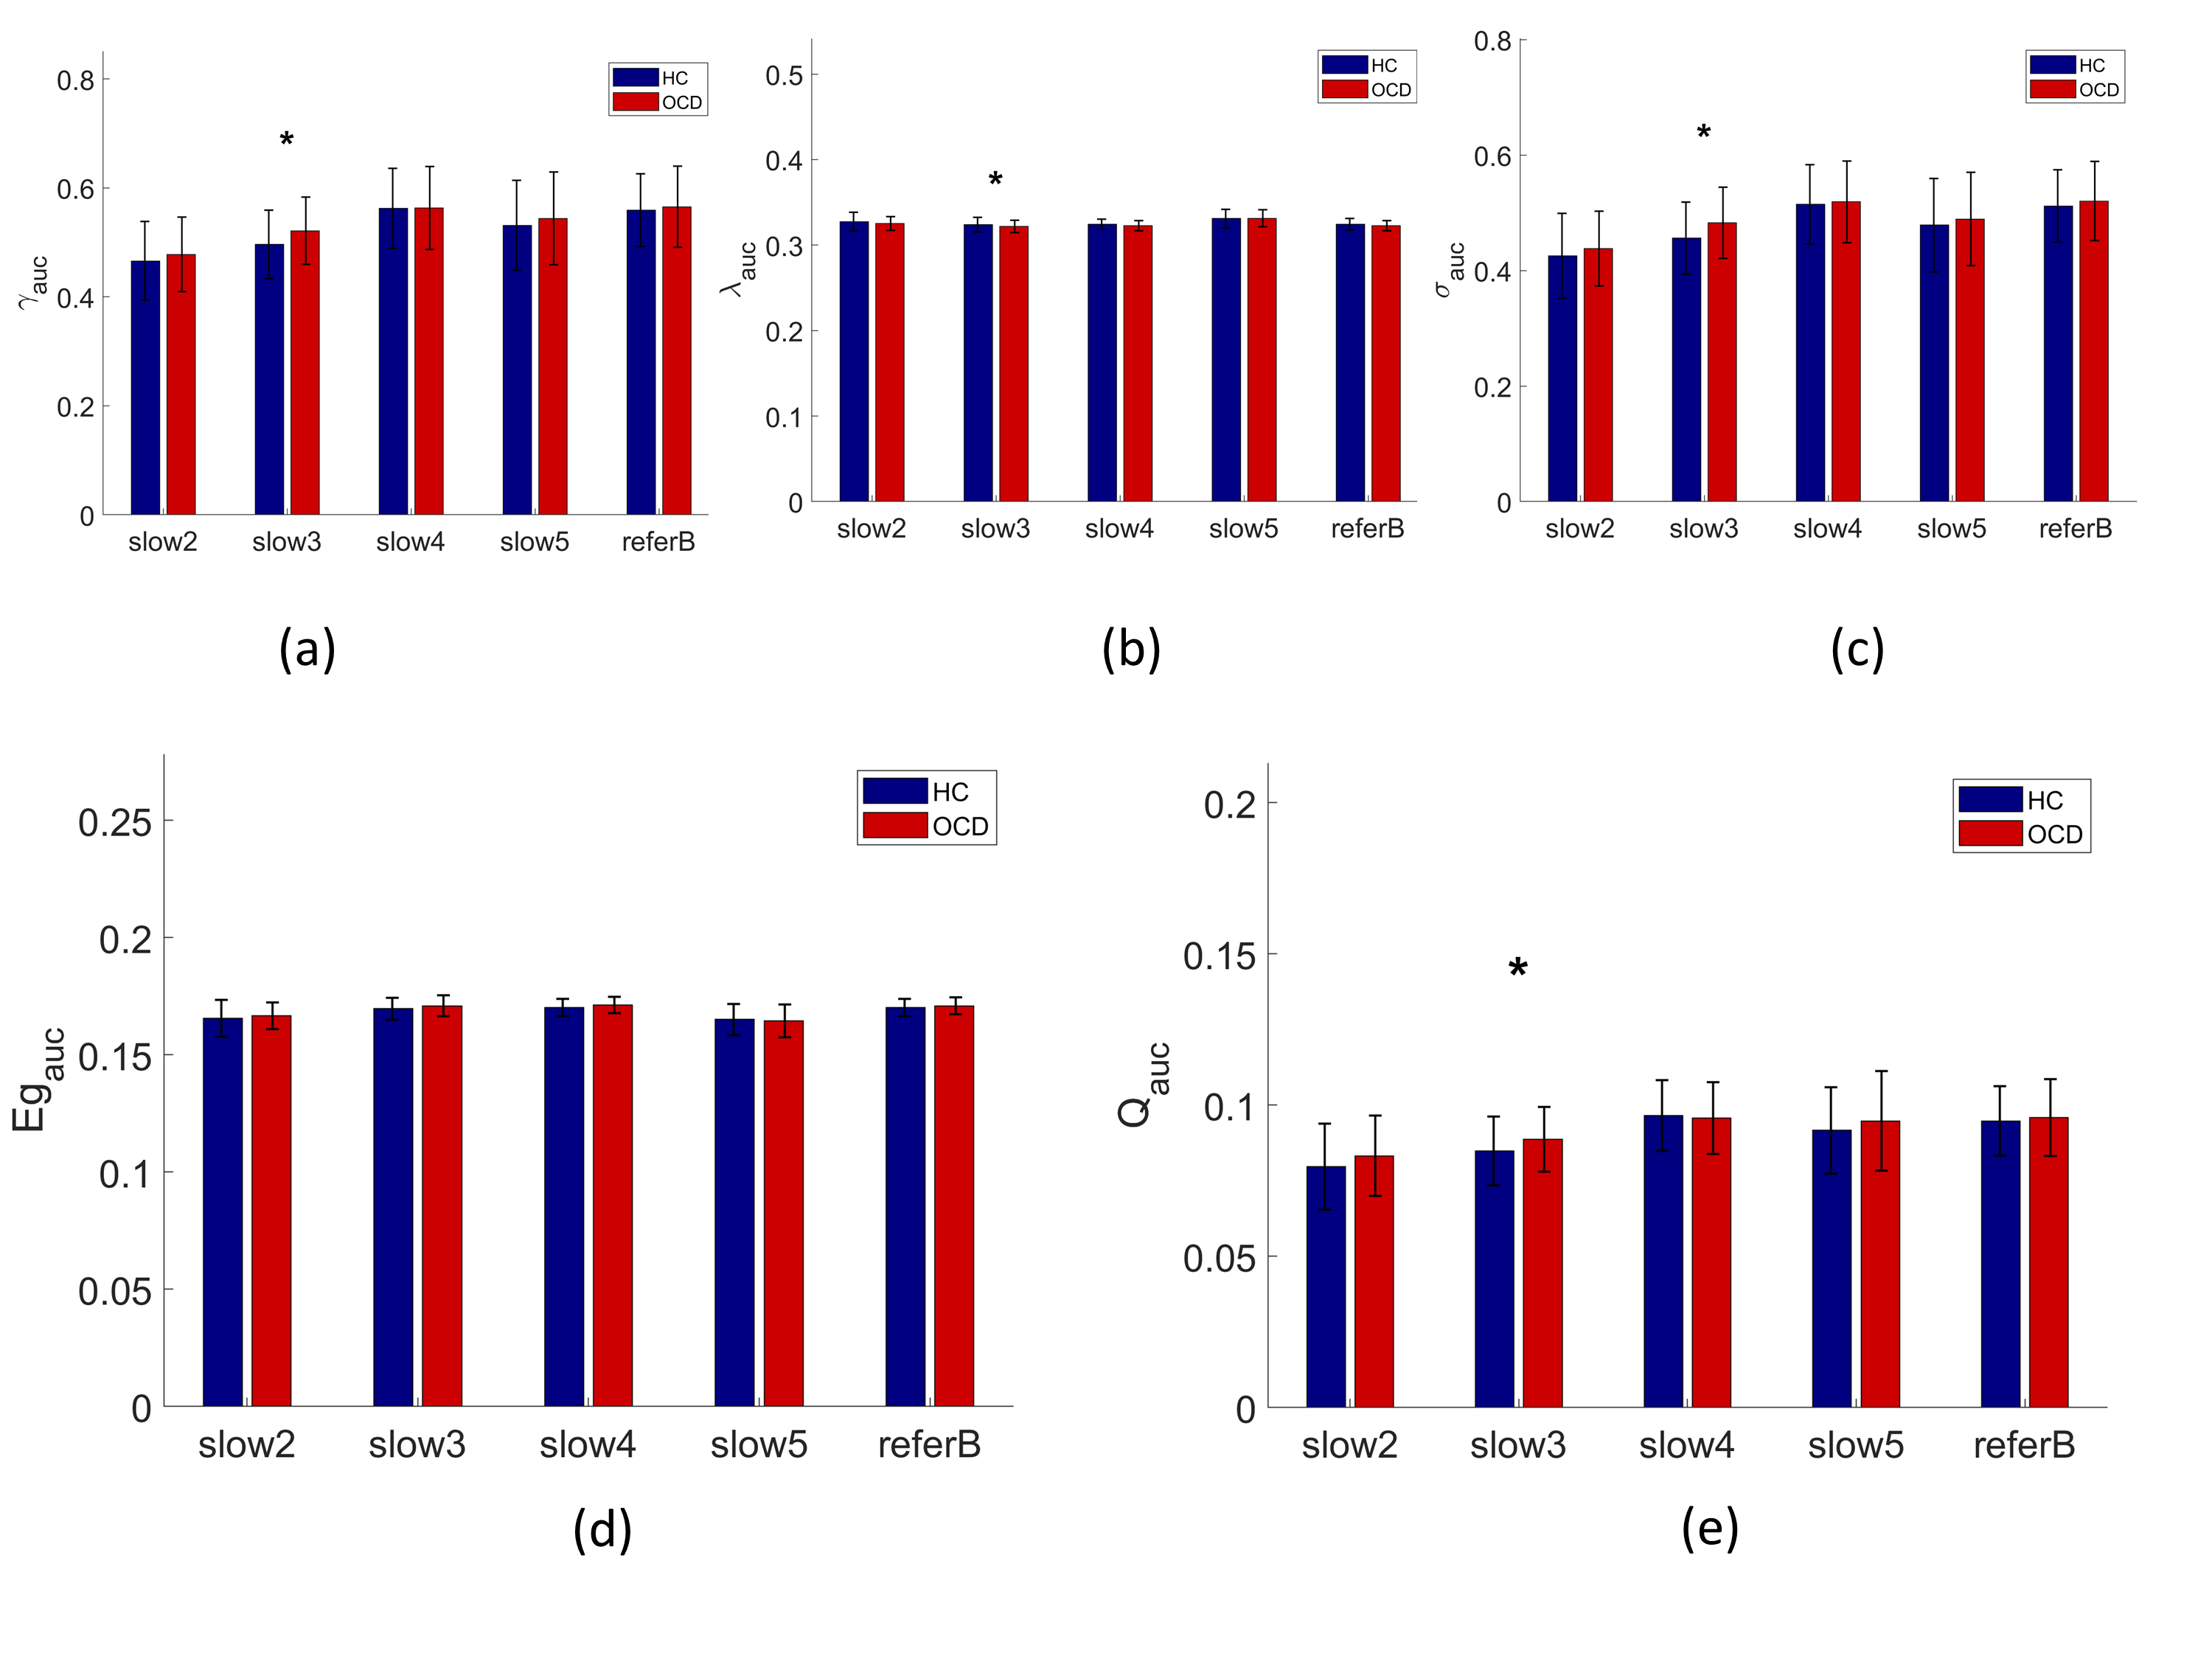
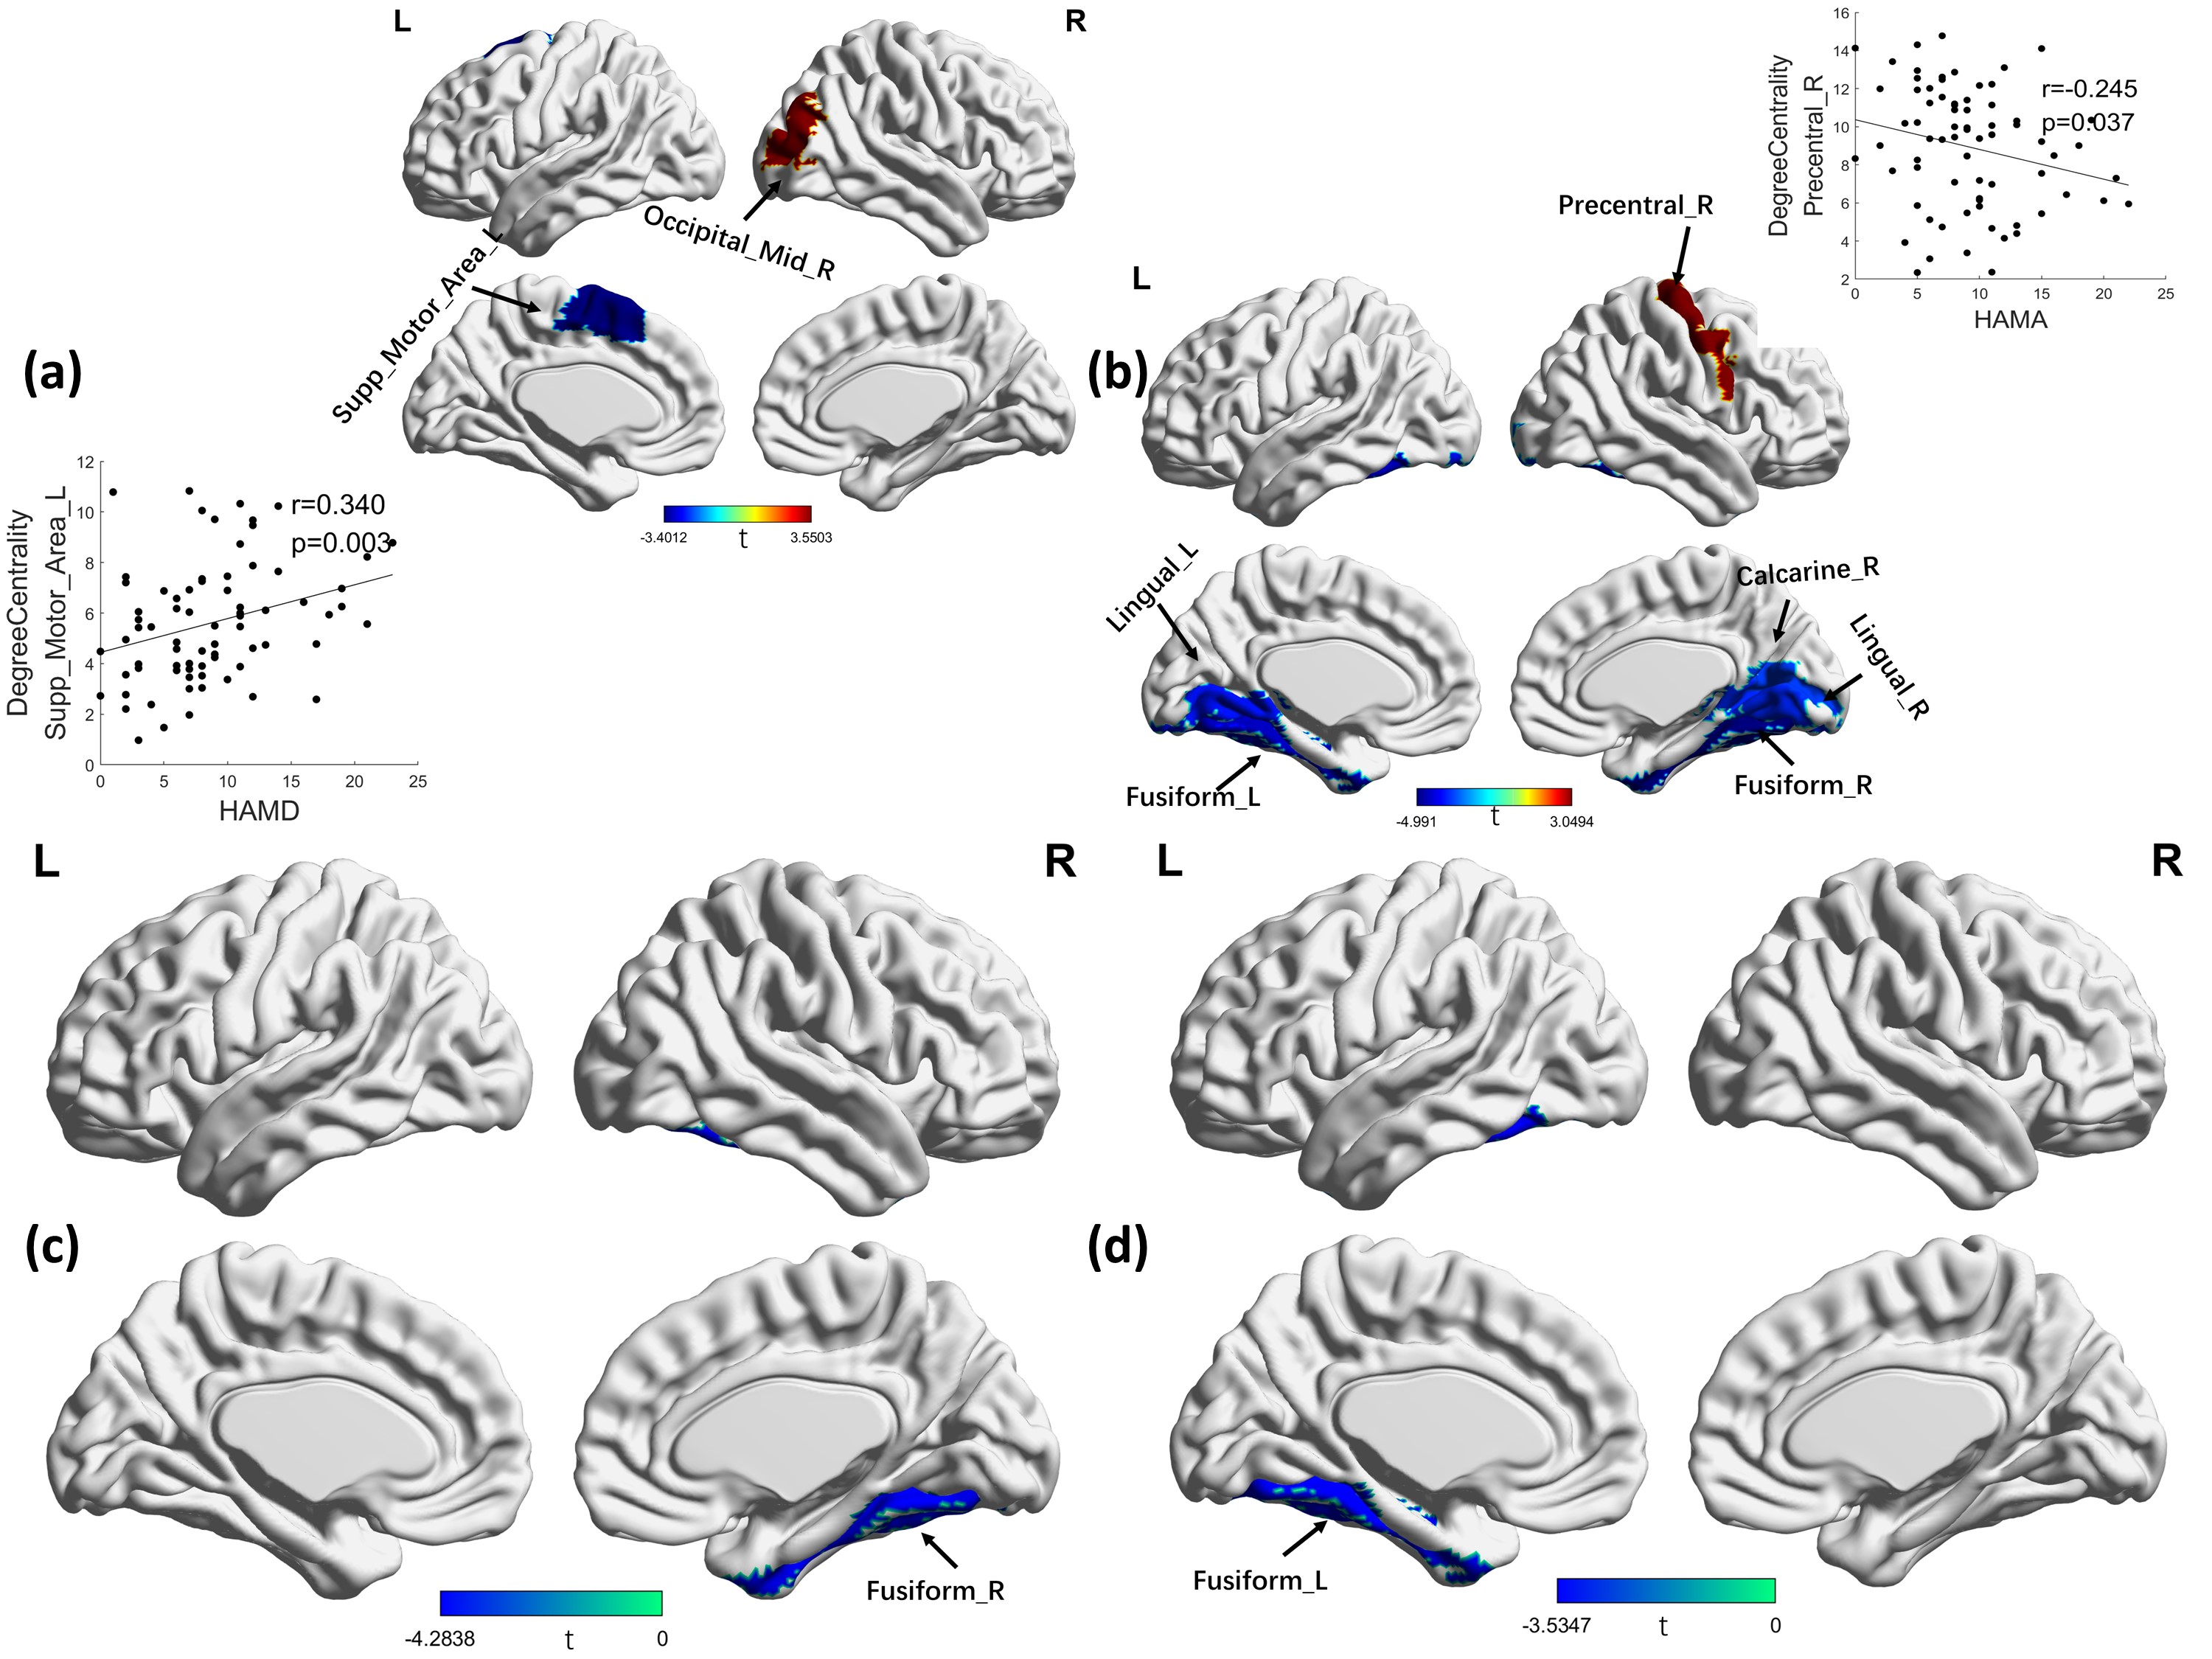
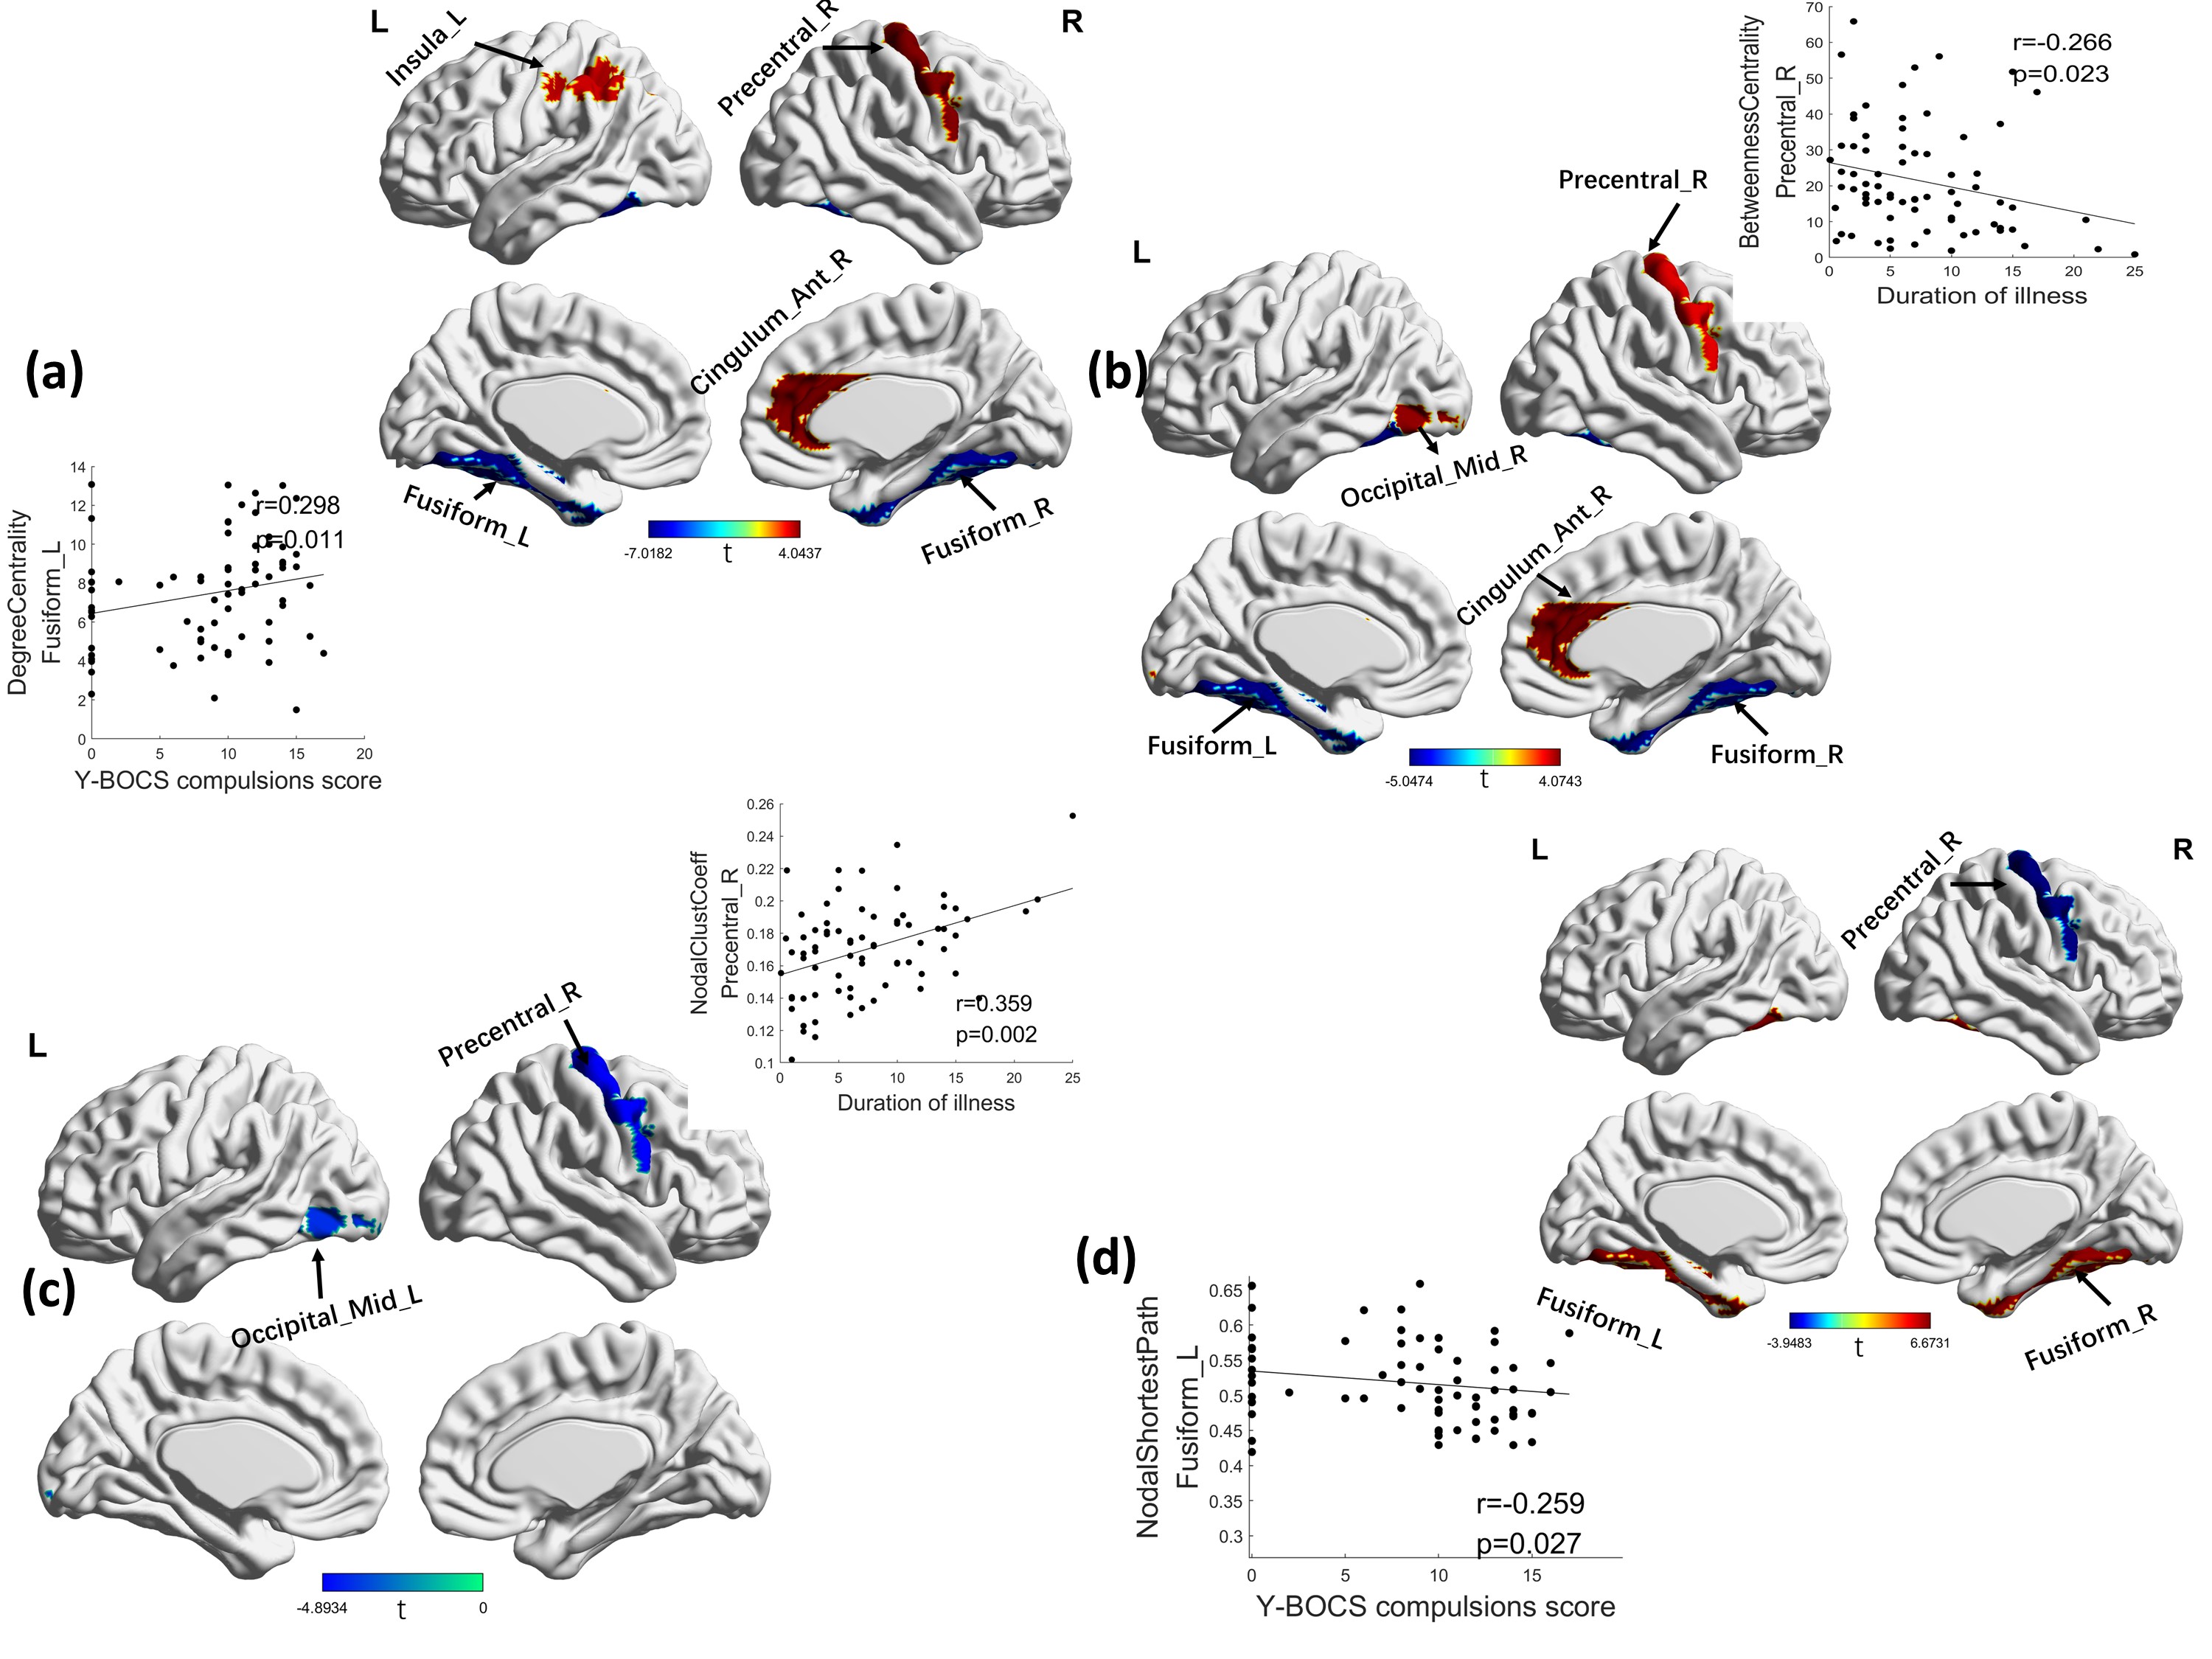
1. Global characteristics: As shown in Fig 1. OCD cohorts showed a significant change in the area under the γ (t=2.732, p=0.007), σ (t=2.869, p=0.005) curve, λ (t=-2.021, p=0.045) and modularity (t=2.452, p=0.015) only at slow3 frequency band.2. Nodal characteristics: As shown in Fig 2 and Fig 3. At slow-4 band, the OCD patients showed increased degree centrality at the right occipital region and decreased at left supplementary motor area, along with a decreased betweenness centrality at the left fusiform cortex. At slow-3 band, degree centrality increased in right precentral, right cingulum anterior and left parietal area, decreased in fusiform cortex. The increase areas of betweenness were sited at right precentral, anterior cingulum and occipital cortex, the decrease areas were sited at fusiform. Significant lower clustering coefficient was found in right precentral and left occipital region. The shortest path of right precentral cortex was significantly decreased in OCD patients, while increased in bilateral fusiform. At slow-2 band, increased regions were located in right precentral, decreased in right calcarine, bilateral lingual and fusiform. Significant decreased betweeness was found at right fusiform area.
Discussion and Conclusion
To our knowledge, this is the first study to investigate whole-brain connectome alterations in graph-theory metrics of adult OCD patients across different BOLD signal oscillation bands. On global metrics, OCD patients showed increased small worldness and modularity only at slow-3 band. On local metrics, we observed a frequency-dependent characteristic, the main significant differences in regions including right precentral gyrus, occipital region, right anterior cingulum cortex and fusiform cortex. The results suggested that multiband measurement, spanning beyond 0.08Hz, indeed provided some new insight about the nature of brain functional connectome changes in OCD, future studies should take the different frequency bands into account when measure brain’s spontaneous activity.Acknowledgements
This study was supported by the National Natural Science Foundation (Grant No. 81671669, 82027808), Key Research Project of Sichuan Science and Technology Department (Grant No. 2020YFS0048).References
[1] Ruscio AM, Stein DJ, Chiu WT, Kessler RC. The epidemiology of obsessive-compulsive disorder in the National Comorbidity Survey Replication. Mol Psychiatry. 2010 Jan;15(1):53-63. doi: 10.1038/mp.2008.94. Epub 2008 Aug 26.
[2] Boedhoe PSW, Schmaal L, Abe Y, Alonso P, Ameis SH, Anticevic A, et al. Cortical abnormalities associated with pediatric and adult obsessive compulsive disorder: findings from the ENIGMA obsessive-compulsive disorder working group. Am J Psychiatry 2018; 175: 453–62.
[3] Boedhoe PS, Schmaal L, Abe Y, Ameis SH, Arnold PD, Batistuzzo MC, et al. Distinct subcortical volume alterations in pediatric and adult OCD: a worldwide meta- and mega-analysis. Am J Psychiatry 2017; 174: 60–9.
[4] de Wit SJ, Alonso P, Schweren L, Mataix-Cols D, Lochner C, Menchon JM, et al. Multicenter voxel-based morphometry megaanalysis of structural brain scans in obsessive-compulsive disorder. Am J Psychiatry 2014;171: 340–9.
[5] de Vries FE, de Wit SJ, van den Heuvel OA, Veltman DJ, Cath DC,van Balkom A, et al. Cognitive control networks in OCD: a restingstate connectivity study in unmedicated patients with obsessive-compulsive disorder and their unaffected relatives. World J Biol Psychiatry 2017; 20:230–42.
[6] Salvador R, Martínez A, Pomarol-Clotet E, Gomar J, Vila F, Sarró S, Capdevila A, Bullmore E. A simple view of the brain through a frequency-specific functional connectivity measure. Neuroimage. 2008 Jan 1;39(1):279-89. doi: 10.1016/j.neuroimage.2007.08.018. Epub 2007 Aug 25.
[7] Gohel S, Gallego JA, Robinson DG, DeRosse P, Biswal B, Szeszko PR. Frequency specific resting state functional abnormalities in psychosis. Hum Brain Mapp. 2018 Nov;39(11):4509-4518. doi: 10.1002/hbm.24302. Epub 2018 Aug 30.
[8] Zuo XN, Di Martino A, Kelly C, Shehzad ZE, Gee DG, Klein DF, Castellanos FX, Biswal BB, Milham MP. The oscillating brain: complex and reliable. Neuroimage. 2010 Jan 15;49(2):1432-45. doi: 10.1016/j.neuroimage.2009.09.037. Epub 2009 Sep 24.
[9] Sen B, Bernstein GA, Tingting Xu, Mueller BA, Schreiner MW, Cullen KR, Parhi KK. Classification of obsessive-compulsive disorder from resting-state fMRI. Annu Int Conf IEEE Eng Med Biol Soc. 2016 Aug;2016:3606-3609. doi: 10.1109/EMBC.2016.7591508.
[10] Saad, Z. S., Gotts, S. J., Murphy, K., Chen, G., Jo, H. J., Martin, A., & Cox, R. W., 2012. Trouble at rest: How correlation patterns and group differences become distorted after global signal regression. Brain Connectivity, 2(1), 25–32.
[11] Wang, J., Wang, X., Xia, M., Liao, X., Evans, A., & He, Y. (2015). GRETNA: a graph theoretical network analysis toolbox for imaging connectomics. Frontiers in human neuroscience, 9, 386.
Figures
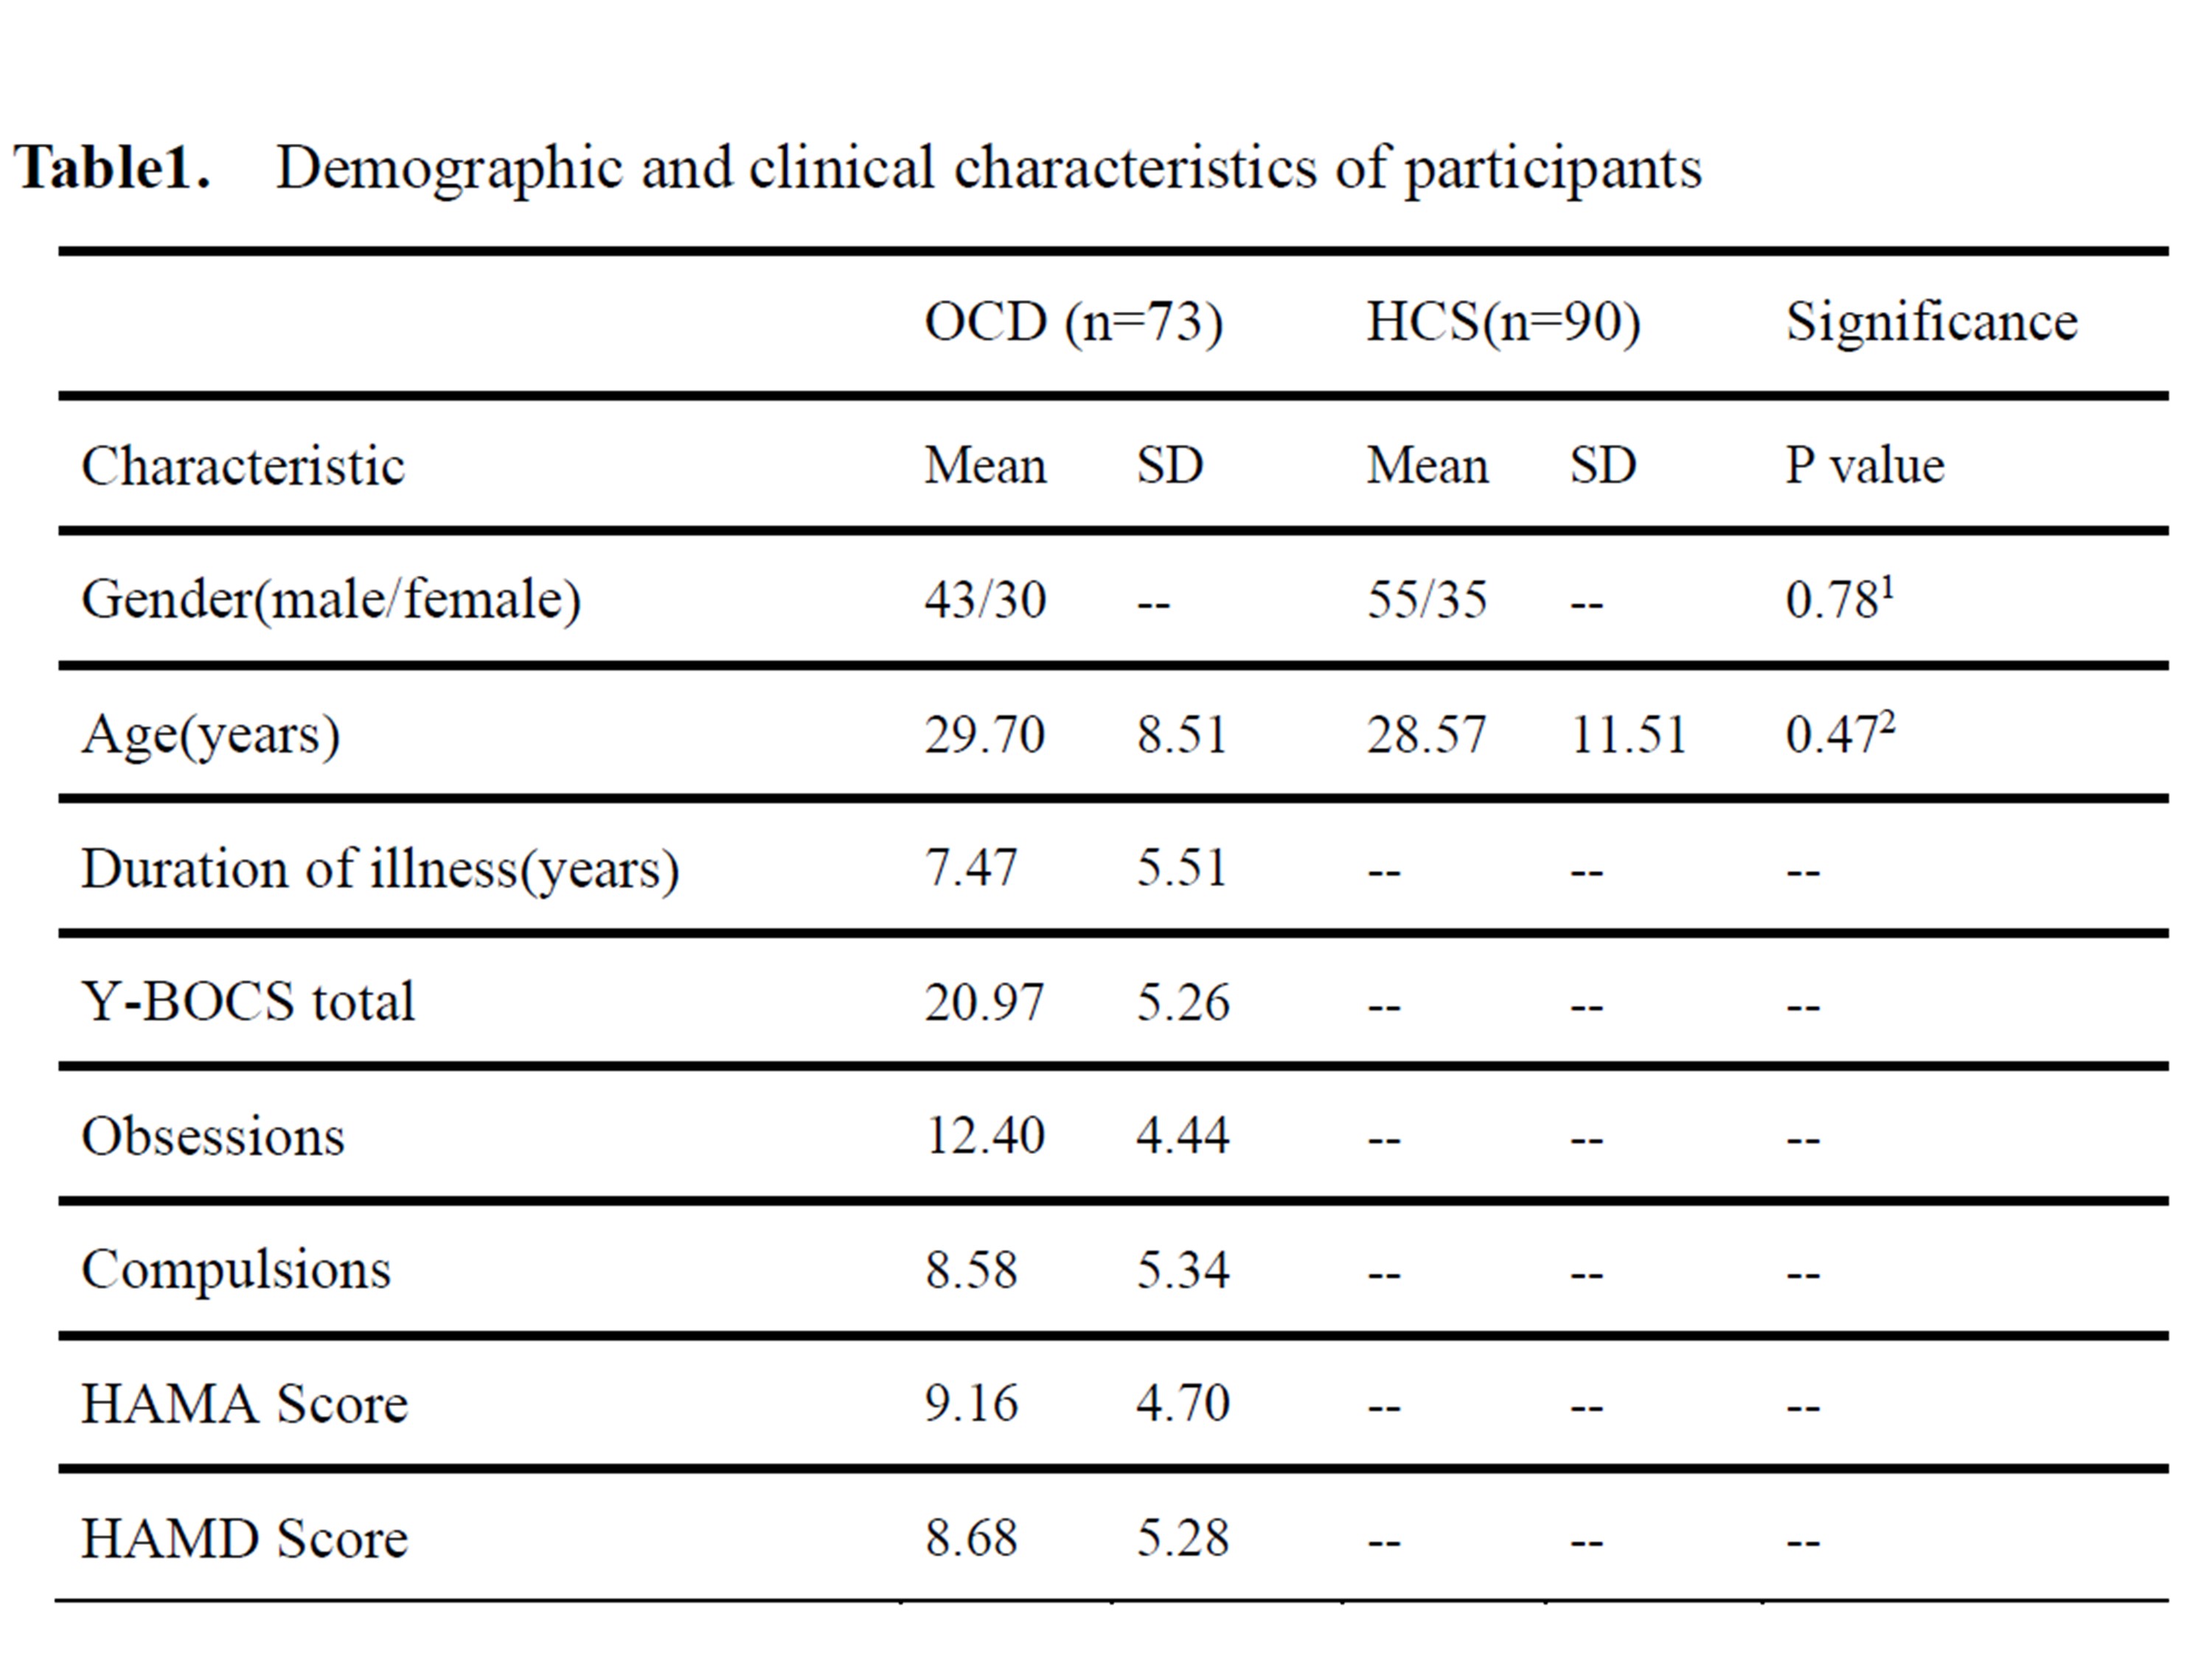
OCD, obsessive compulsive disorder; HC, healthy controls; Y-BOCS, Yale-Brown Obsessive Compulsive Scale; HAMD, 17-item Hamilton Depression Rating Scale; HAMA, Hamilton Anxiety Rating Scale.
1 two-sample t-test with the HC.
2 χ2 test with the HC.