0200
Reductions of fibre-specific white matter metrics in autism are determined by the level of intellectual functioning: a fixel-based analysis1Institute for Radiological Research, Chang Gung University and Chang Gung Memorial Hospital, Taoyuan, Taiwan, 2Department of Child and Adolescent Psychiatry, Chang Gung Memorial Hospital, Linkou Medical Center, Taoyuan, Taiwan, 3Department of Psychiatry, National Taiwan University Hospital and College of Medicine, Taipei, Taiwan, 4Azrieli Adult Neurodevelopmental Centre and Adult Neurodevelopmental and Geriatric Psychiatry Division, Centre for Addiction and Mental Health, Department of Psychiatry, University of Toronto, Toronto, ON, Canada
Synopsis
Based on the multi-band multi-shell diffusion MRI data acquisition and fixel-based analysis, the purpose of our study is to provide more insights into neurobiological accounts of autism, inclusive of understudied low functioning individuals. Preprocessed DWI data of 38 TD and 65 autistic participants were analysed. We found reduced fibre density in the splenium of the corpus callosum in autisitic individuals. This autism-associated alteration appears to be mainly driven by those autistic individuals with developmental disabilities. Our findings suggest studies inclusive of autistic people comorbid with developmental disabilities using the novel models may bridge some heterogeneity noted in the literature.
Introduction
It has been long held that autism spectrum disorder (ASD) is a condition of brain dysconnectivity, which can be characterized by altered white matter microstructural properties, such as measured using diffusion tensor imaging1. However, the pathological loci associated with ASD, relative to typically developing (TD) individuals, are highly heterogeneous across studies2. The most likely consistent findings are decreased tensor-derived fractional anisotropy and/or increased mean diffusivity at the corpus callosum (CC), superior longitudinal fasciculus, and left uncinate fasciculus2. The inconsistency may be partly due to methodological caveats, i.e. the well-known limitations of the diffusion tensor model in regions containing crossing fibres3. The newly developed fixel-based analysis (FBA4) provides fibre tract-specific analysis at a within-voxel level (called 'fixel') as opposed to analyses of voxel-averaged metrics. FBA has been shown to be more sensitive and interpretable than voxel-wise methods4,5. Recently, studies using FBA demonstrate white matter alterations in ASD6,7, which show mixed results and are both limited by the representativeness of the autistic cohort given the exclusion of participants with lower intellectual functioning levels on the spectrum. Based on the present state-of-the-art diffusion MRI data acquisition and processing methods, the purpose of our study is to provide more comprehensive insights into neurobiological accounts of ASD, inclusive of low functioning individuals, who are generally left out in the current lore.Methods
We recruited 39 TD and 72 participants diagnosed with ASD. The ASD group were categorised into high functioning (HF-ASD, those with IQ and adaptive function >85, n=34) and low functioning ASD (LF-ASD, those with IQ and adaptive function <85, n=31) sub-groups. LF-ASD were further divided into two subgroups, one with low IQ-only (n=24) and the other with minimally verbal status (effective use of <30 words in verbal expression, n=7).Multi-shell diffusion-weighted imaging (DWI) data were acquired on a 3T Siemens Prisma MRI scanner with a 64-channel head/neck array coil, using the simultaneous multi-slice EPI sequence8 with the following parameters: 2.2-mm isotropic voxel, TR/TE = 2238/86 ms, multi-band acceleration factor = 4, number of diffusion gradient directions = 19/30/90/60 at b=0/350/1000/3000 s/mm2 respectively. All procedures above were approved by the local Research Ethics Board.
DWI data pre-processing included denoising9, Gibbs ringing removal10, corrections for image distortions, subject movements11-13, and bias field14. Quality assessments were performed to exclude DWI data with excessive signal loss, artefacts, or in-scanner motion (>1mm). Preprocessed DWI data of 38 TD and 65 autistic participants were eventually analysed (Table 1). Multi-shell multi-tissue constrained spherical deconvolution15 was then applied on the intensity normalised and upsampled DWI data to compute fibre orientation distributions (FODs). We then followed the recommended FBA processing steps4,16,17 to compare between TD and ASD groups based on the fixel-wise metrics of fibre density (FD), fibre cross-section (FC), and combined FD and FC (FDC). Family-wise error (FWE) correction was used for multiple comparisons, with statistical significance at P < 0.05.
Results
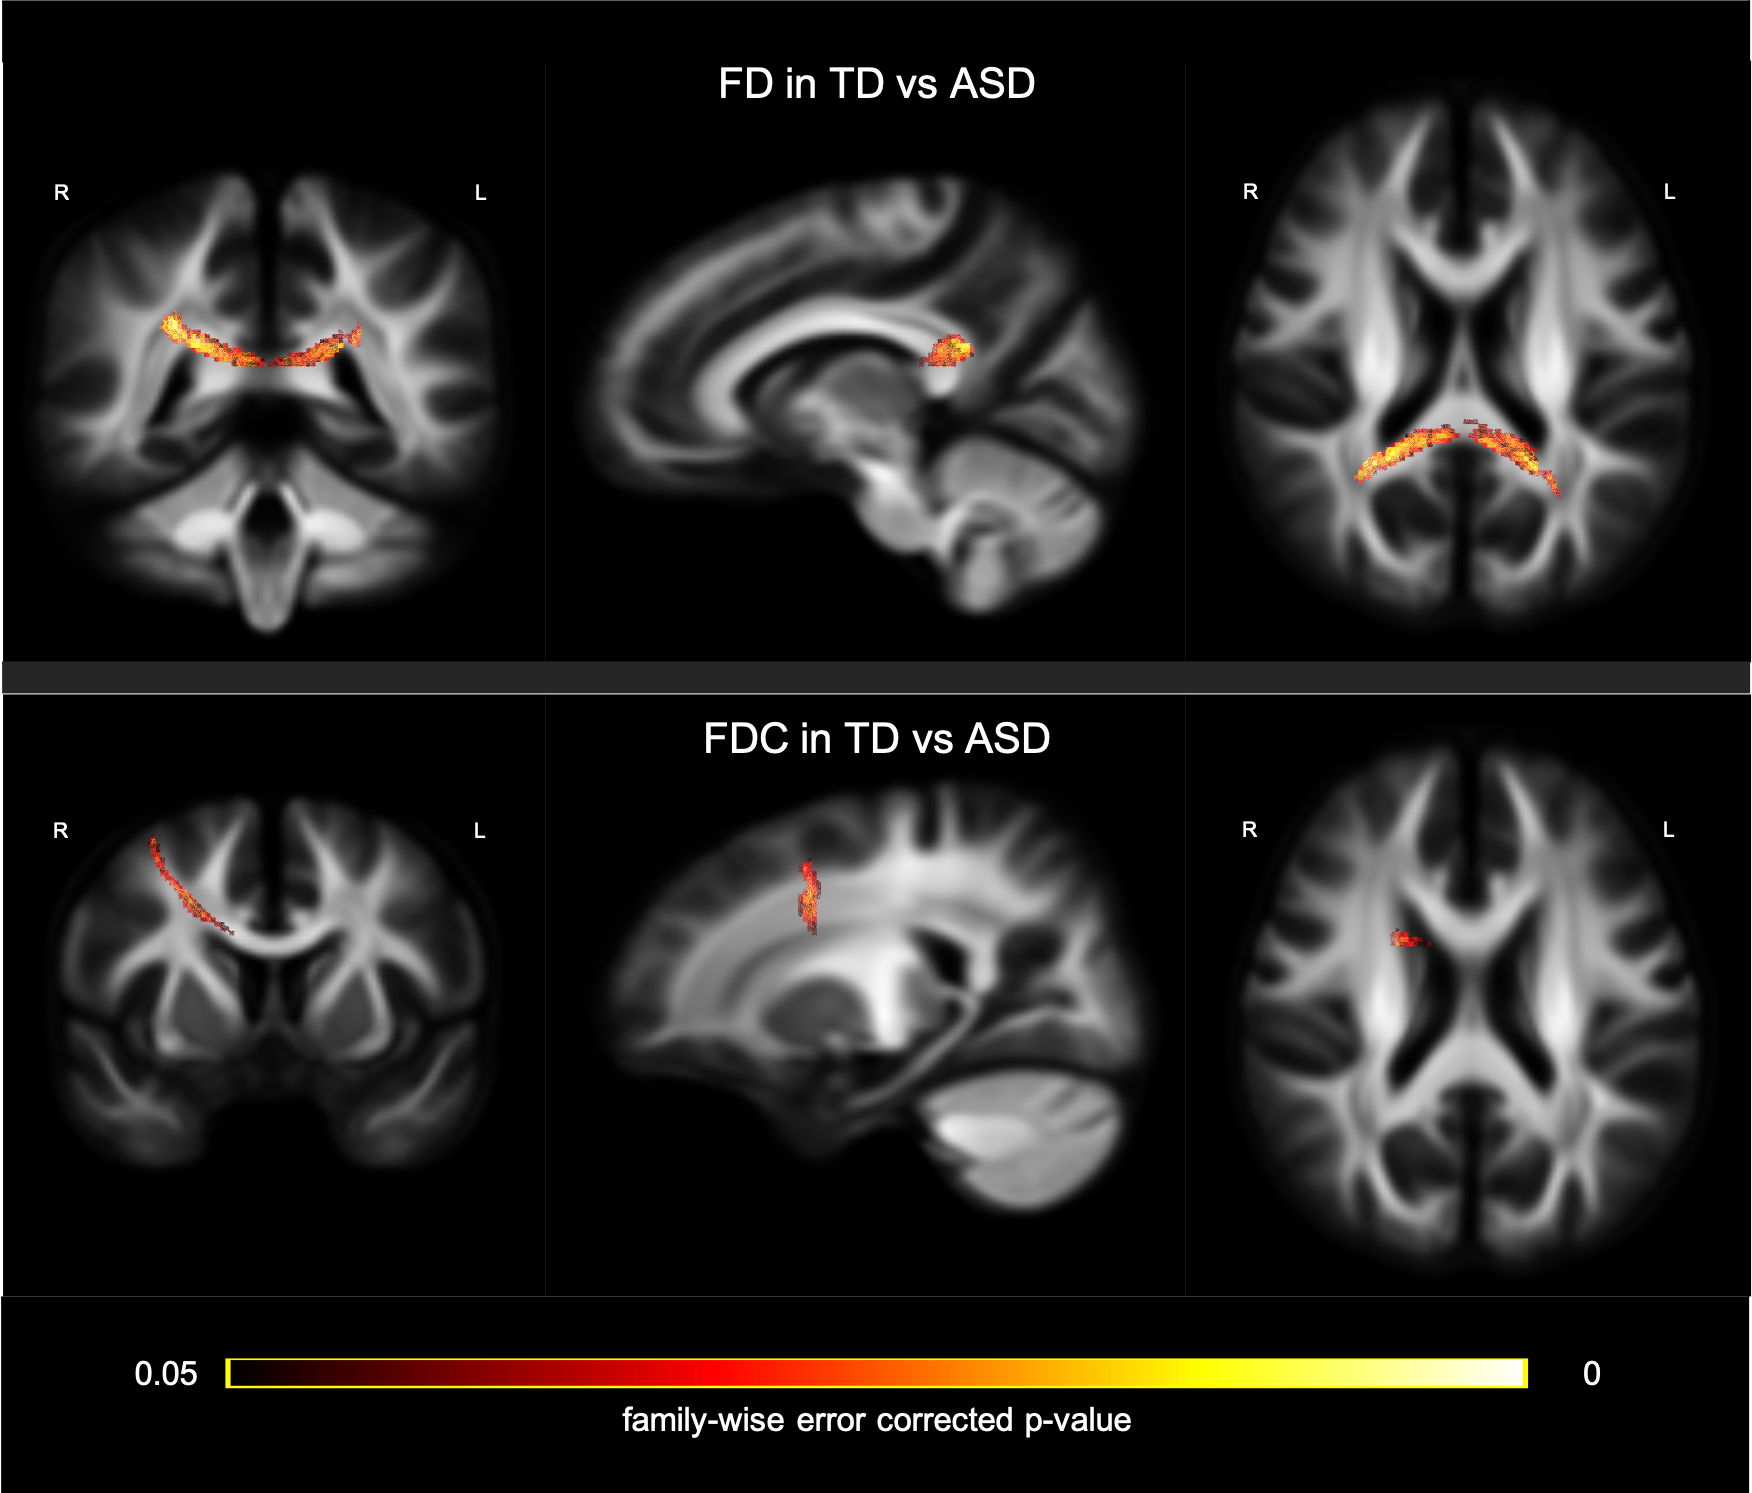
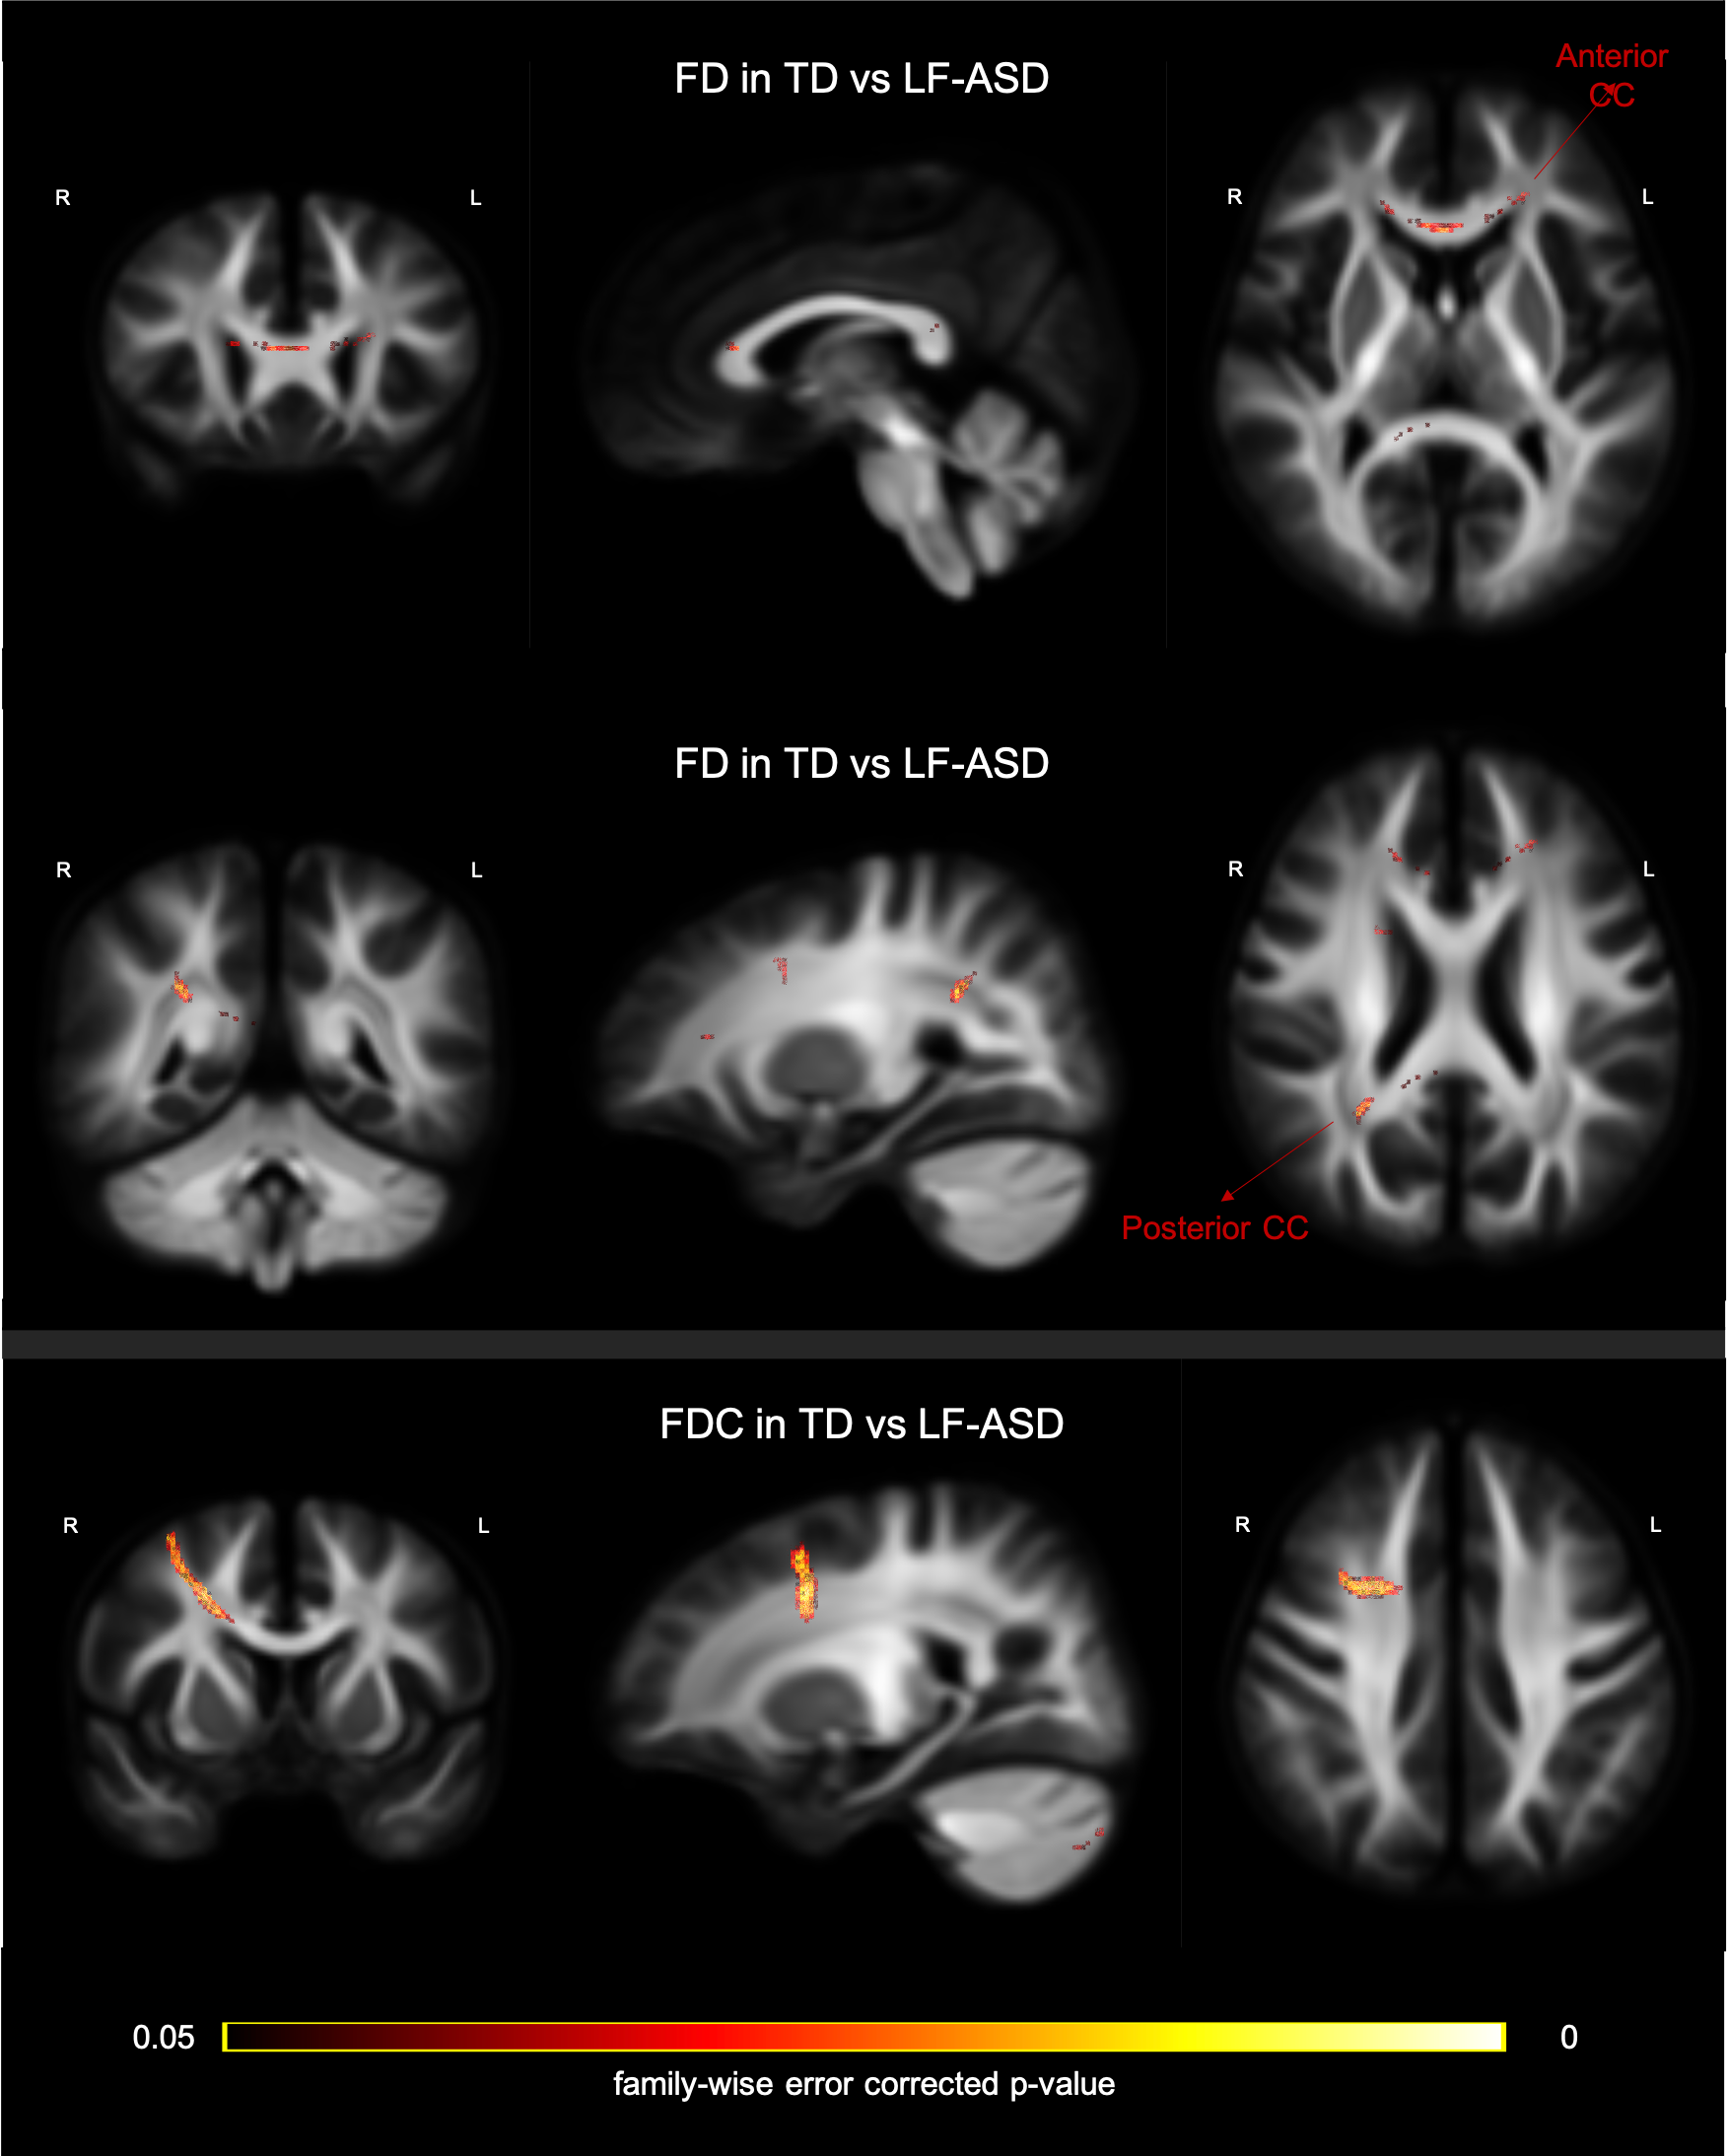
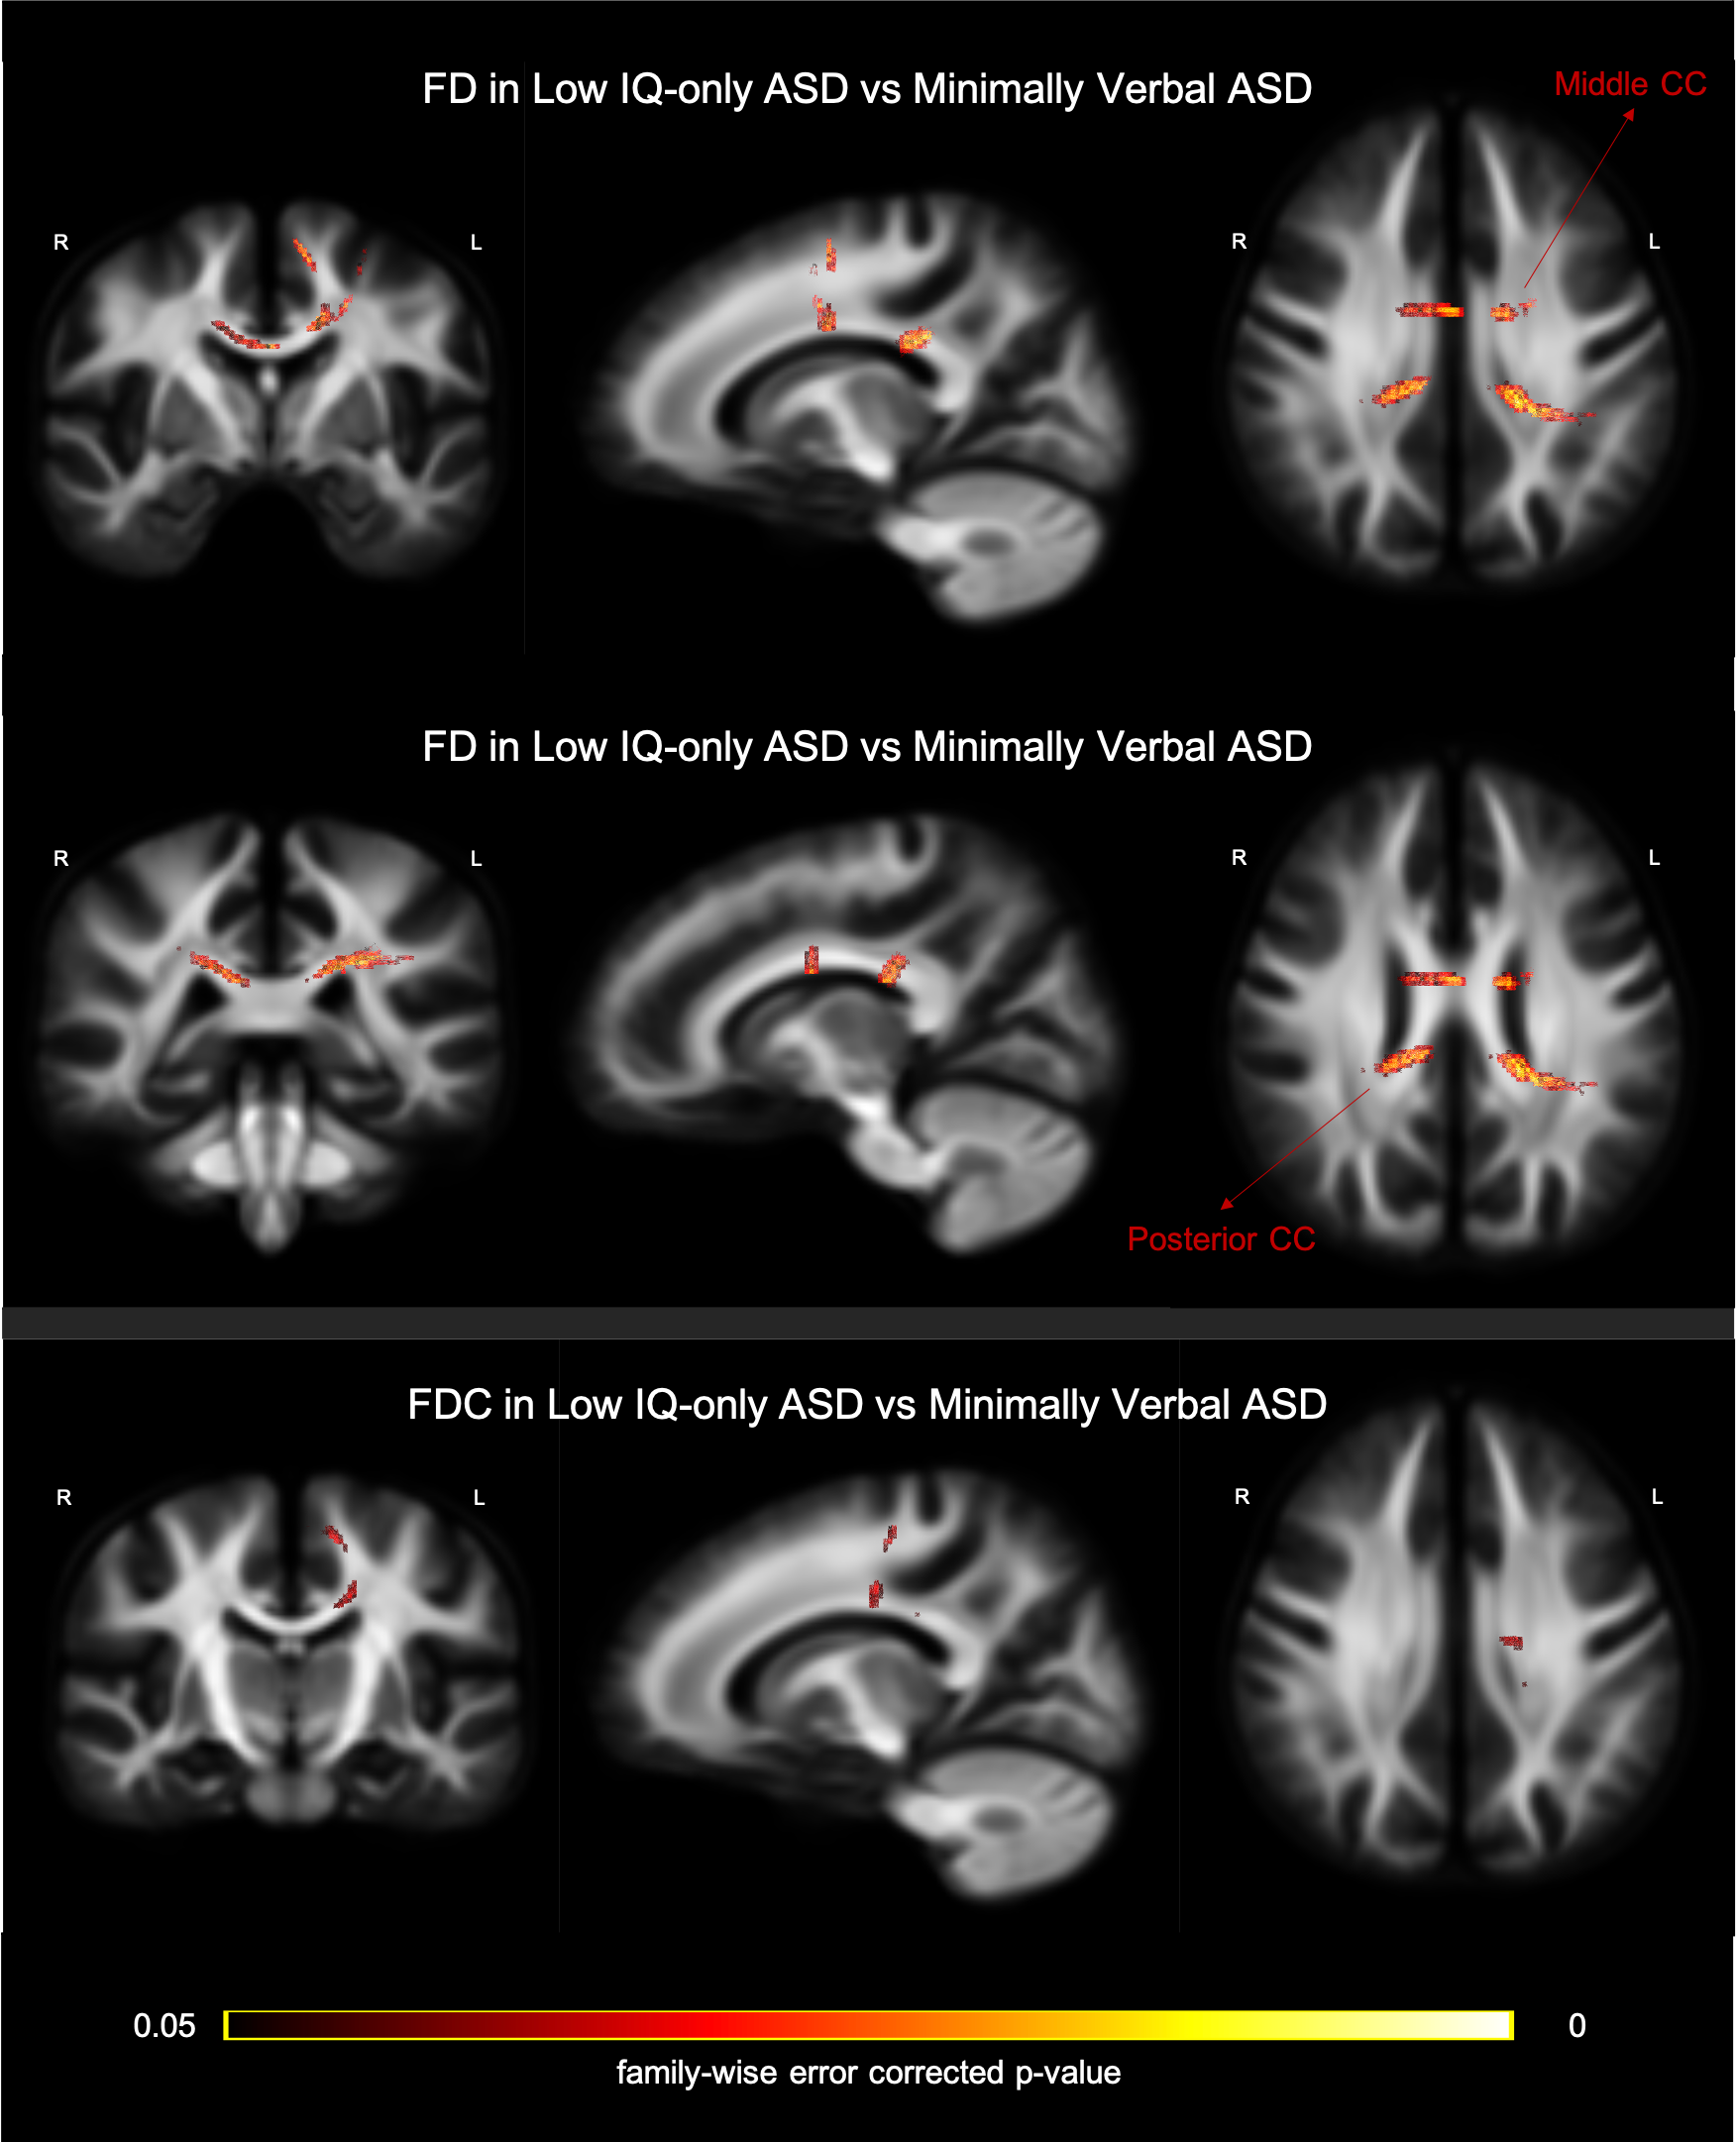
Two-sample t-tests were conducted to examine the between-group disparity, controlling for gender, age, medication status, intracranial volume, and head motion. In the contrast between TD and ASD (whole sample), we observed a significant cluster in the splenium of CC showing larger FD in the TD group (Figure 2; top row). Further, a cluster in the CC connecting bilateral premotor cortex, showed significantly greater FDC in TD than ASD group (Figure 2; bottom row). The comparison between TD and LF-ASD subgroup identified significantly larger FD in both anterior (connecting prefrontal cortex) and posterior (part of the isthmus-splenium) CC (upper and middle rows in Figure 3), as well as a significant cluster of the anterior CC (connecting bilateral premotor cortex, largely overlapping with the cluster precedingly reported) showing greater FDC (Figure 3; bottom row), in TD relative to LF-ASD. Within the LF-ASD group, the low IQ-only subgroup, relative to the minimally verbal subgroup, showed greater FD in the right beginning part of isthmus-splenium of CC (Figure 4; middle row), and had both greater FD and FDC in the section CC connecting bilateral sensorimotor areas and ASDs (Figure 4; upper and bottom rows). There existed no statistically significant differences in regional FD or FDC levels between TD and HF-ASD, or between HF-ASD and LF-ASD.Discussion & Conclusion
As the first study to leverage FBA to investigating ASD cohort inclusive of low-functioning autistic individuals with an acceptable sample size, we found reduced FD of fixels in the splenium of the CC in individuals with ASD, largely consistent with those found in the previous FBA studies6,7, but with larger effect sizes and involved spatial extents. Nonetheless, when we specifically took IQ/adaptive function into account, our data suggest that this ASD-associated alteration appears to be mainly driven by those autistic individuals with developmental disabilities. Autistic people with and without developmental disabilities did not show any differences in fibre microstructure, which might be confounded by the wide age range and uneven sex ratio in participants. Our findings suggest that autistic people comorbid with developmental disabilities should not be left out in the current lore. Studies targeted on this population using advanced data processing techniques such as FBA, may bridge some heterogeneity noted in the literature, and shed new light on the dysconnectivity model of ASD.Acknowledgements
This study was supported by the Ministry of Science and Technology, Taiwan (105-2628-B-002-035-MY3 and 109-2222-E-182-001-MY3), and the MRI data was acquired at Imaging Center for Integrated Body, Mind and Culture Research, National Taiwan University.References
1. Basser PJ, et al. MR diffusion tensor spectroscopy and imaging. Biophys J. 1994; 66: 259–267.
2. Aoki Y, et al. Comparison of white matter integrity between autism spectrum disorder subjects and typically developing individuals: a meta-analysis of diffusion tensor imaging tractography studies. Mol Autism. 2013; 4: 25.
3. Tournier JD, et al. Diffusion tensor imaging and beyond. Magn Reson Med. 2011; 65: 1532–1556.
4. Raffelt DA, et al. Investigating white matter fibre density and morphology using fixel-based analysis. Neuroimage. 2017; 144: 58–73.
5. Mito R, et al. Fibre-specific white matter reductions in Alzheimer’s disease and mild cognitive impairment. Brain. 2018; 141: 888–902.
6. Dimond D, et al. Reduced White Matter Fiber Density in Autism Spectrum Disorder. Cereb Cortex. 2019; 29(4): 1778–1788.
7. Kirkovski M, et al. Fixel Based Analysis Reveals Atypical White Matter Micro- and Macrostructure in Adults With Autism Spectrum Disorder: An Investigation of the Role of Biological Sex. Front Integr Neurosci. 2020; 14: 40.
8. Barth M et al. Simultaneous multislice (SMS) imaging techniques. Magn Reson Med. 2016; 75: 63–81.
9. Veraart J, et al. Diffusion MRI noise mapping using random matrix theory. Magn Reson Med. 2016; 76: 1582–93.
10. Kellner E, et al. Gibbs-ringing artifact removal based on local subvoxel-shifts. Magn Reson Med. 2016; 76: 1574–1581.
11. Andersson JLR and Sotiropoulos SN. An integrated approach to correction for off-resonance effects and subject movement in diffusion MR imaging. NeuroImage. 2016; 125: 1063–1078.
12. Andersson JLR, et al. Towards a comprehensive framework for movement and distortion correction of diffusion MR images: Within volume movement. NeuroImage. 2017; 152: 450–466.
13. Andersson JLR, et al. Susceptibility-induced distortion that varies due to motion: Correction in diffusion MR without acquiring additional data. NeuroImage. 2018; 171: 277–295.
14. Tustison N, et al. N4ITK: Improved N3 Bias Correction. IEEE Trans on Medical Imaging. 2010; 29: 1310–1320.
15. Jeurissen B, et al. Multi-tissue constrained spherical deconvolution for improved analysis of multi-shell diffusion MRI data. Neuroimage. 2014; 103: 411–426.
16. Raffelt DA, et al. Connectivity-based fixel enhancement: Whole-brain statistical analysis of diffusion MRI measures in the presence of crossing fibres. Neuroimage. 2015; 117: 40–55.
17. Tournier JD, et al. MRtrix3: A fast, flexible and open software framework for medical image processing and visualisation. NeuroImage. 2019; 202: 116–37.
Figures