0198
Glutamatergic responses to a color-word Stroop task in first-episode schizophrenia: A 7-Tesla functional MRS study1Medical Biophysics, Western University, London, ON, Canada, 2Neuroscience, Western University, London, ON, Canada, 3Psychiatry, Dalhousie University, Halifax, NS, Canada, 4Schulich School of Medicine and Dentistry, Western University, London, ON, Canada, 5Psychiatry, Western University, London, ON, Canada, 6Robarts Research Institute, London, ON, Canada, 7Lawson Health Research Institute, London, ON, Canada
Synopsis
Dynamic behaviour of neurometabolites require tools that are able to capture such temporal information. Functional MRS can track metabolite level changes in response to external stimuli, providing valuable observations for illnesses such as schizophrenia. This study employed a 7-Tesla fMRS technique to study the anterior cingulate cortex glutamate, glutamine, and glutathione dynamic behaviours in 38 first-episode schizophrenia and 27 healthy controls. In response to a color-word Stroop task, significant differences were observed in resting and dynamic glutathione levels, supporting abnormal neurometabolite behaviour or circuitry in the early stages of schizophrenia.
Summary of Main Findings
Functional MRS at 7T using a color-word Stroop stimulus reveals differences in glutathione dynamics between first-episode schizophrenia and healthy control groups in the anterior cingulate cortex.Introduction
Glutamatergic abnormalities are suspected to explain the full range of schizophrenia symptoms observed. Glutamatergic abnormalities of resting and longitudinal studies have been interpreted in terms of abnormalities in neurotransmission. If metabolite levels truly reflect neurotransmission, they would be expected to respond to prospectively designed stimuli paradigms, possibly through changes in excitation/inhibition balance at the bulk tissue (voxel) level. However, the brain’s dynamic behaviour is still not prospectively captured by traditional MRS techniques. Adding to current understanding of glutamate, glutamine, and glutathione levels in schizophrenia, this work employed a functional MRS (fMRS) technique to prospectively investigate and record metabolite concentration dynamics in response to cognitive stimuli.Methods
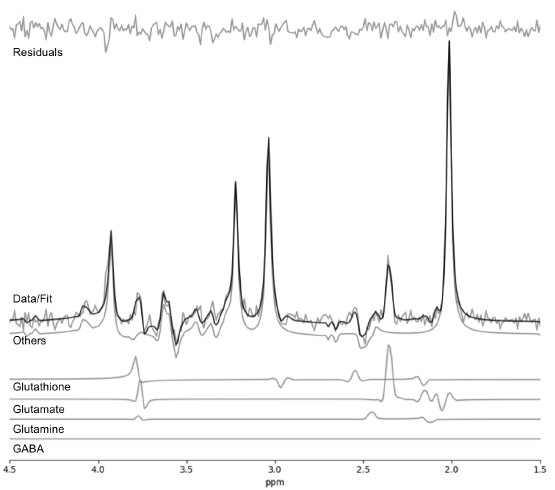
Measurements were acquired on a Siemens MAGNETOM 7-Tesla MRI scanner using an 8- channel transmit/ 32-channel receive, head-only, radiofrequency coil at the Centre for Functional and Metabolic Mapping at Western University. Brain glutamate, glutamine, and glutathione dynamics were measured using a proton fMRS (1H-fMRS) semi-LASER pulse sequence (TR = 7500 ms, TE = 100 ms, 128 averages) with a 20 x 20 x 20 mm3 MRS voxel placed in the dorsal anterior cingulate cortex. This study consisted of 38 first-episode schizophrenia (FES) and 27 patient-matched healthy controls (HC). The functional component used during the fMRS acquisition was a color-word Stroop task consisting of four periods of four minutes (rest, active, recovery 1, recovery 2). A single spectrum was produced for each period by averaging 32 transient phase and frequency corrected spectra. Averaged spectra underwent post-processing using QUECC(1) and were then fitted using a Levenberg-Marquardt minimization algorithm to echo-time-specific prior knowledge templates (Figure 1). Lastly, metabolite quantification was performed using the fitted output spectra. All post-processing, fitting, and quantification were completed using Fitman(2) and Barstool(3).Results
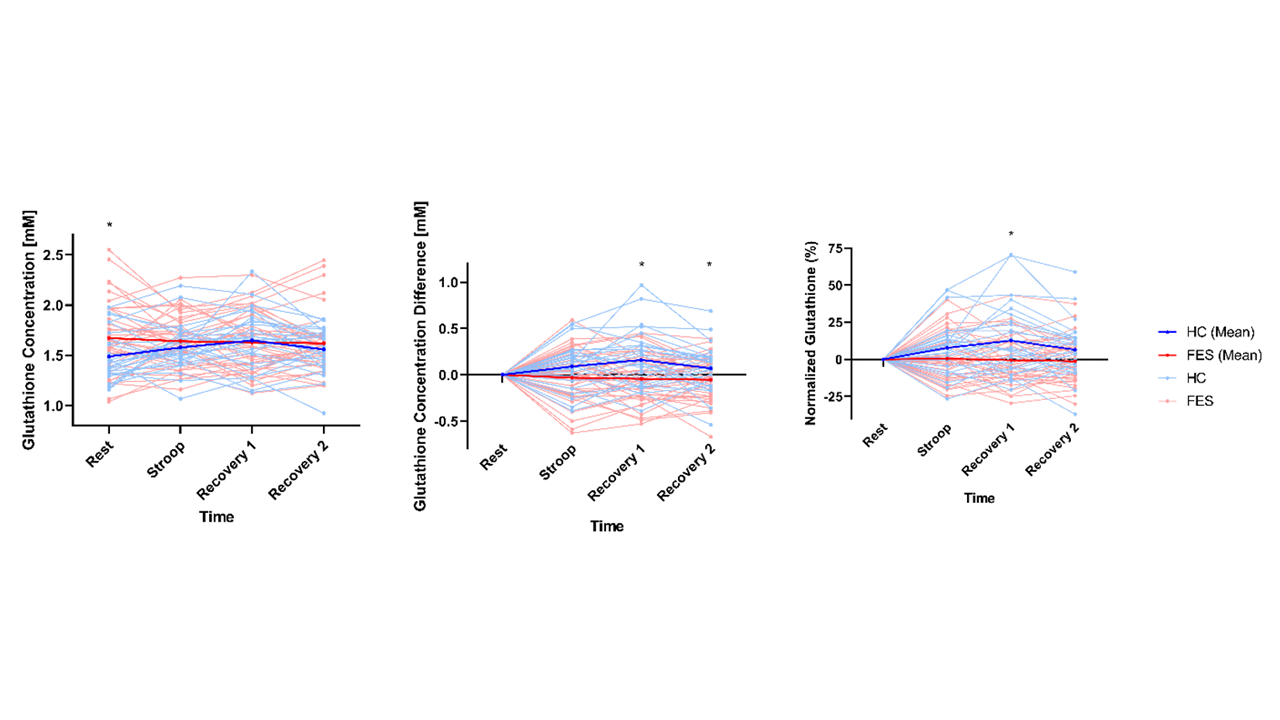
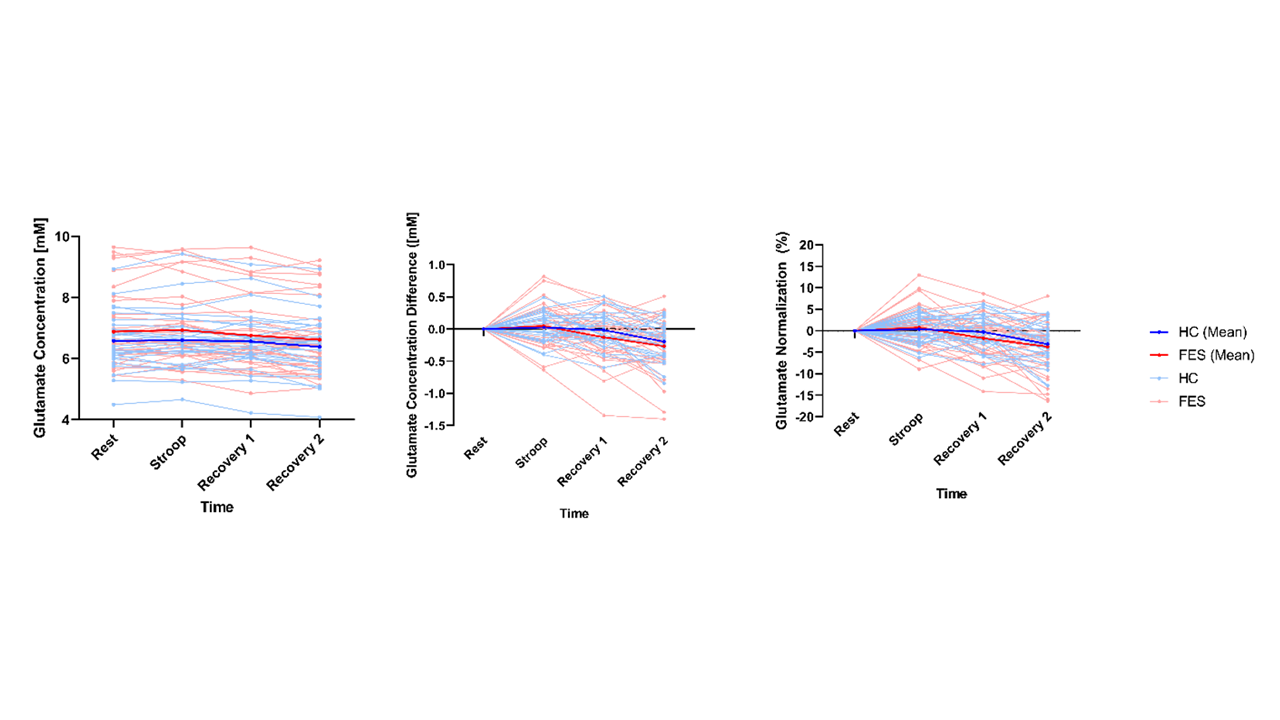
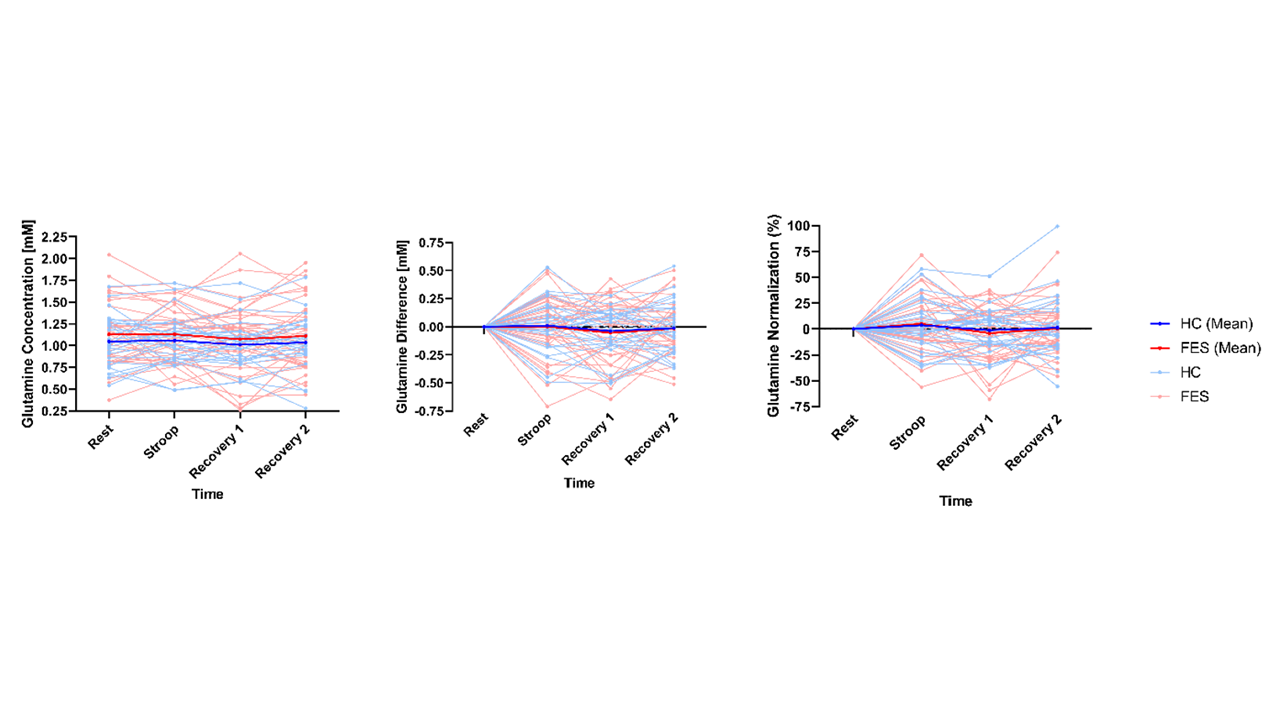
Repeated measures ANOVA revealed a time x diagnosis interaction (F(1,56) = 5.493, p = 0.02) with parameter estimates indicating lower glutathione levels in HC compared to FES at rest (t(58) = -2.247,p = 0.03) (Figure 2). There was a strong trend towards ‘active Stroop – controlled rest’ differences between the two groups (t(63) = 1.863, p = 0.067) and significant differences between FES and HC for the recovery 1 (t(63) = 2.731, p = 0.009) and recovery 2 (t(63) = 2.011, p = 0.049) period glutathione values relative to their respective baseline measurements. There were no effects of time, diagnosis, and time x diagnosis for glutamate (Figure 3) and glutamine (Figure 4) for both groups. Resting glutamate and glutamine concentrations were not significantly different between the two groups with the percent coefficient of variation ranging between 15-17% for glutamate fMRS periods and 25-35% for glutamine fMRS periods.Discussion
Although no significant difference was observed between HC and FES glutamate and glutamine dynamics, differences in baseline and dynamic glutathione levels reveal potential characteristics of abnormality in FES. Although HC had lower levels of glutathione at baseline measurements, a quick increase in concentration was observed indicating a responsive behaviour in glutathione dynamics. However, FES glutathione levels remained relatively consistent despite stimuli presentation. Furthermore, the elevated baseline glutathione levels in FES may indicate pre-existing oxidative stress with a potential ceiling level that may make it difficult for further increase in levels. The lack of significant findings for glutamate and glutamine dynamics may be due to the amount of variability in measurements.Conclusion
This work demonstrates that fMRS of cognitive tasks can help untangle the interplay between glutamatergic metabolites and oxidative stress during stimulation and how they are affected by schizophrenia. Future work should focus on reducing sources of variability to obtain a better picture of glutamate, glutamine, and glutathione dynamics. The addition of GABA dynamics would also be a great help in revealing excitation/inhibition imbalance.Acknowledgements
No acknowledgement found.References
References
1. Bartha R, Drost DJ, Menon RS, Williamson PC. Spectroscopic lineshape correction by QUECC: Combined QUALITY deconvolution and eddy current correction. Magn Reson Med. 2000; 44(4):641-645. 2. Bartha R, Drost DJ, Williamson PC. Factors affecting the quantification of short echo in vivo 1H MR spectra: prior knowledge, peak elimination, and filtering. NMR Biomed. 1999; 12:205-216.
3. Wong D, MRI Investigations of Metabolic and Structural Brain Changes in Alzheimer’s Disease and Vitamin D Deprivation. 2019. https://ir.uwo.ca/etd/6611.
Figures