0197
Data-driven clustering differentiates subtypes of major depressive disorder with distinct connectivity-symptom association1Department of Radiology, West China Hospital, Sichuan University, Huaxi MR Research Center (HMRRC), Functional and molecular imaging Key Laboratory of Sichuan Province, Chengdu, China, 2Department of Psychiatry, Sichuan University West China Hospital, Chengdu, China
Synopsis
Major depressive disorder (MDD) is a clinically heterogeneous syndrome and commonly co-occur alongside symptoms of other psychiatric domains. It is challenging to identify the correspondence between these clinical heterogeneous and relevant neurobiological substrates and define neurophysiological subtypes of MDD. We used regularized canonical correlation analysis (rCCA) to assess a two-dimensional mapping between the intrinsic connectivity networks (ICNs) and clinical symptoms and thus aid in defined MDD subtypes. We then compared potential symptom severity and neural features alterations between these subtypes and further assess the association between these features.
Purpose
To define neurophysiological subtypes of MDD by an unsupervised approach based on combinations of neuroimaging and clinical data and to explore the specific symptoms which were underlined by distinct network patterns in identified each subtype.Methods
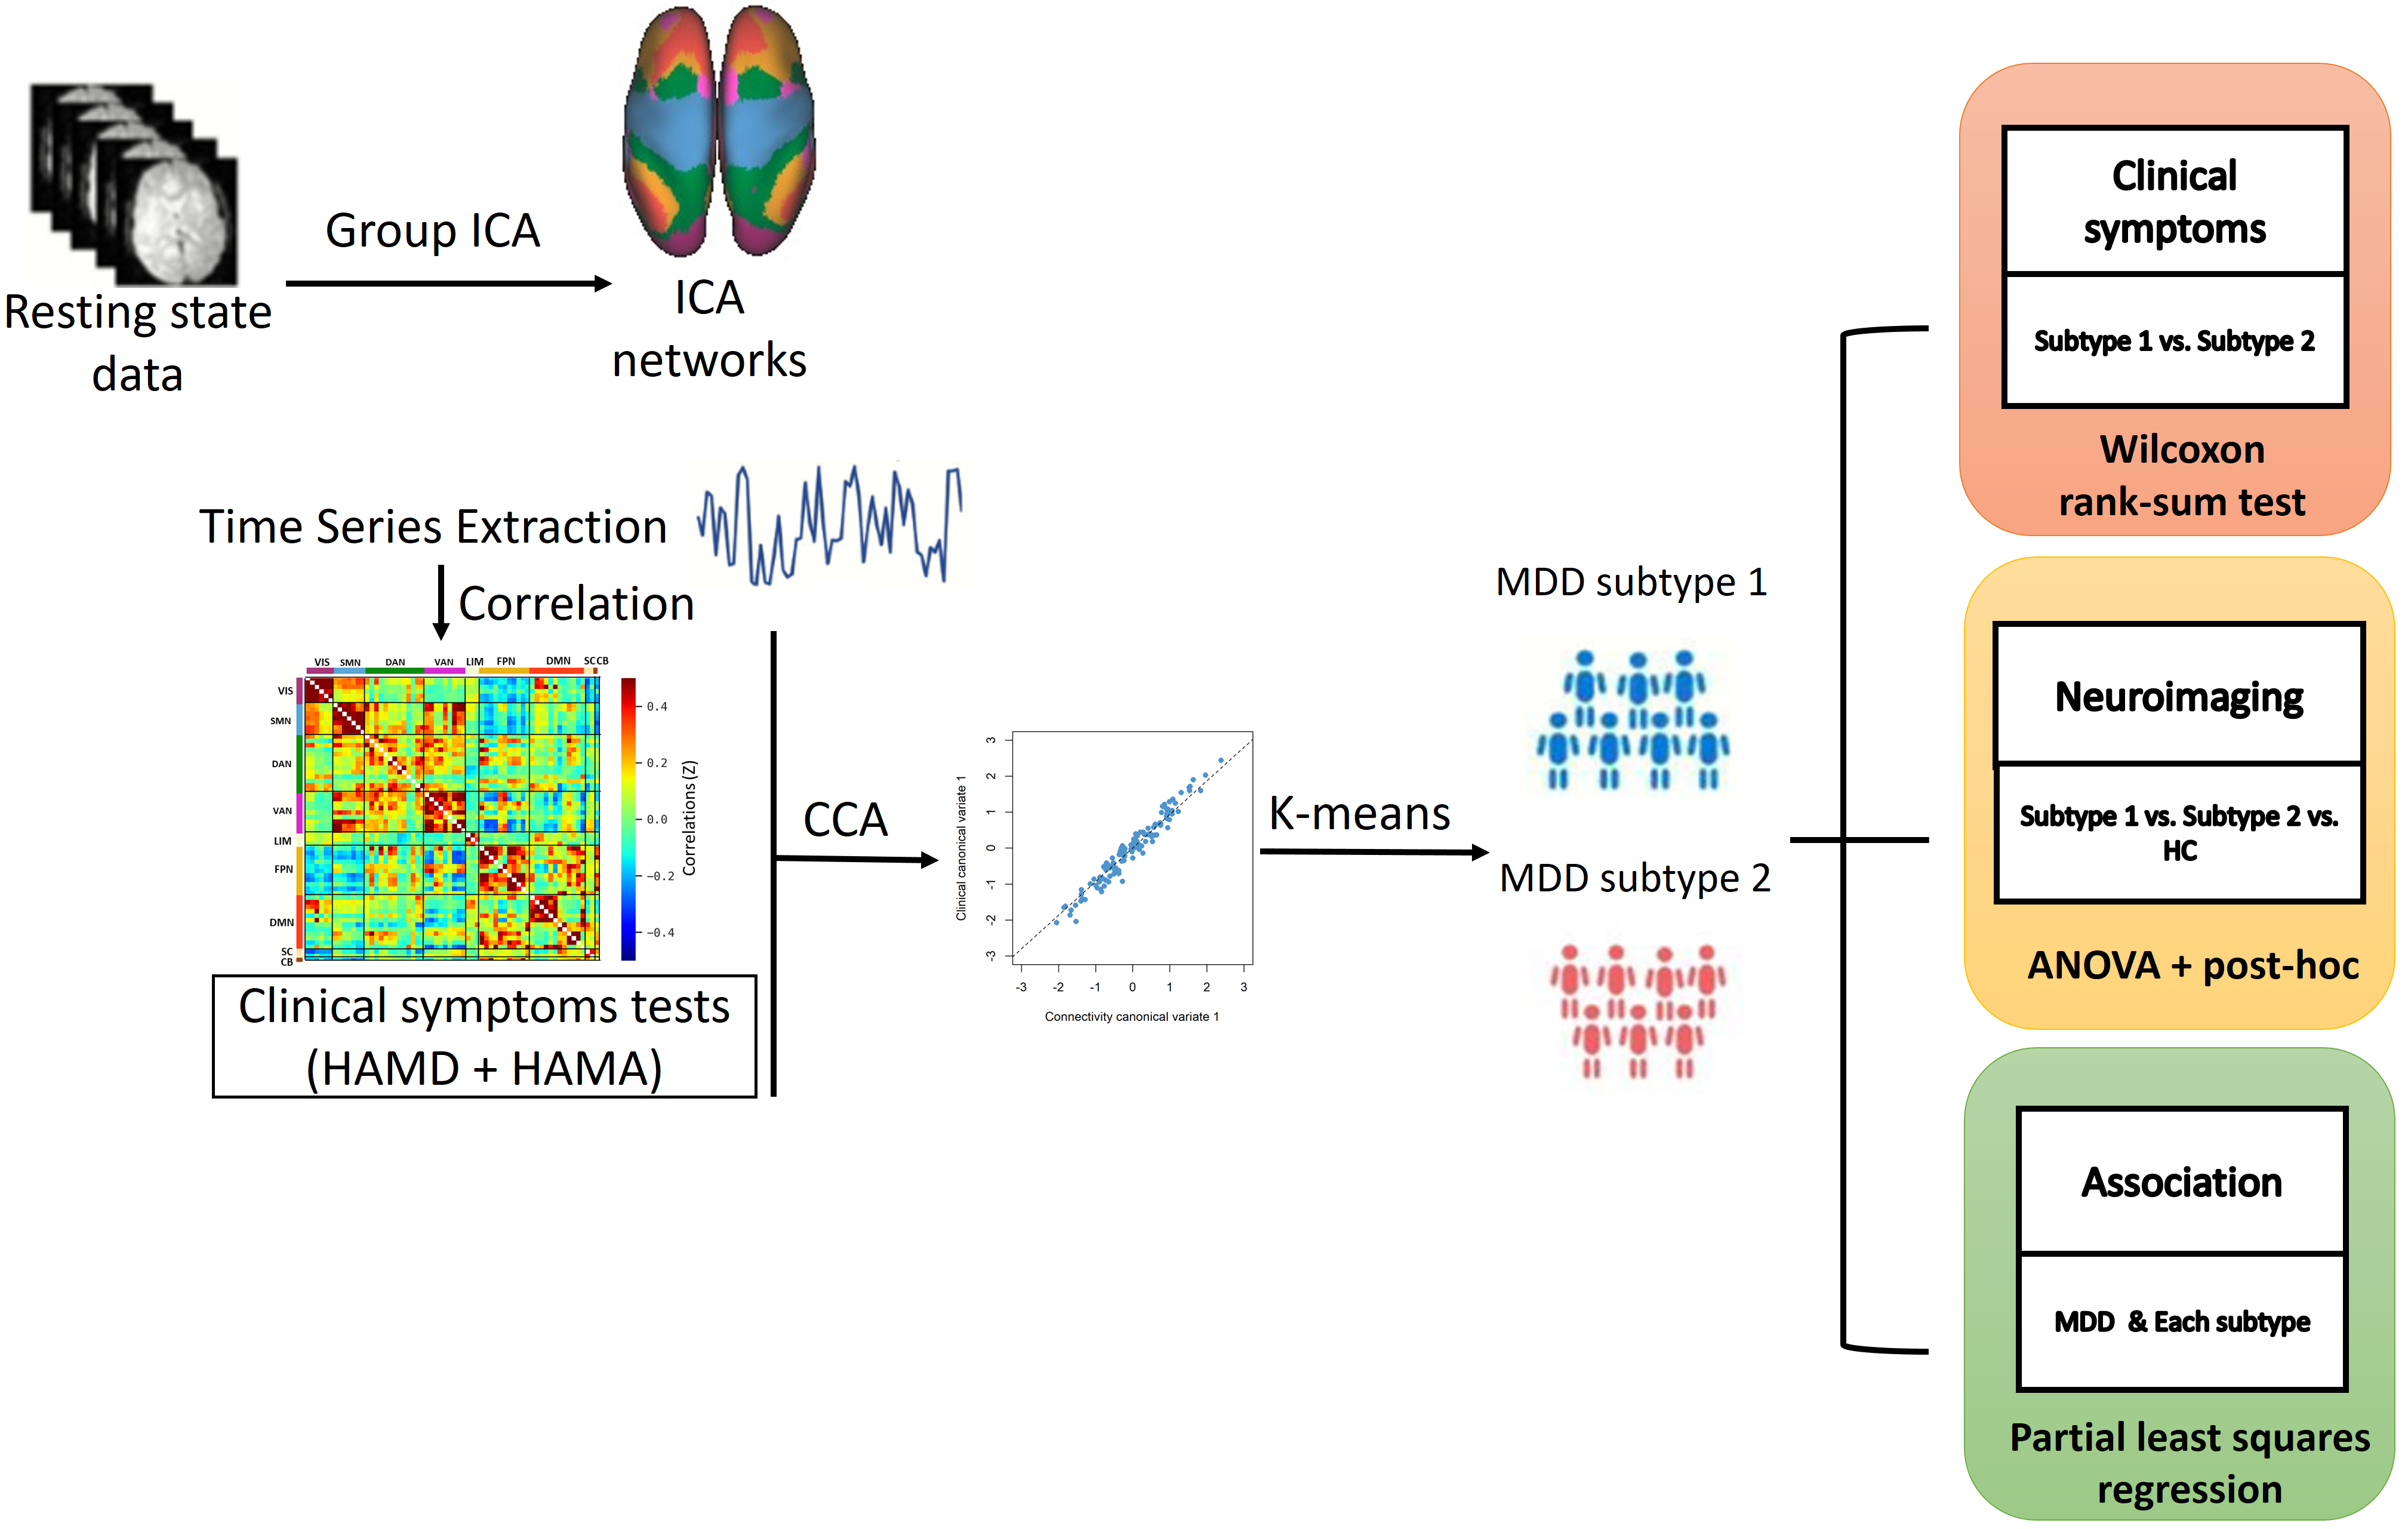
115 medication-naïve adult MDD individuals and 129 matched heathy controls (HCs) were recruited in the present study. A data-driven technique of group spatial ICA was performed using the CONN on the preprocessed images to identify the components of interest. To capture a strong correspondence between neurobiological substrates and symptom features for the next non-supervised clustering, we first used Spearman’s rank correlation coefficients to identify intrinsic connectivity networks (ICNs) that were significantly correlated (P < 0.005) with severity scores for each item of HAMD and HAMA (1). We used regularized canonical correlation analysis (rCCA) to identify the first component mapping relationship between identified ICNs and symptom profiles in MDD. This component was then used in K-means clustering methods to define the distinct biotypes of patients. Moreover, we compared potential symptom severity and neural features alterations between these subtypes and further assess the association between these features. Finally, we assessed whether these distinct ICNs patterns in each group can predict these clinical symptoms in each subtype by a partial linear squares regression (PLSR) analysis, respectively.Results
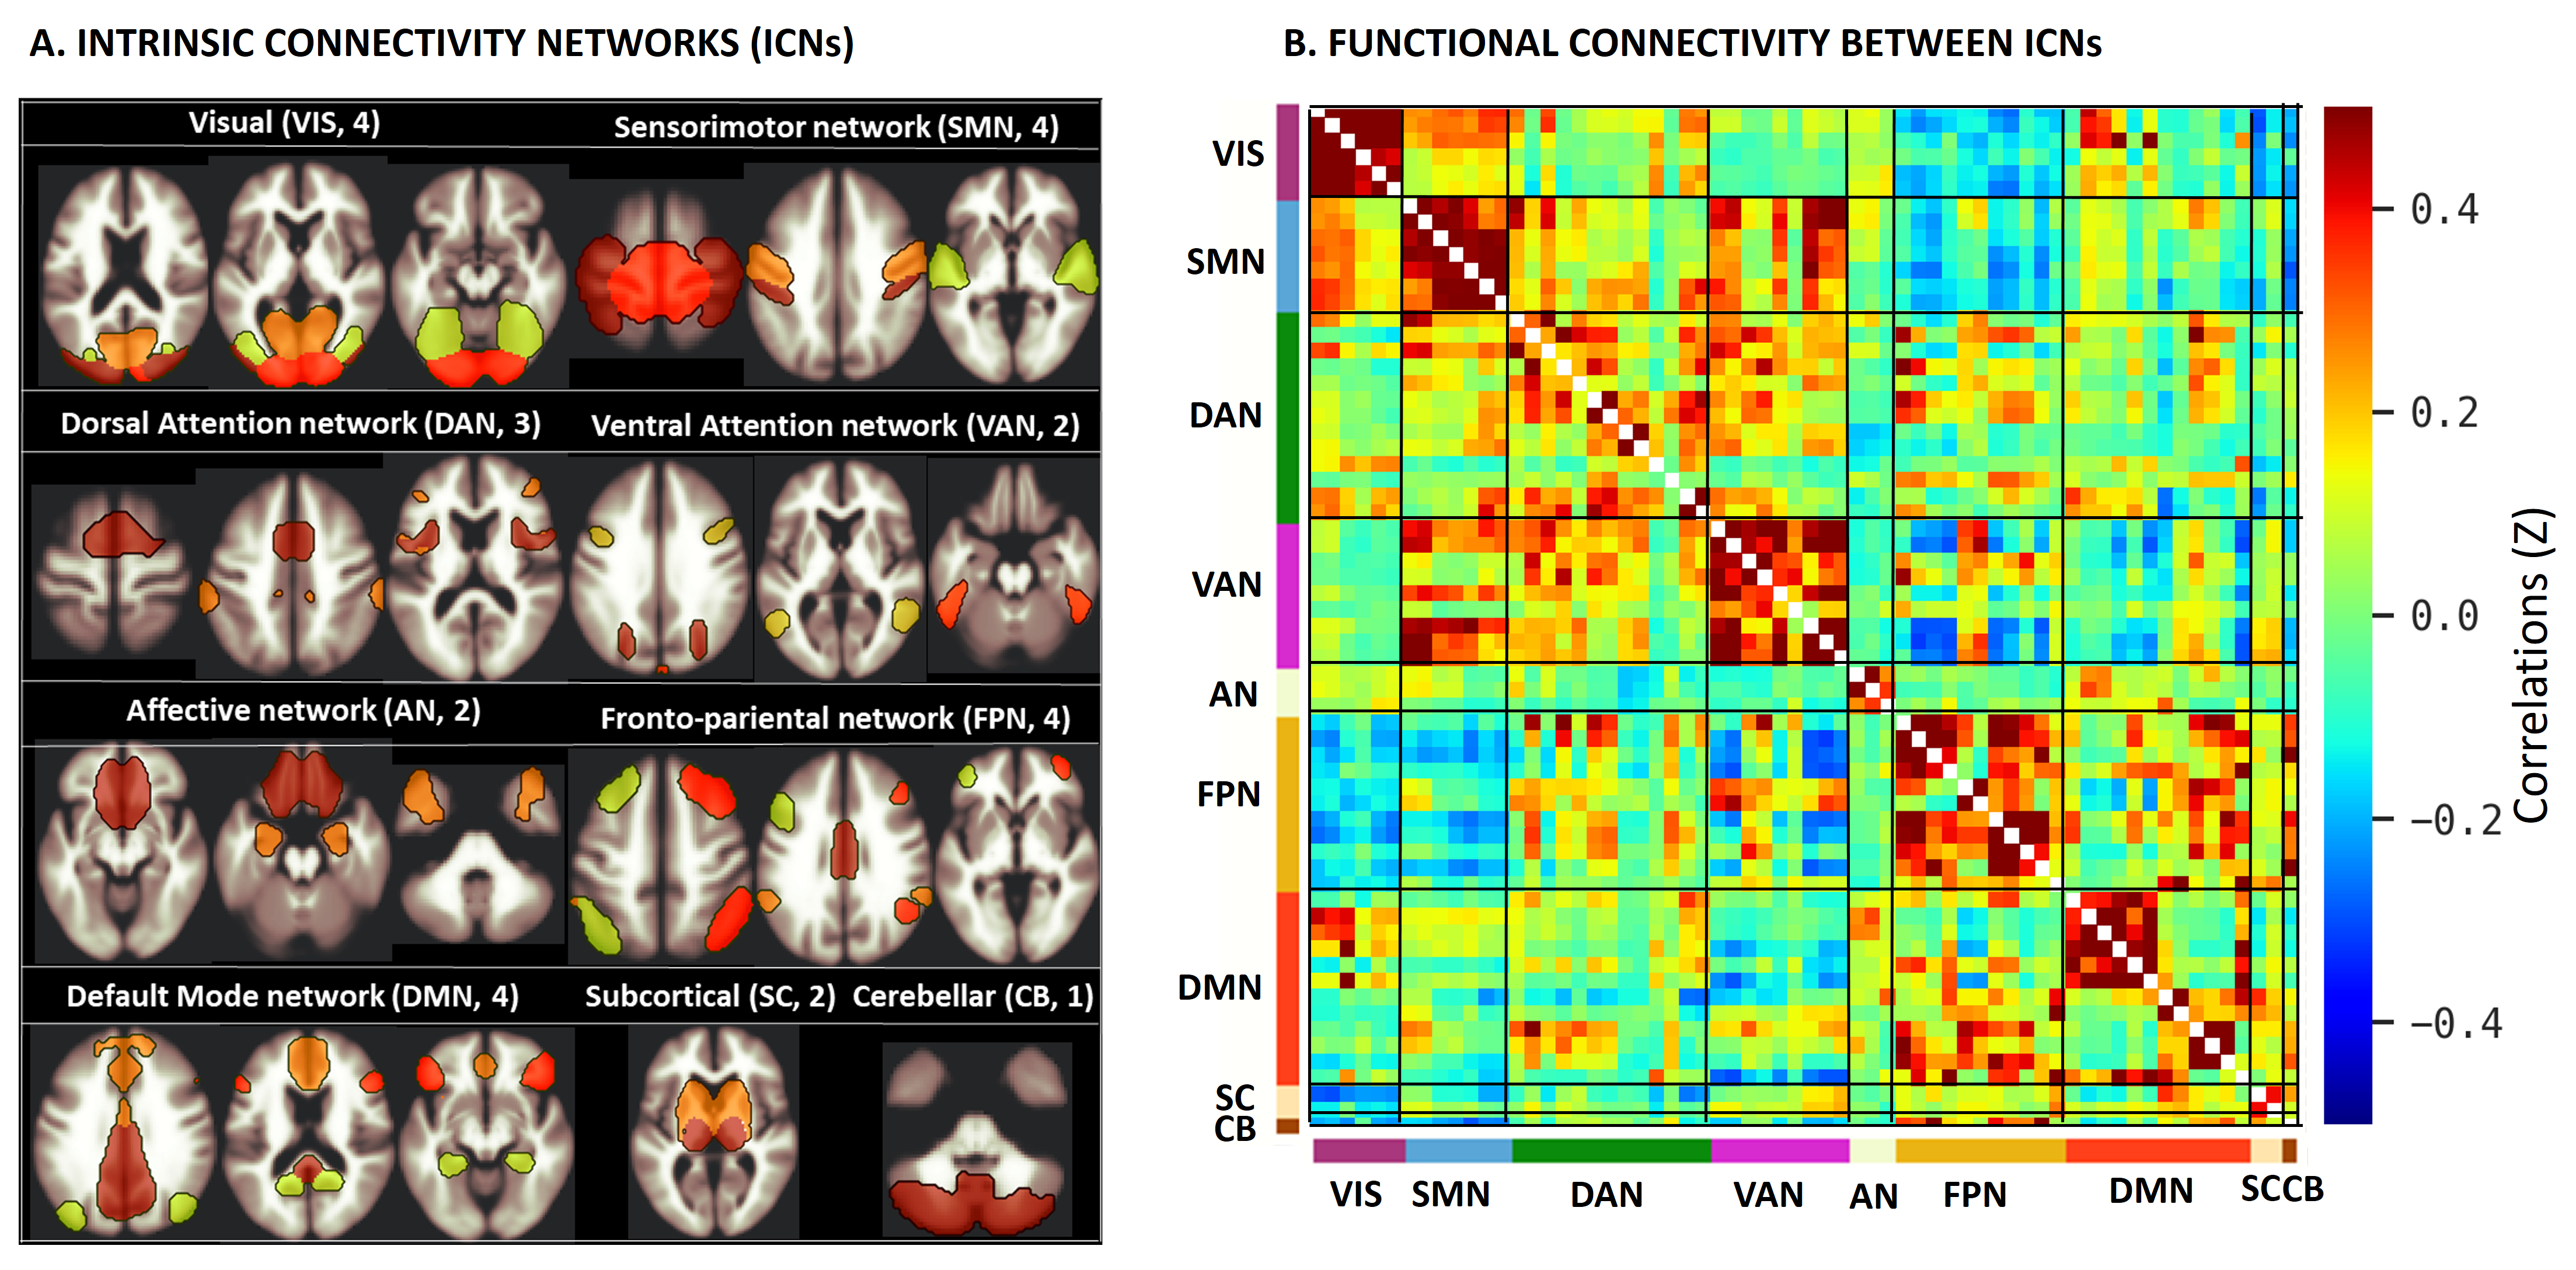
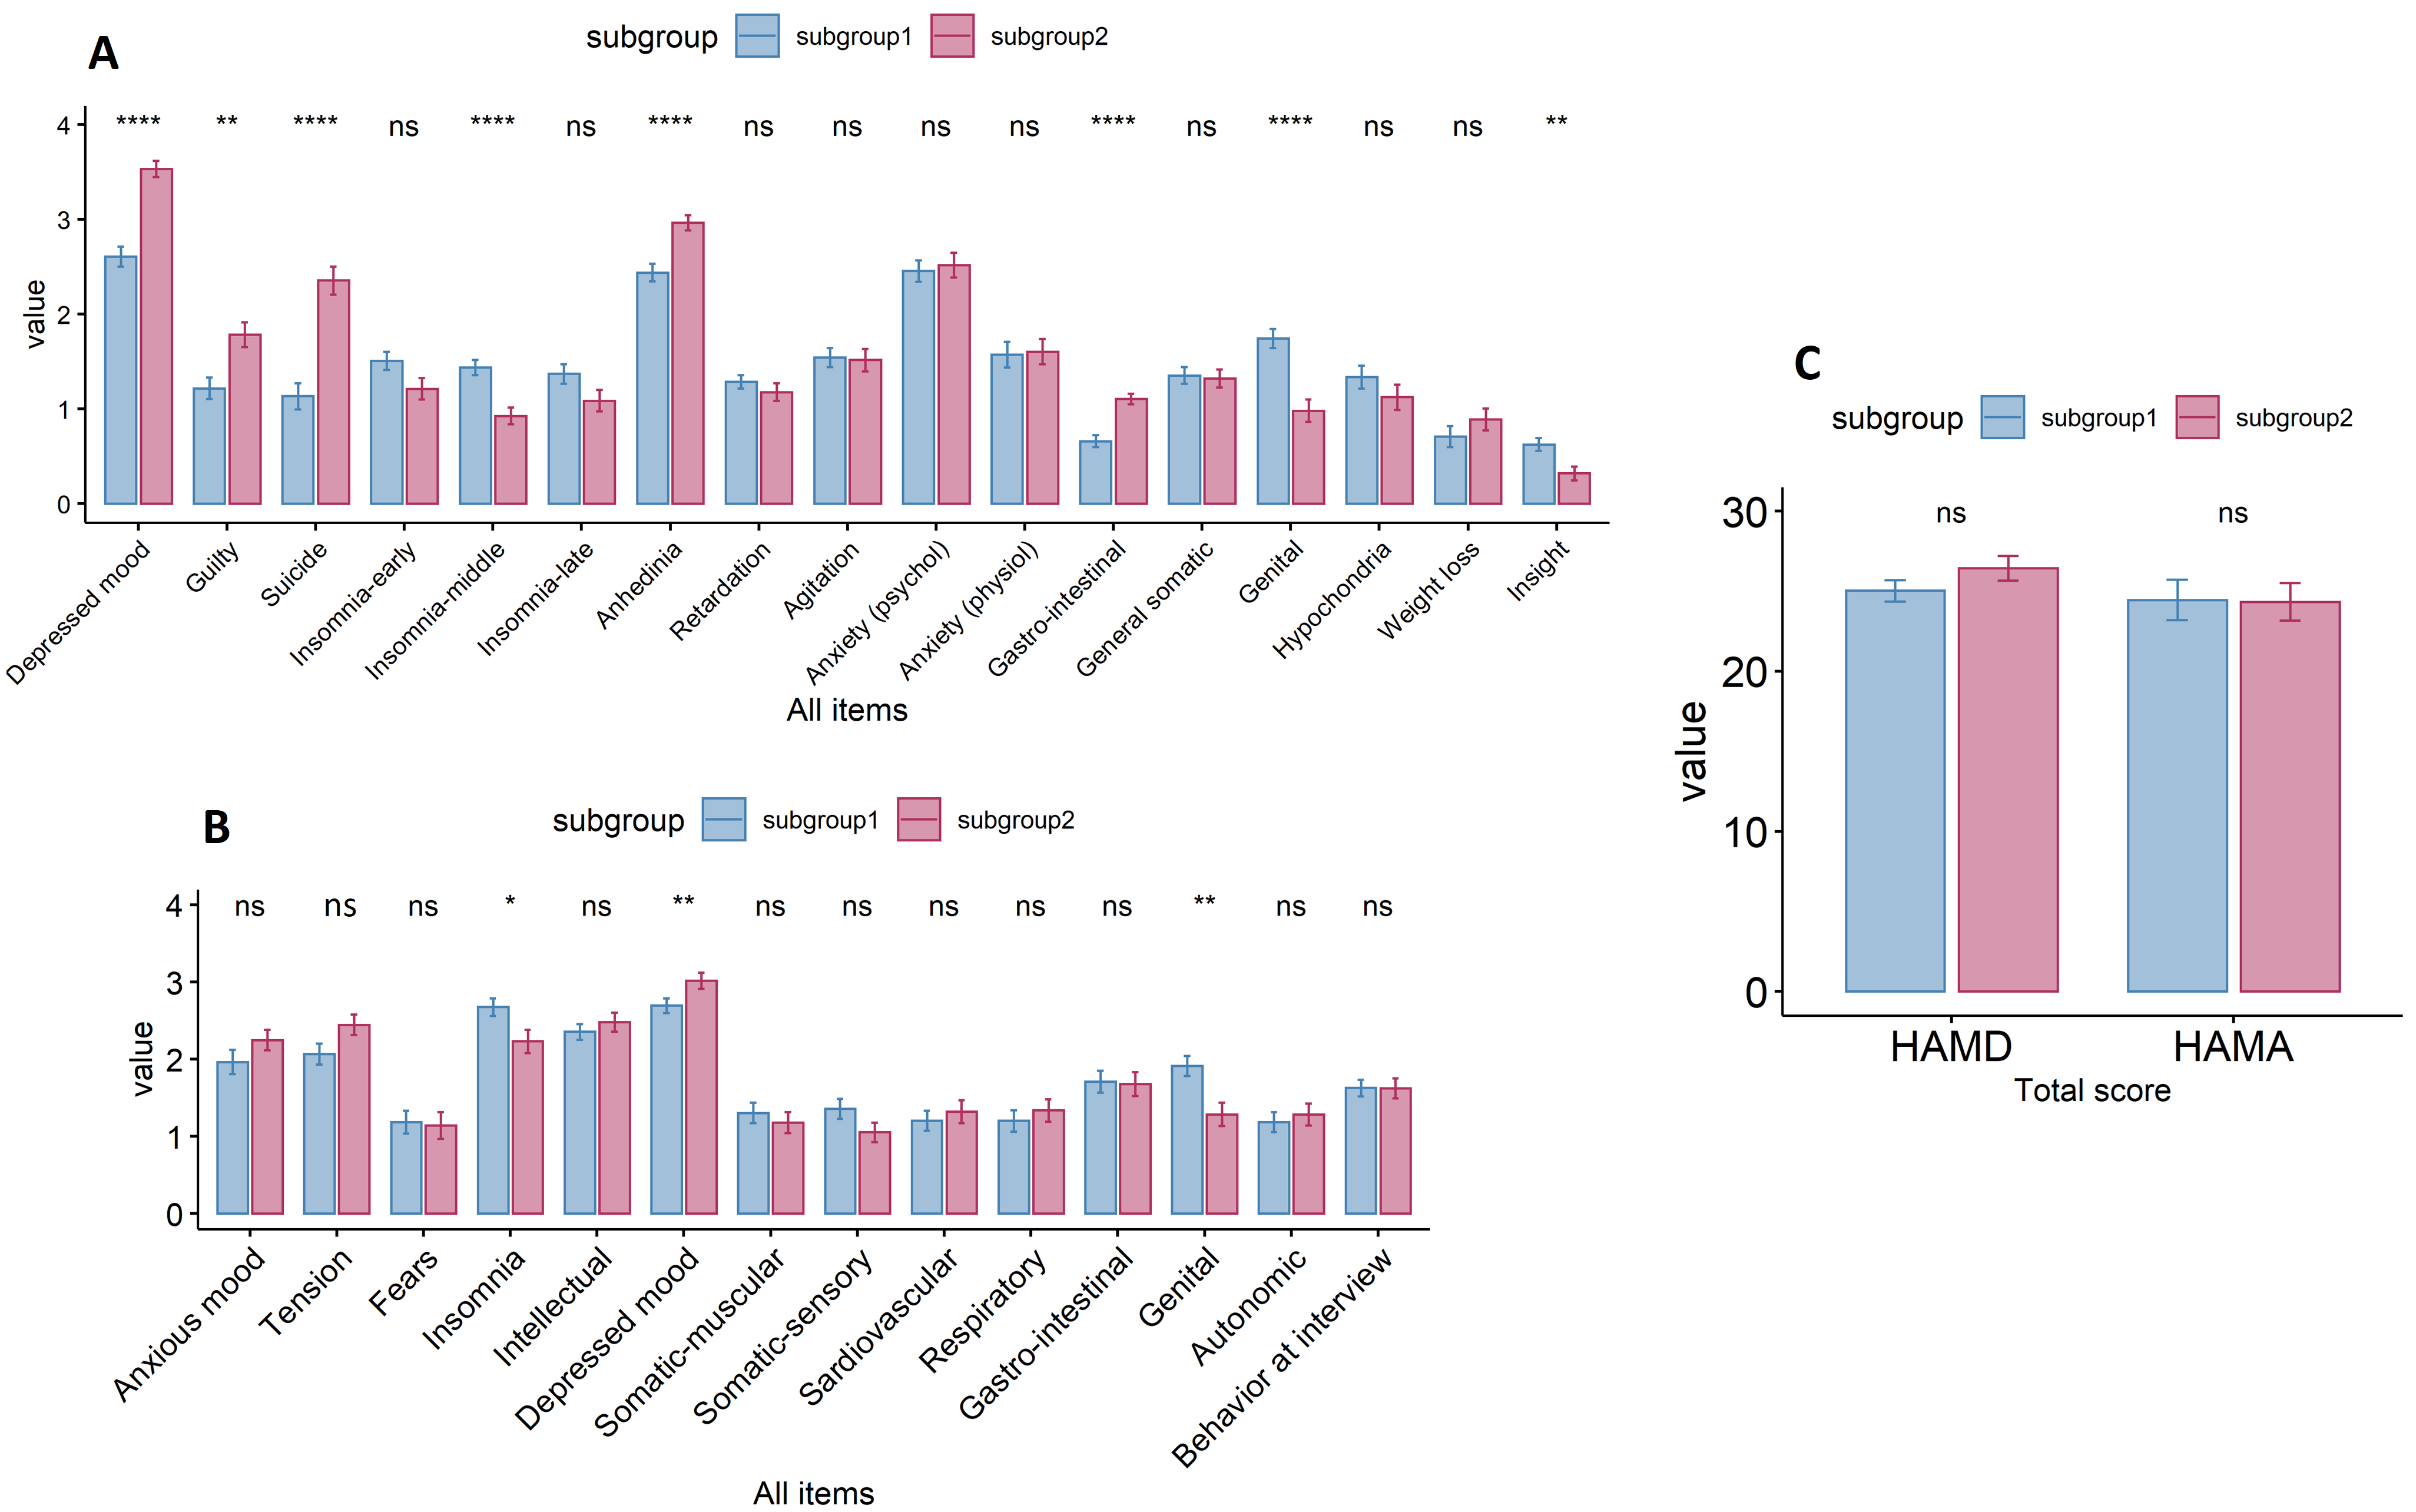
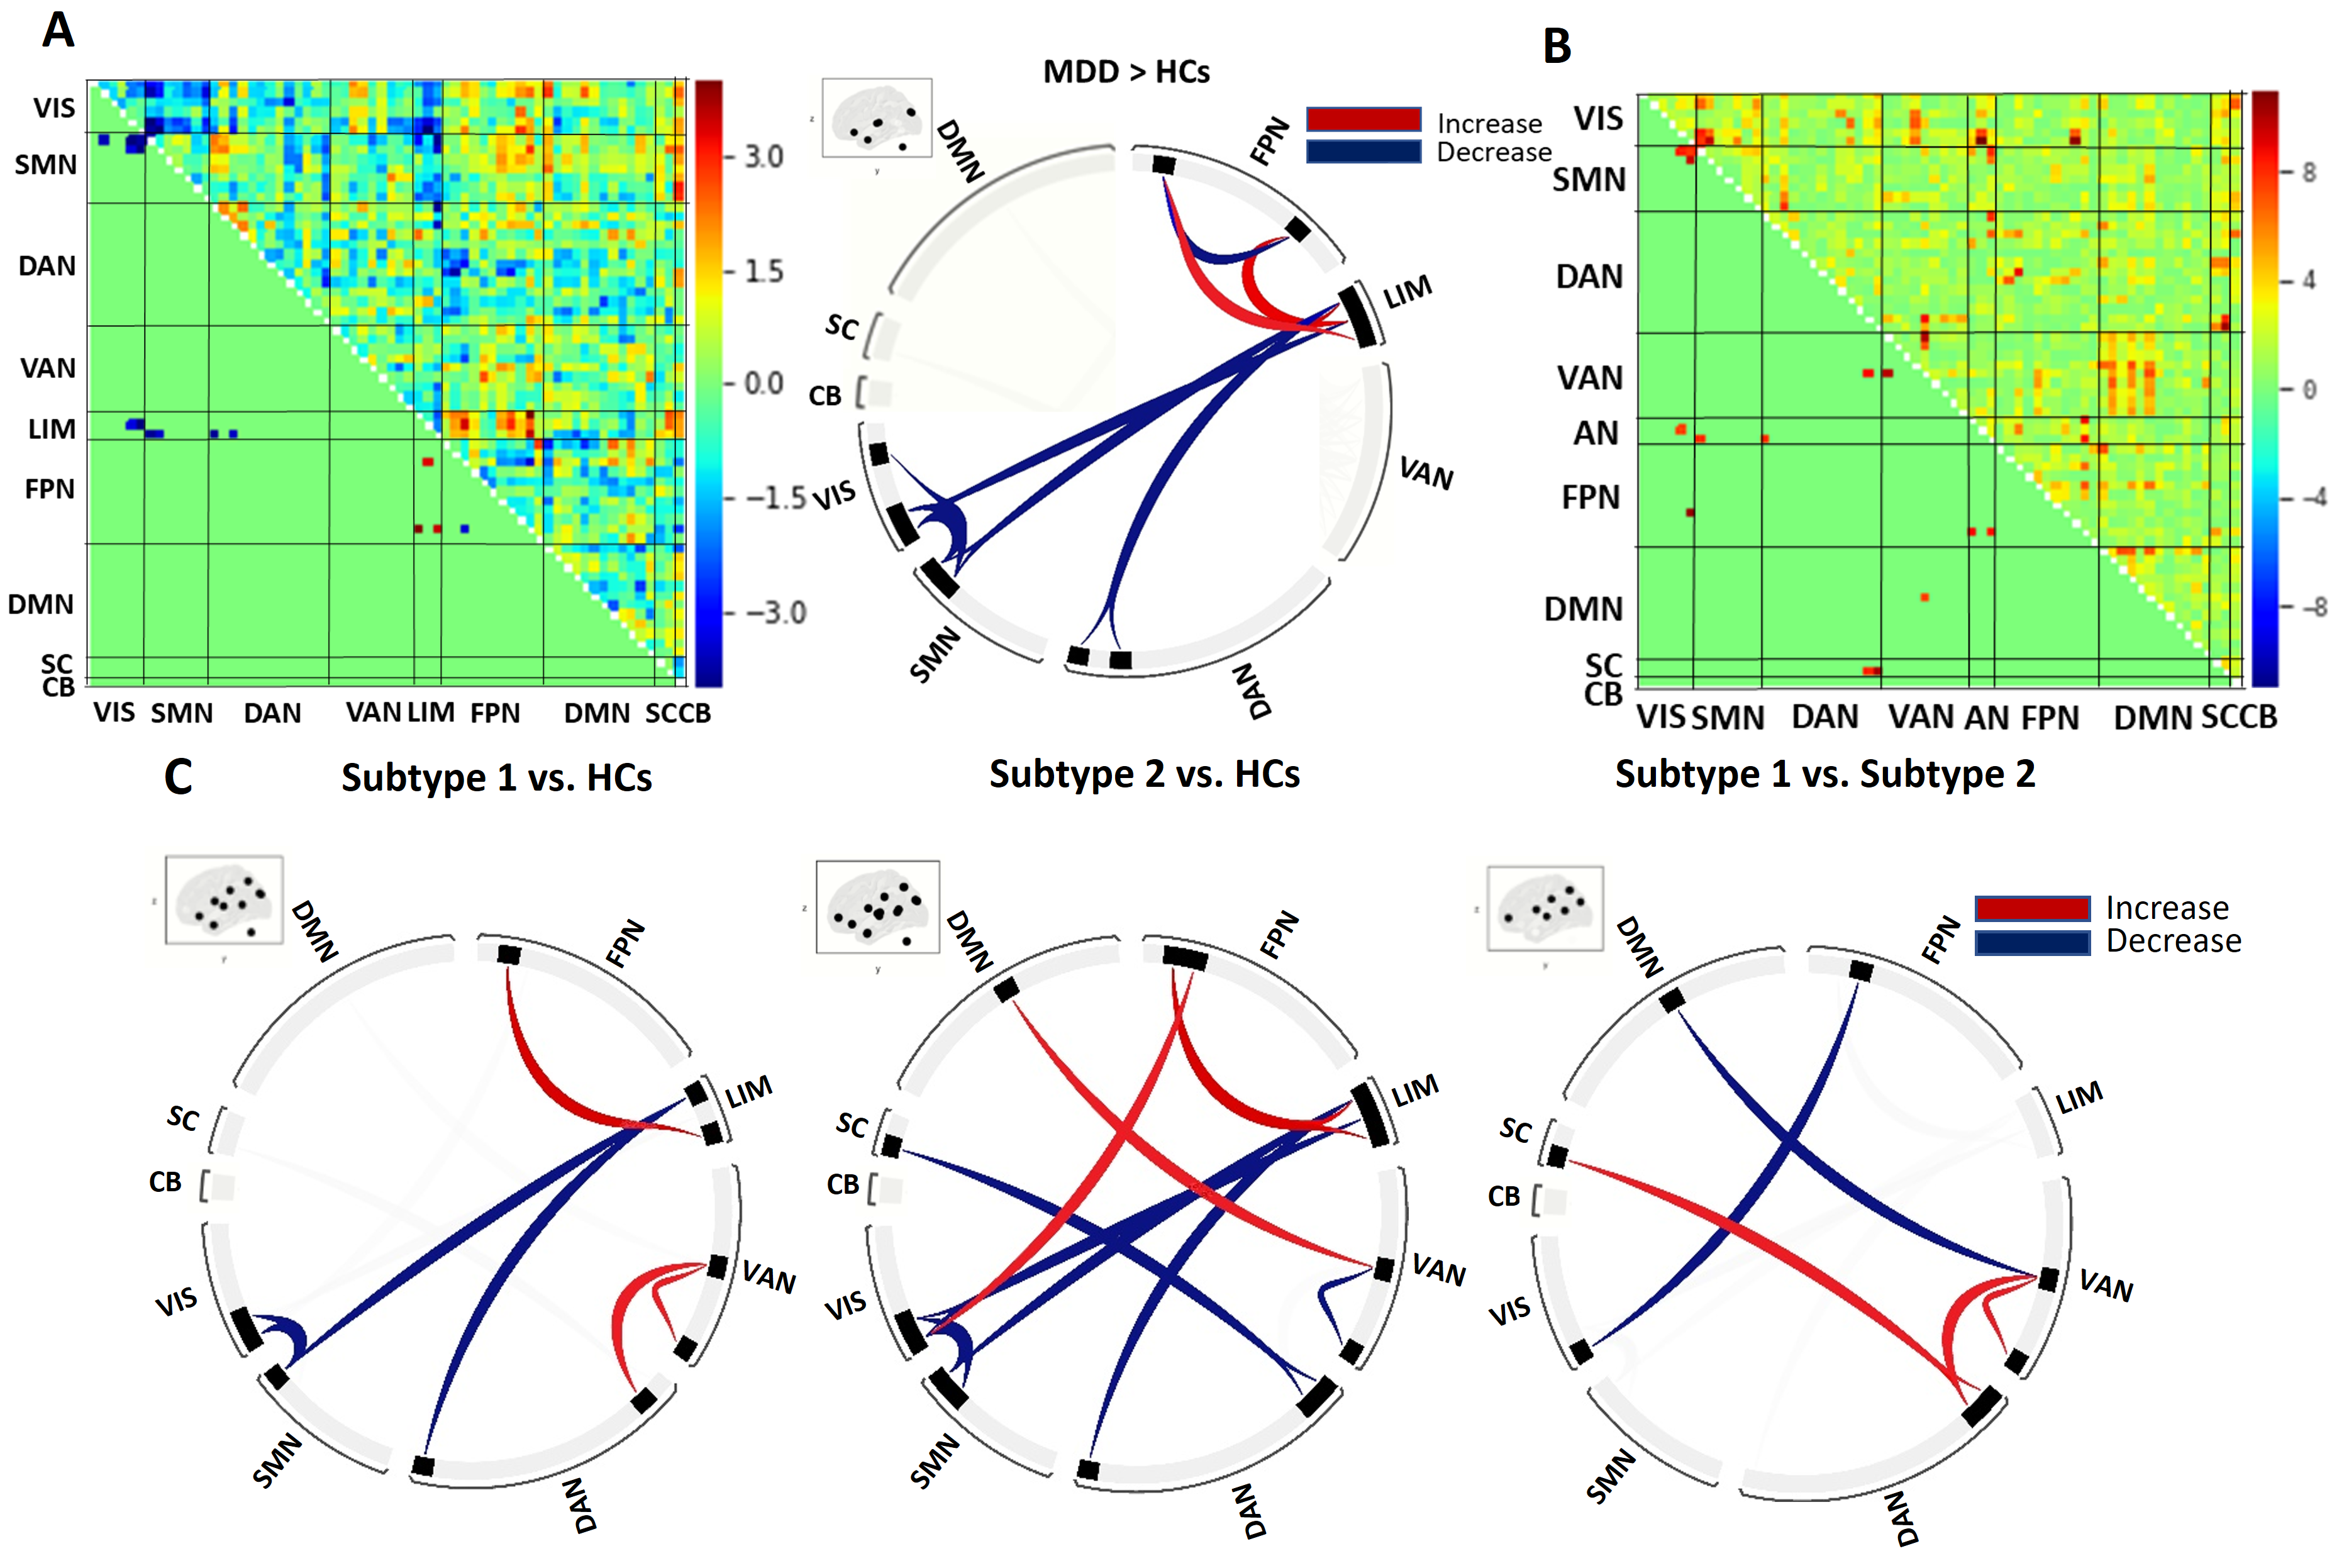
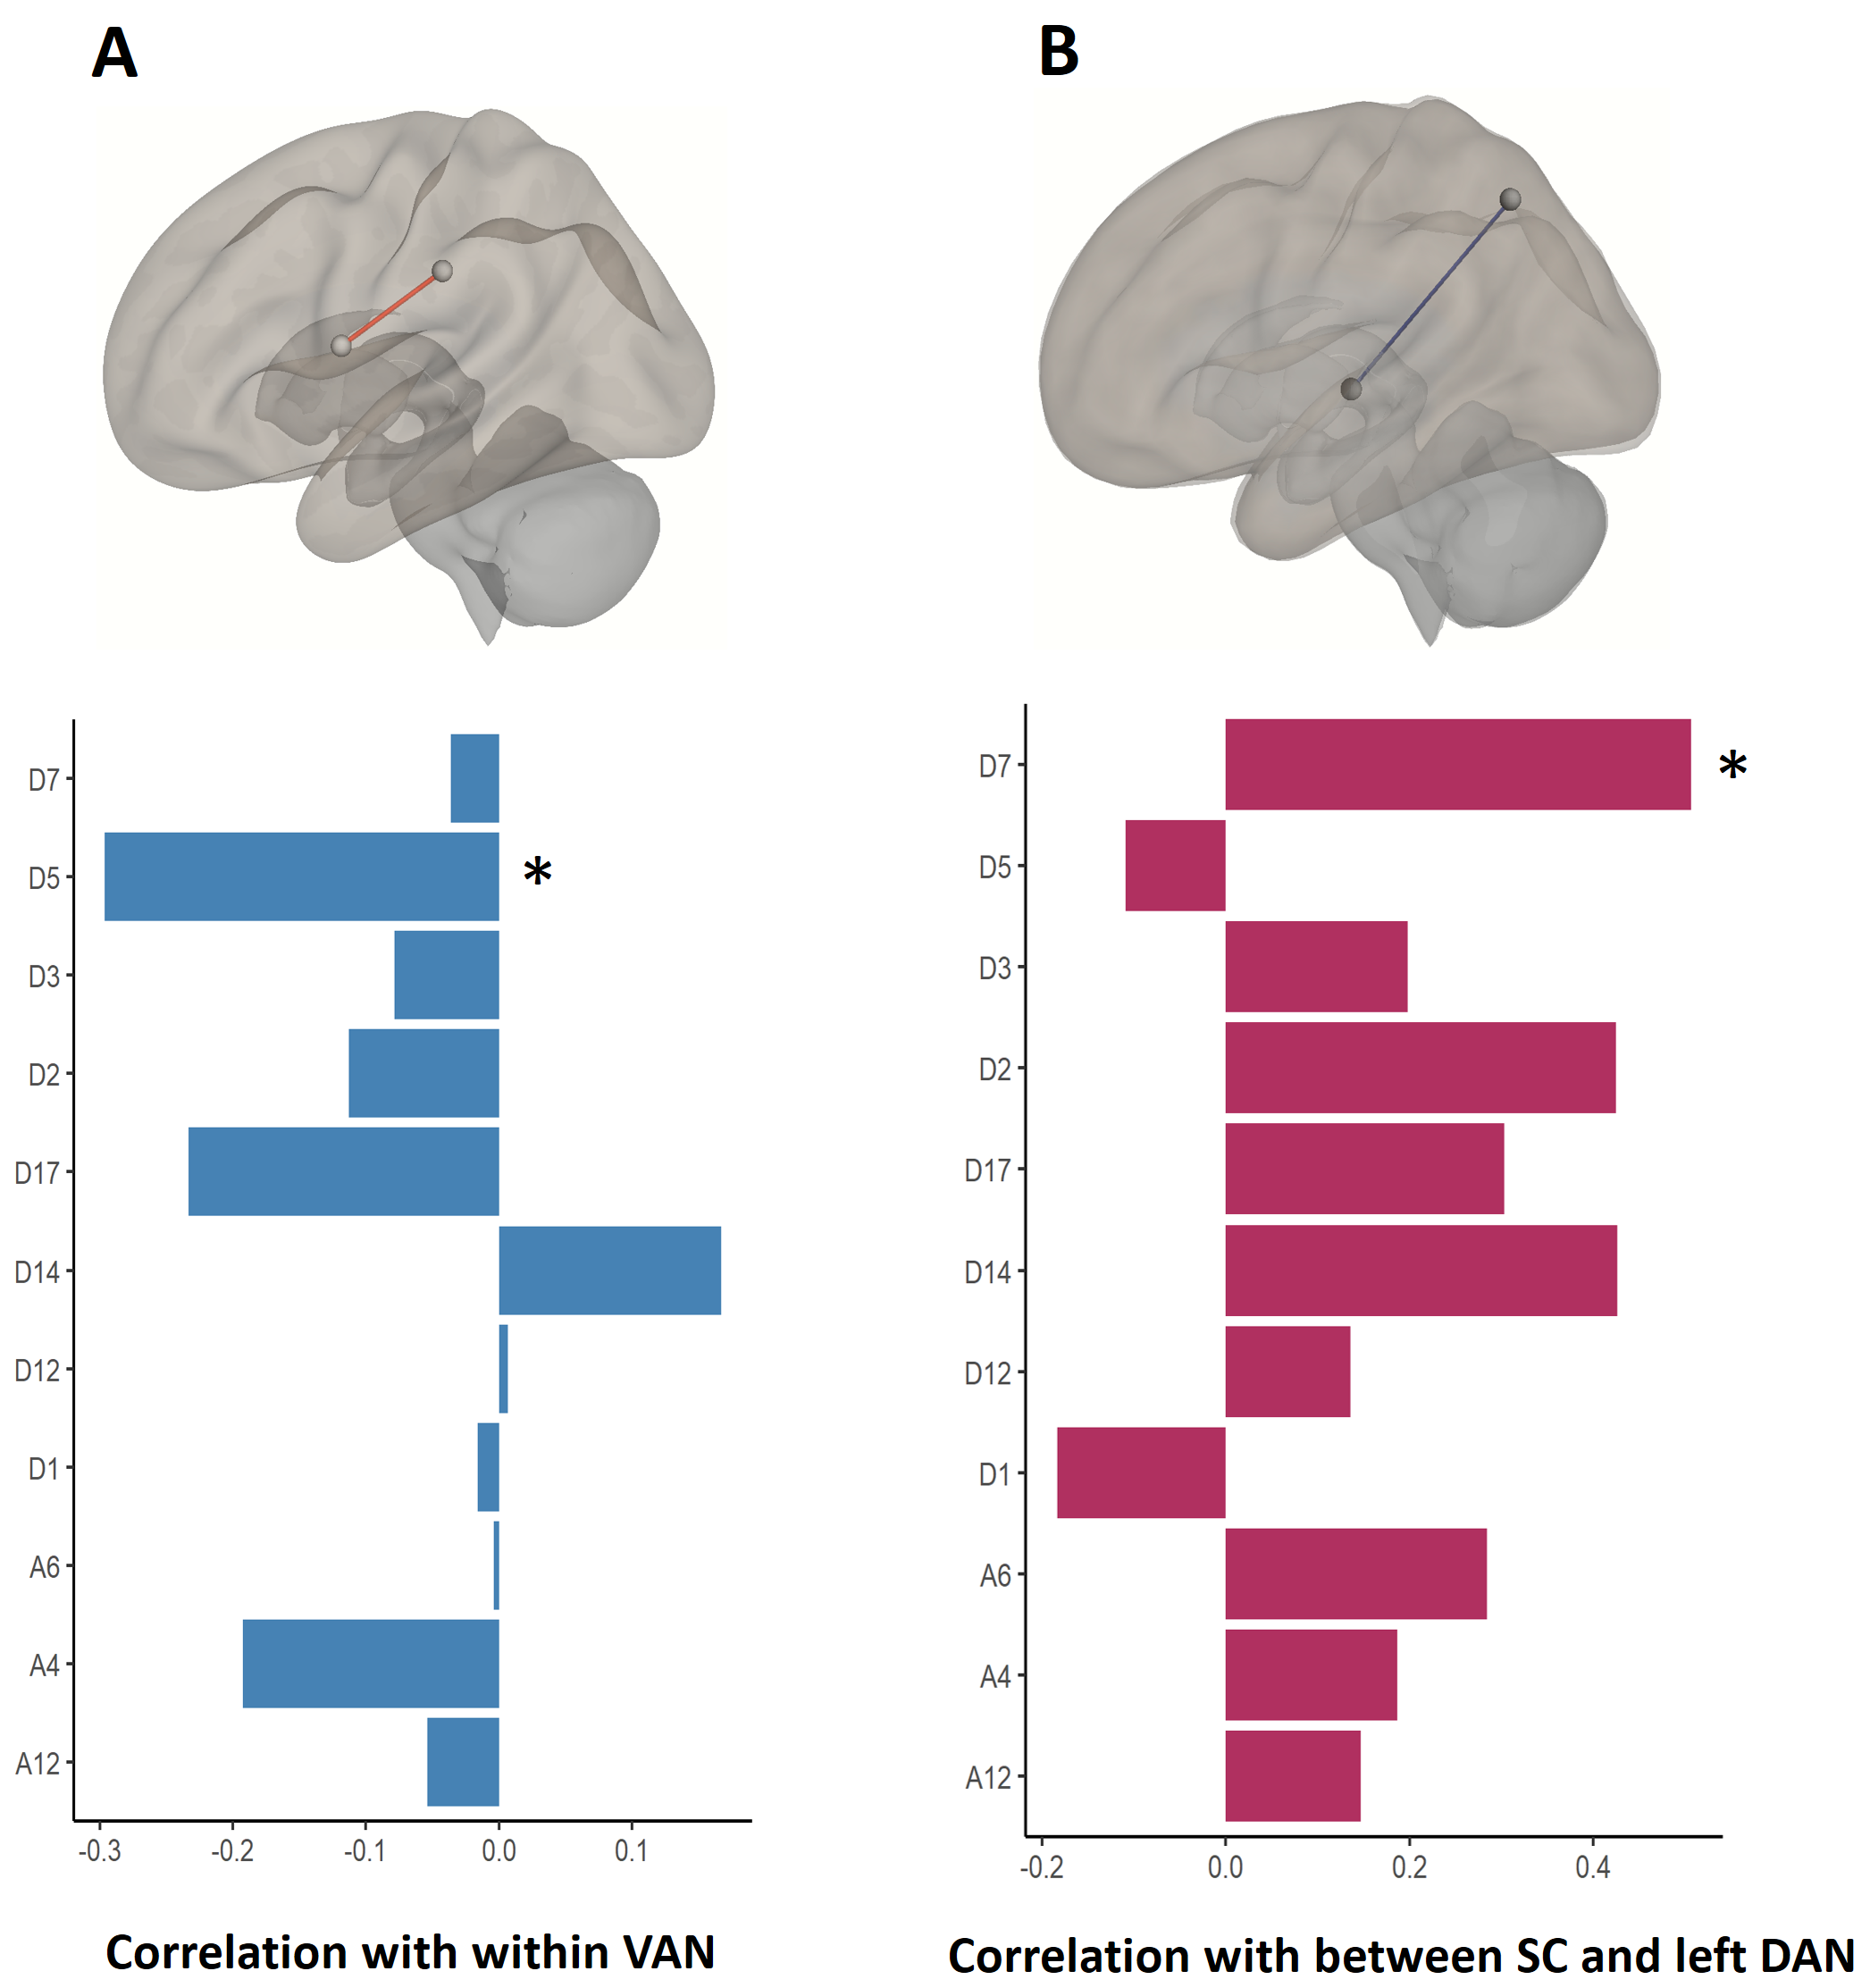
We identified and regressed out the time series of 4 noise components, leaving 26 independent components by the group-ICA method (Figure. 2). Two subtypes of MDD were identified by an unsupervised approach. There were the eleven symptoms measures (Figure. 3A/B) that showed the significant subgroup differences, which indicated that melanchonia-dominated symptoms were characterized in subtype 1 and insomnia-dominated symptoms were pronounced in subtype 2. Overall depression and anxiety severity scores were no significant between both subtypes (Figure. 3C). Importantly, distinct subtype patterns of abnormal ICNs were revealed. Such as, compared to controls, hyperconnectivity between VAN and DAN, as well as within VAN in subtype 1. By contrast, hyperconnectivity between DMN and VAN, FPN and VIS, as well as hypoconnectivity between SC and DAN and within VAN in subtype 2 (Figure. 4C). In addition, comparisons of ICNs between MDD subtypes, all patients and HCs, there were common (‘shared’) connectivity patterns across all patients which involving in hypoconnectivity between VIS and somatomotor network (SMN), AN and SMN, AN and DAN, as well as hyperconnectivity between AN and FPN. (Figure. 4A/B). Finally, PLSR analyses showed increased ICNs within VAN was negatively correlated to insomnia (D6) in subtype 1. By contrast, anhedonia (D7) was positively correlated to decreased ICNs between SC and DAN in subtype 2. The correlations were statistically significant against a permutation test (p<0.05, n=1000). To further illustrate the relation between common ICNs and symptom, feature loadings are showed in Figure 5. A graphic representation of the analysis pipeline is presented in Figure 1.Discussion
Patients with depression can be subdivided into insomnia-dominated subtype 1 and melanchonia-dominated subtype 2 by an unsupervised approach, which were underlined by the distinct network patterns. These included hyperconnectivity within VAN, involved in increasing attention or sensitivity for salient events(especially negative events) or difficulty concentrating or regulating attention, was especially pronounced in subtypes 1 and were associated with increased insomnia (2-3). By contrast, hypoconnectivity in SC and DAN, involved in orienting attention to internal thoughts at cost of engaging with the external world (4-5), were most severe in subtype 2, which were associated with anhedonia symptoms. Thus, our results suggested that these distinct neural substrates underlying two subtypes of depression were crucial to understand the association between distinct brain networks and specific clinical symptoms and would help us tackle the problem of diagnostic heterogeneity of depression and improve treatment strategies for distinct depression subtypes.Conclusion
The present study is, to our knowledge, the first effort to use the association between clinical symptoms and neural underpinnings for the purpose of defining MDD subtype. It provides some helpful insights in terms of characterizing MDD subtype and identifying diagnostic biomarkers. First, we applied a combination model of rCCA and clustering based on the both neuroimaging and clinical datasets that defined two valid subtypes of MDD (insomnia-dominated and melanchonia-dominated), which make the best use of relevant information between neurobiology substrates and clinical symptoms. Second, although the two subtypes identified were associated with multiple heterogeneous symptoms of MDD, they did not simply reflect differences in overall depression severity. Furthermore, specific symptoms dominated subtypes of depression that were associated with distinct network patterns, which were helpful for understanding the complex pathophysiology mechanisms of MDD. Looking forward, the ability of this neurobiological-clinical framework to predict disease trajectory and treatment response should also be evaluated, which can accelerate personalized treatment in psychiatric disorders.Acknowledgements
The authors would like to thank their tutors and colleagues for their time and valuable help.References
1. Drysdale AT, Grosenick L, Downar J, Dunlop K, Mansouri F, Meng Y, et al. Resting-state connectivity biomarkers define neurophysiological subtypes of depression. Nat Med. 2017;23(1):28-38.
2. Buysse DJ. Insomnia. Jama. 2013;309(7):706-16.
3. Menon V, Uddin LQ. Saliency, switching, attention and control: a network model of insula function. Brain structure & function. 2010;214(5-6):655-67.
4. Keller AS, Leikauf JE, Holt-Gosselin B, Staveland BR, Williams LM. Paying attention to attention in depression. Translational psychiatry. 2019;9(1):279.
5. Kaiser RH, Andrews-Hanna JR, Wager TD, Pizzagalli DA. Large-Scale Network Dysfunction in Major Depressive Disorder: A Meta-analysis of Resting-State Functional Connectivity. JAMA psychiatry. 2015;72(6):603-11.
Figures