0191
MR Multitasking based Multidimensional Assessment of Cardiovascular System (MT-MACS) with Extended Spatial Coverage and Water-Fat Separation1Biomedical Imaging Research Institute, Cedars-Sinai Medical Center, Los Angeles, CA, United States, 2Department of Bioengineering, University of California, Los Angeles, Los Angeles, CA, United States, 3Smidt Heart Institute, Cedars-Sinai Medical Center, Los Angeles, CA, United States, 4Siemens Medical Solutions USA, Inc., Los Angeles, CA, United States, 5Department of Neurology, Cedars-Sinai Medical Center, Los Angeles, CA, United States, 6Department of Radiology, Keck School of Medicine, University of Southern California, Los Angeles, CA, United States, 7Department of Radiation Oncology, Keck School of Medicine, University of Southern California, Los Angeles, CA, United States
Synopsis
Non-invasive imaging of cardiac anatomy plays an important role in diagnosis, risk stratification, and planning of procedures in patients with cardiovascular disease. MR imaging has the potential to provide a comprehensive evaluation of cardiac chambers and thoracic vessels. However, the clinical workflow for the acquisition of conventional cardiac MR imaging is complex and time-consuming. MR MultiTasking based 3D Multi-dimensional Assessment of Cardiovascular System (MT-MACS) technique has recently been demonstrated in thoracic aortic diseases without need for ECG- and navigator-gating. In this work, we further extend the application of MT-MACS to the assessment of the whole heart and great thoracic vessels.
Introduction
Imaging assessment of cardiac and vascular anatomy and function is a key component for diagnosis, risk stratification, and procedural planning in patients with cardiovascular diseases1-3. MR imaging has the potential to provide a comprehensive assessment of the entire heart through multi-contrast, motion-resolved and water/fat imaging. However, the clinical workflow for conventional cardiac MR imaging is complex and time-consuming, due to (a) the complexity of cardiovascular anatomy, (b) cardiac and respiratory motion of the heart, and (c) the resultant long imaging time4. Hence, current cardiac MR images are acquired in separate scans with several non-standard planes, and the acquisition requires ECG-triggering with multiple breath-holds. An MR MultiTasking based 3D Multi-dimensional Assessment of Cardiovascular System (MT-MACS) technique has recently been shown to provide multi-contrast and cardiac phase-resolved imaging of the thoracic aorta in a single scan without the need for ECG triggering, navigator gating or breath-holds5. In this work, we further extend the application of MT-MACS to the assessment of the whole cardiac structures and great thoracic vessels with water/fat separation.Methods
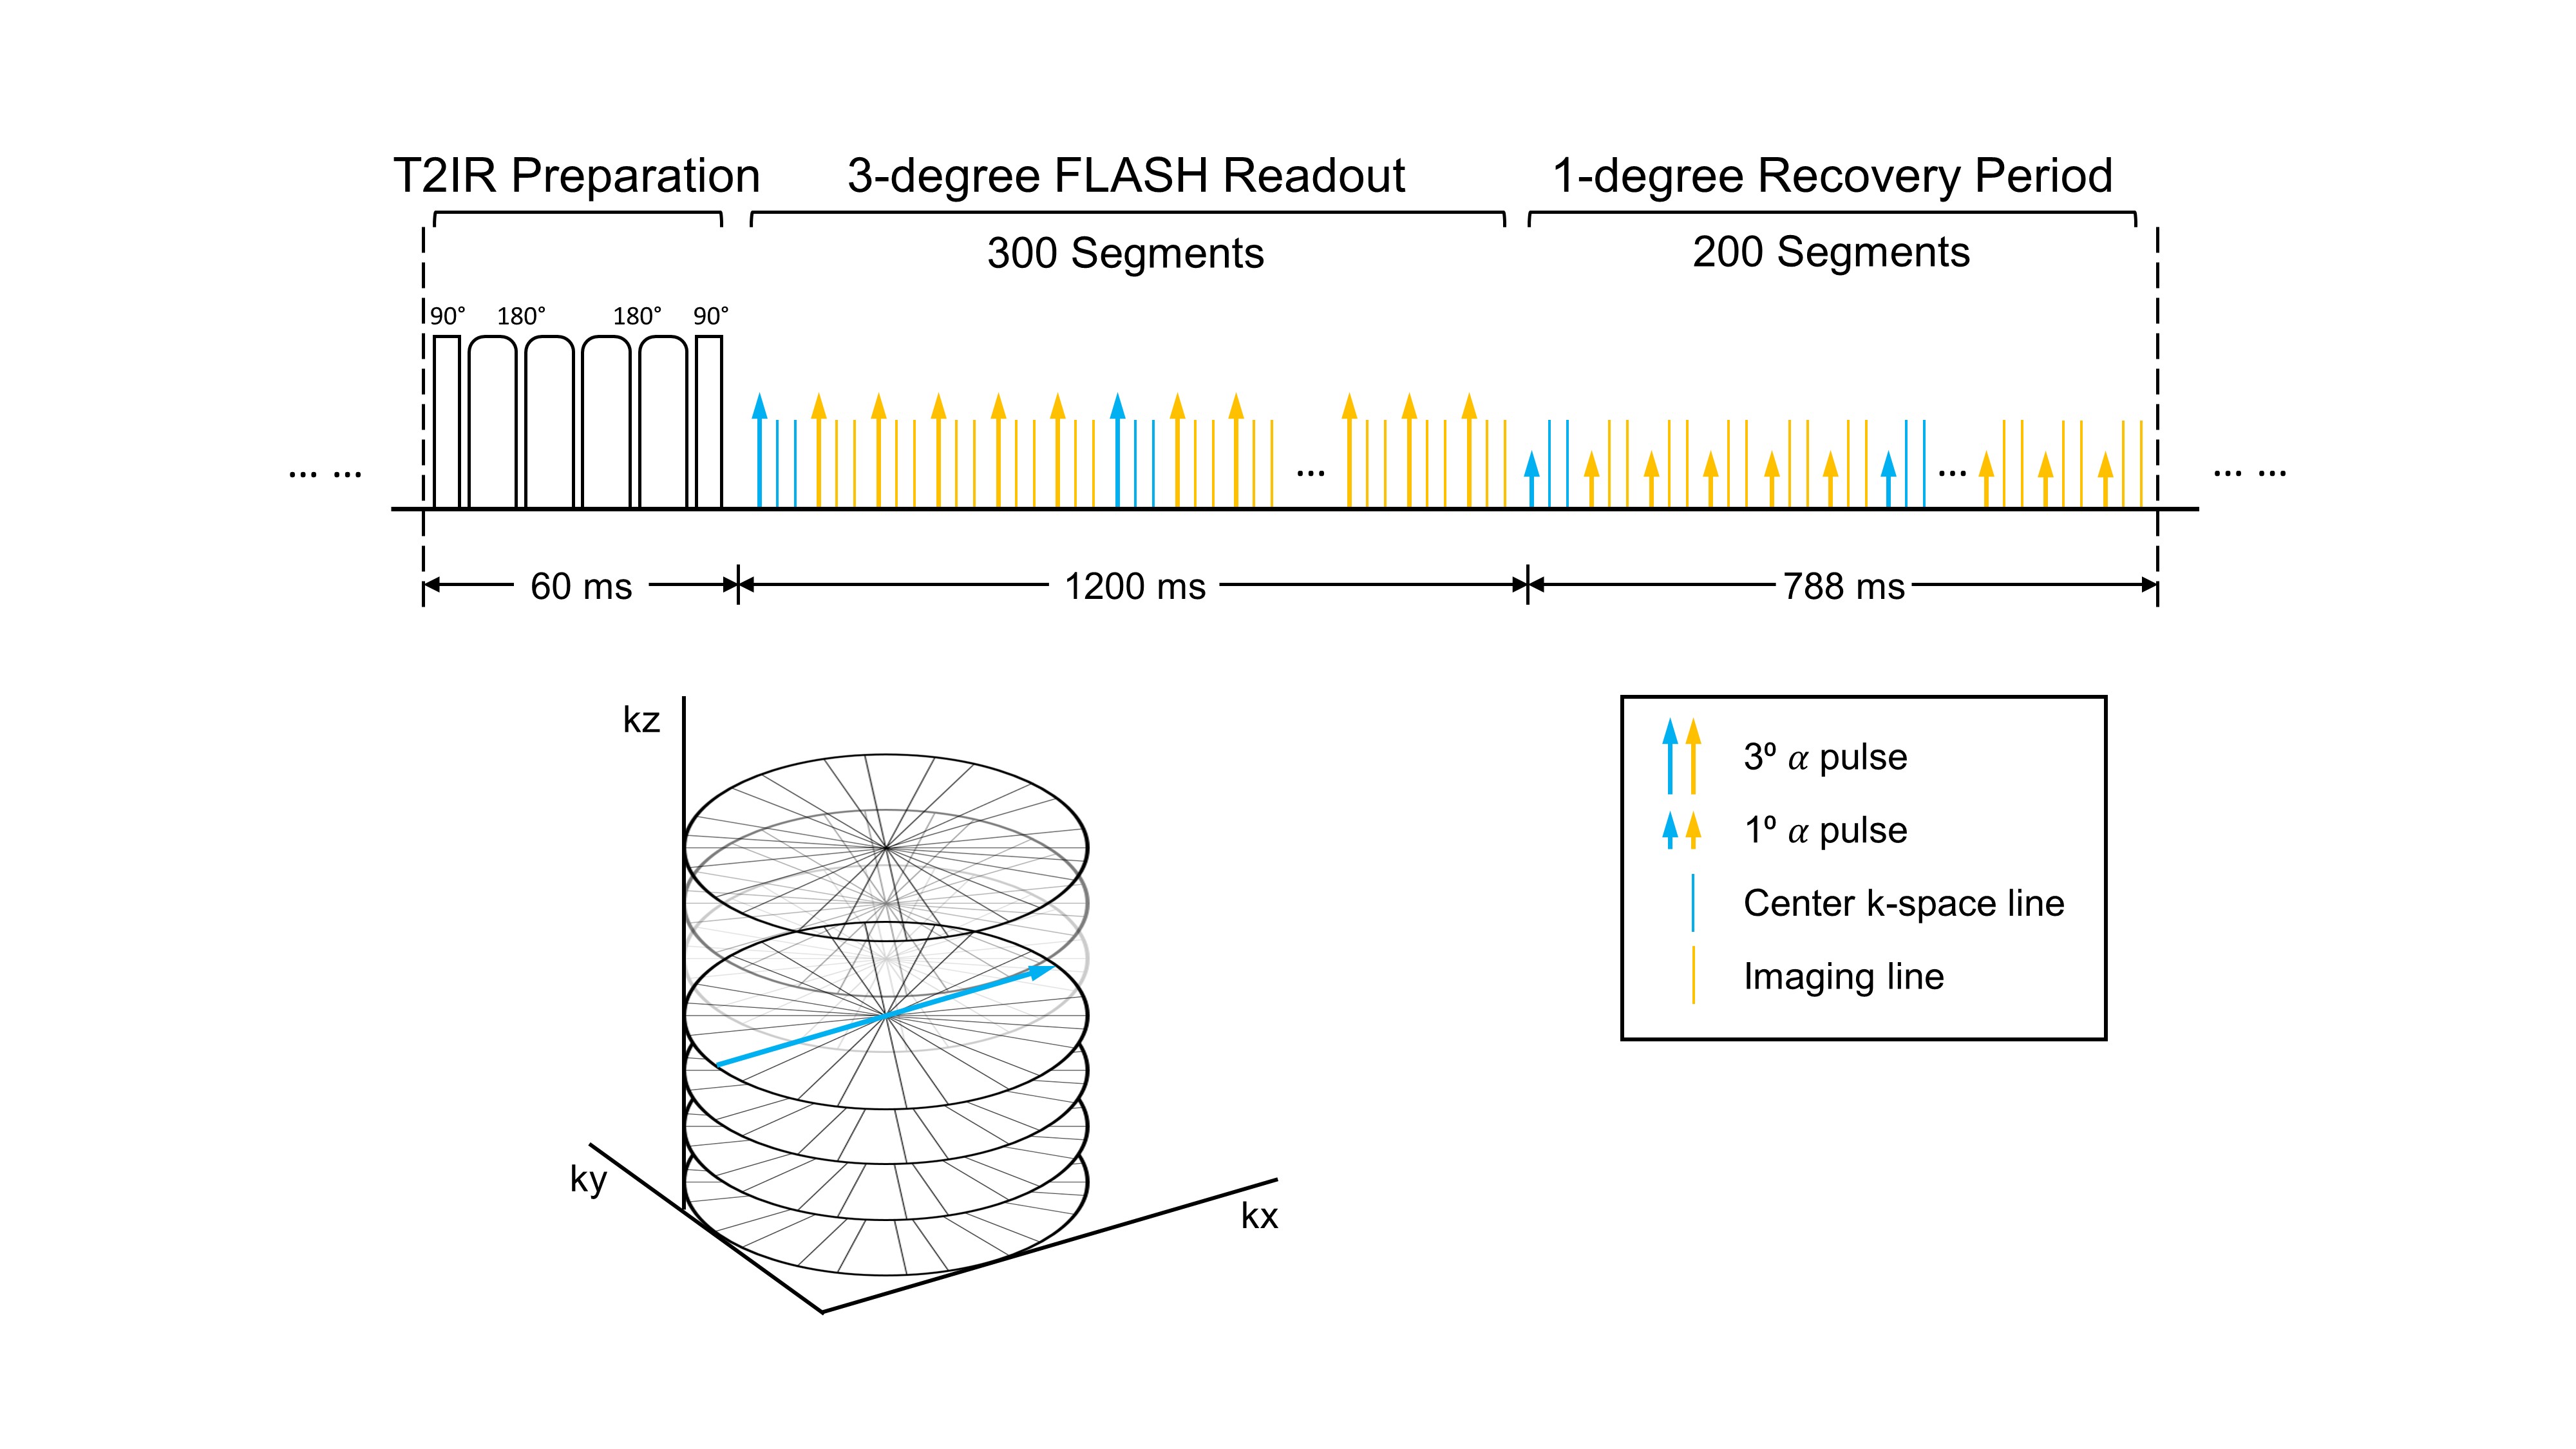
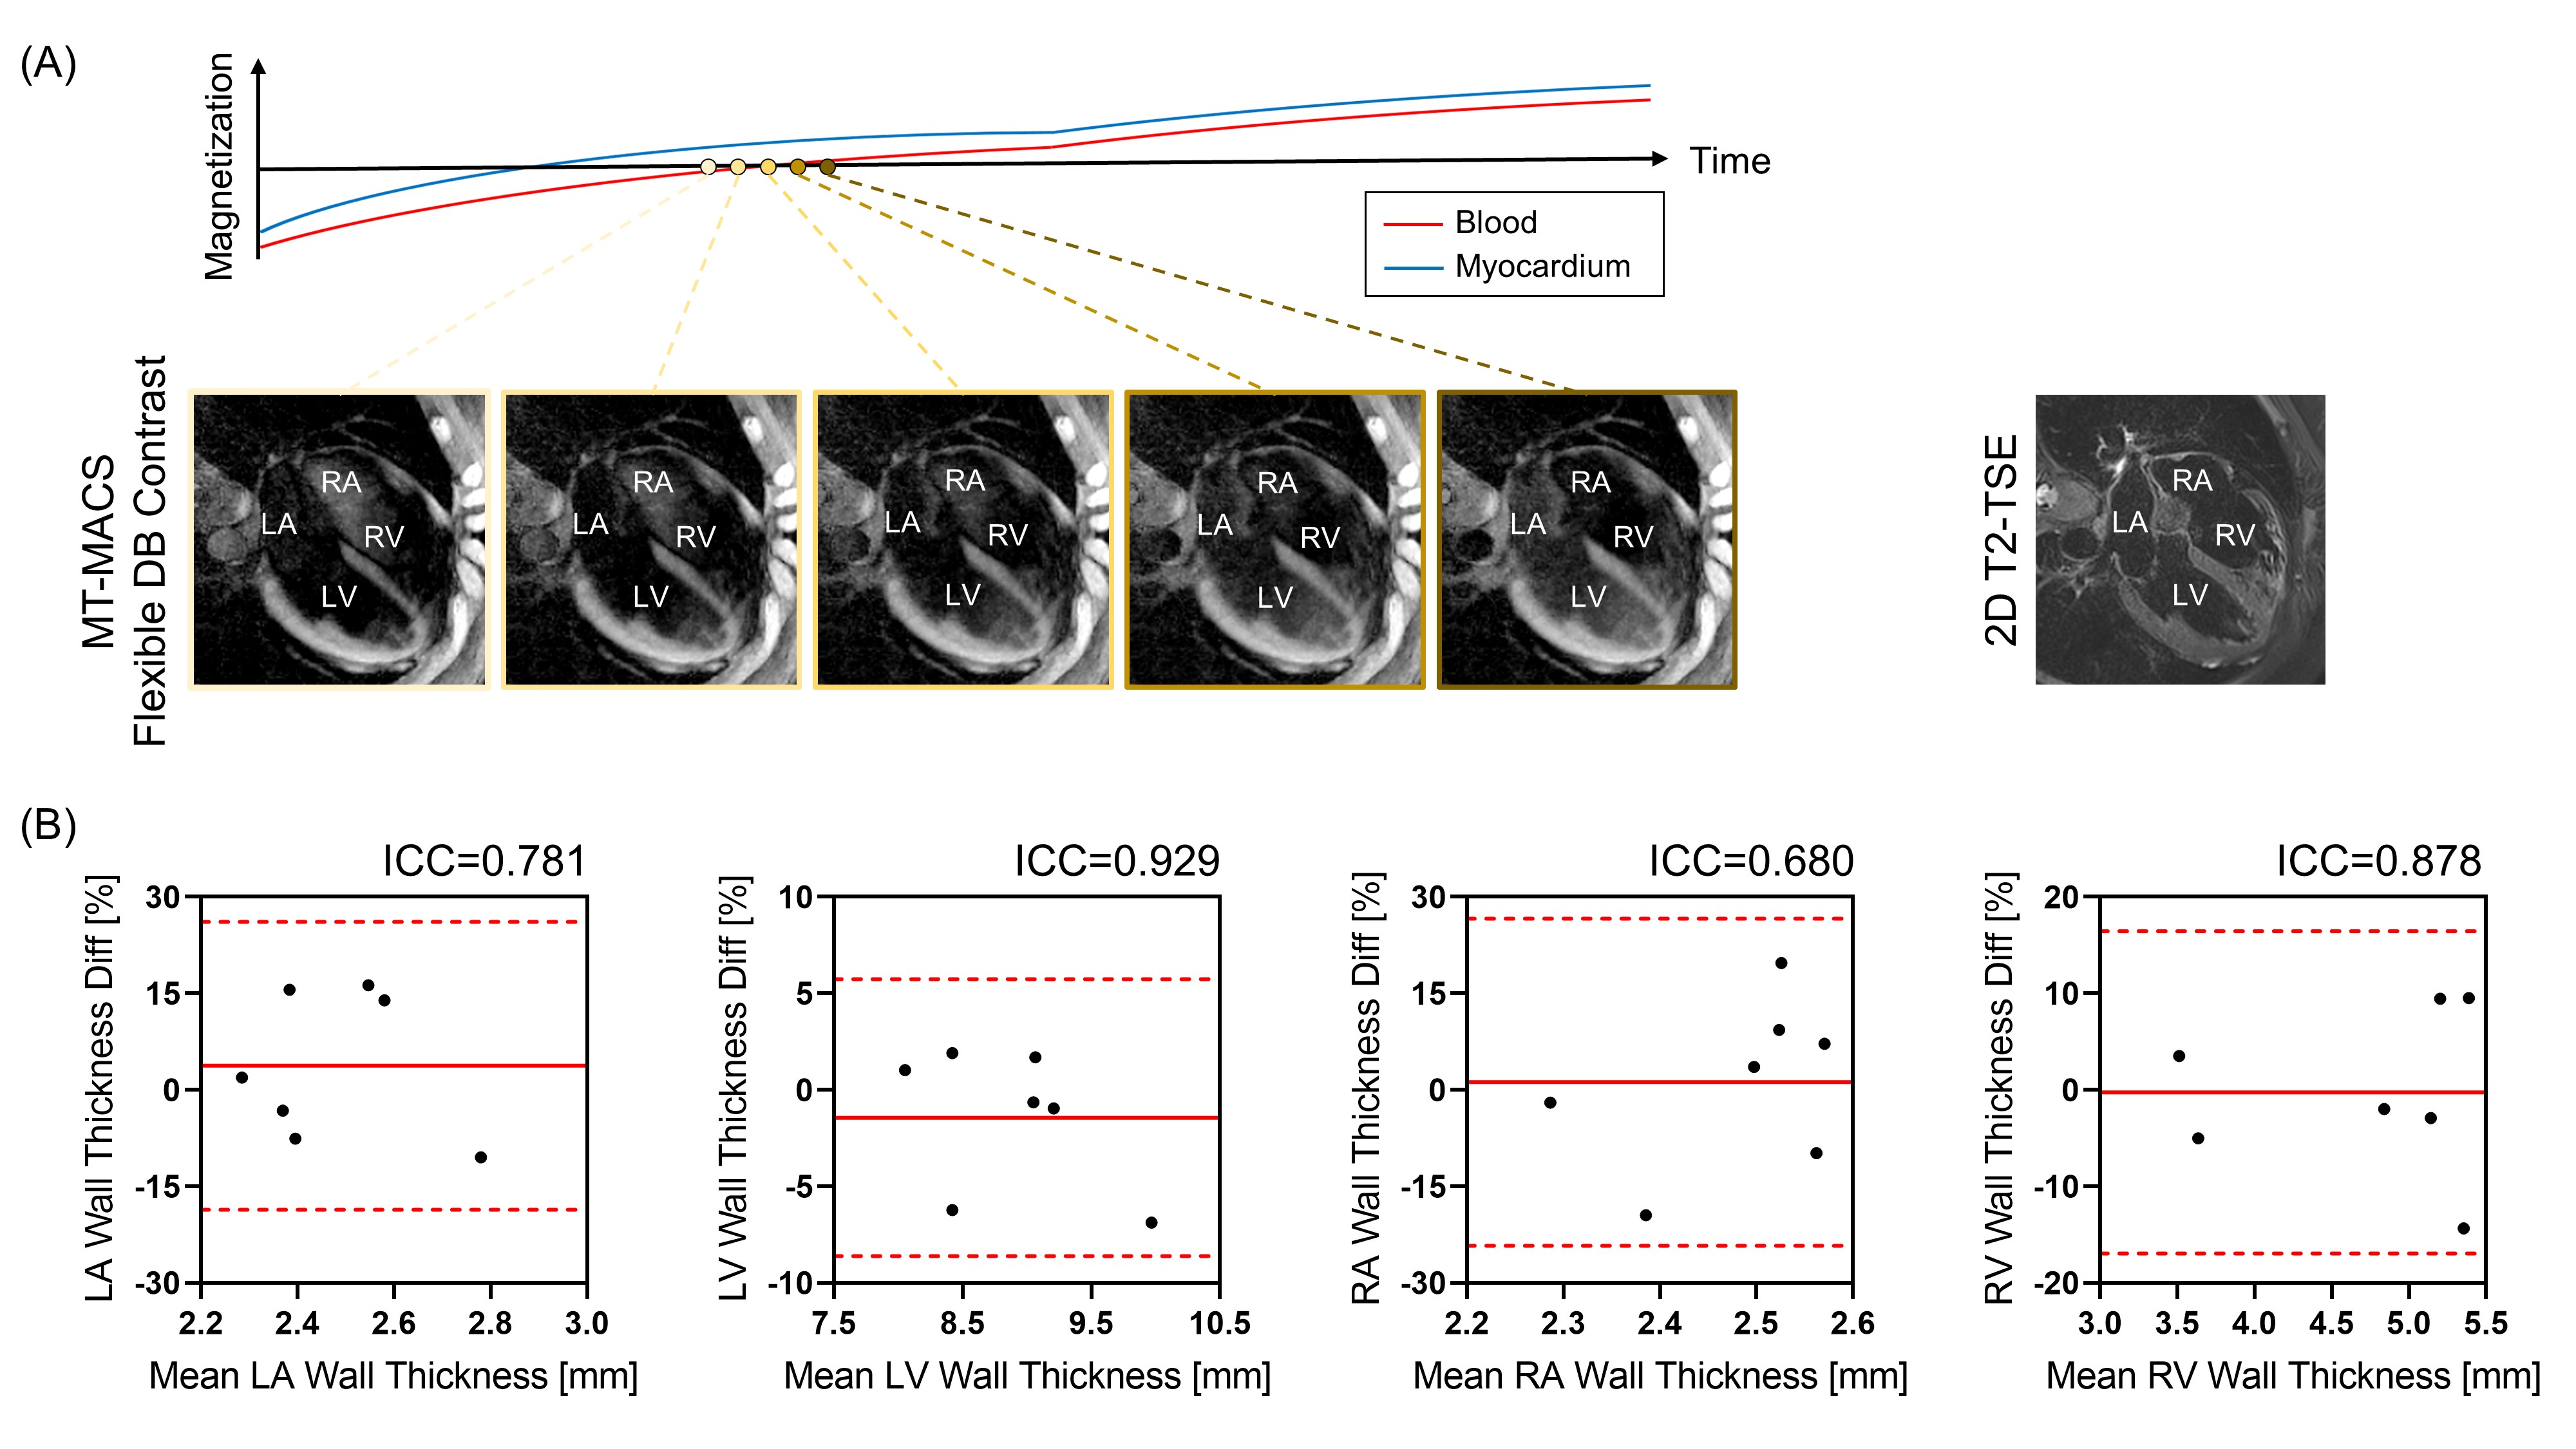
Sequence Design: In this work, we modified the continuous 3D acquisition scheme of our recently developed MT-MACS technique5 from single-echo Cartesian FLASH into dual-echo stack-of-stars FLASH readouts with tiny-golden-angle ($$$\Psi$$$=32.039⁰) in-plane k-space sampling. T2-prepared inversion recovery (T2IR) magnetization preparations are applied at constant intervals to maximize the contrast between myocardium/vessel wall and blood and create flexible contrast weightings during T1 recovery. Following each T2IR, RF pulse flip angles are 3⁰ for the first 300 segments, and 1⁰ for the next 200 segments (allowing for greater magnetization recovery). Auxiliary data are interleaved with imaging data every 6 readouts and are collected at the 0⁰ radial spoke of the center partition (Figure 1). Partition-encoding ordering for imaging data is randomized with a variable-density Gaussian distribution.Imaging Framework: MT-MACS adopts a low-rank tensor imaging model6 with a cardiac time dimension for phase-resolved cine imaging, a respiratory time dimension for free-breathing imaging, a T1 recovery dimension for multi-contrast assessment and a T2* decay dimension for dual-echo imaging. The model represents the multidimensional cardiac image as $$$\textbf{U}\mathbf{\Phi }$$$, where temporal basis functions $$$\mathbf{\Phi }$$$ are extracted from high-temporal-resolution auxiliary data and spatial coefficients $$$\textbf{U}$$$ are determined by least-squares fitting of $$$\mathbf{\Phi }$$$ to the undersampled imaging data $$$\textbf{d}$$$:
$$\hat{\textbf{U}}=\underset{\textbf{U}}{\arg \min}\left \| \textbf{d}-\Omega (\textbf{EU}\mathbf{\Phi })) \right \|_{2}^{2}+\lambda R(\textbf{U})$$
where $$$\Omega $$$ is the undersampling pattern, $$$\textbf{E}$$$ is the signal model including Fourier transform and coil sensitivities. $$$R$$$ was chosen as a wavelet sparsity penalty. Finally, the water/fat images are generated based on a two-point Dixon method7.
In vivo Study: Nine healthy subjects were scanned on a 3T system (Vida, Siemens Healthcare). The prototype MT-MACS sequence was prescribed based on an axial scout scan to cover the whole heart. Major imaging parameters included: coronal orientation, FOV=224×224×162.4 mm3, spatial resolution=1.4×1.4×2.8 mm3 (interpolated to 1.4 mm3 isotropic), T2-prep duration=60 ms, TR/TE1/TE2=3.94/1.23/2.46 ms, 500 readouts after each T2IR, total scan time=10 min. 2D Cine SSFP and 2D T2-TSE were acquired as references.
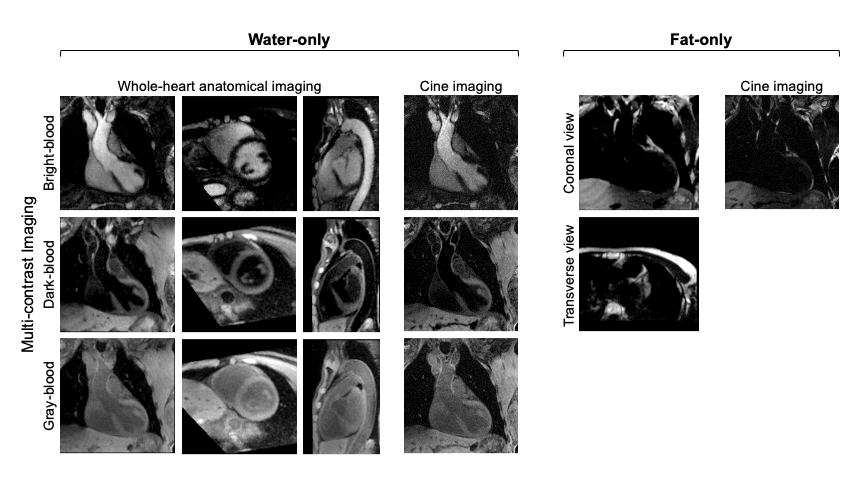
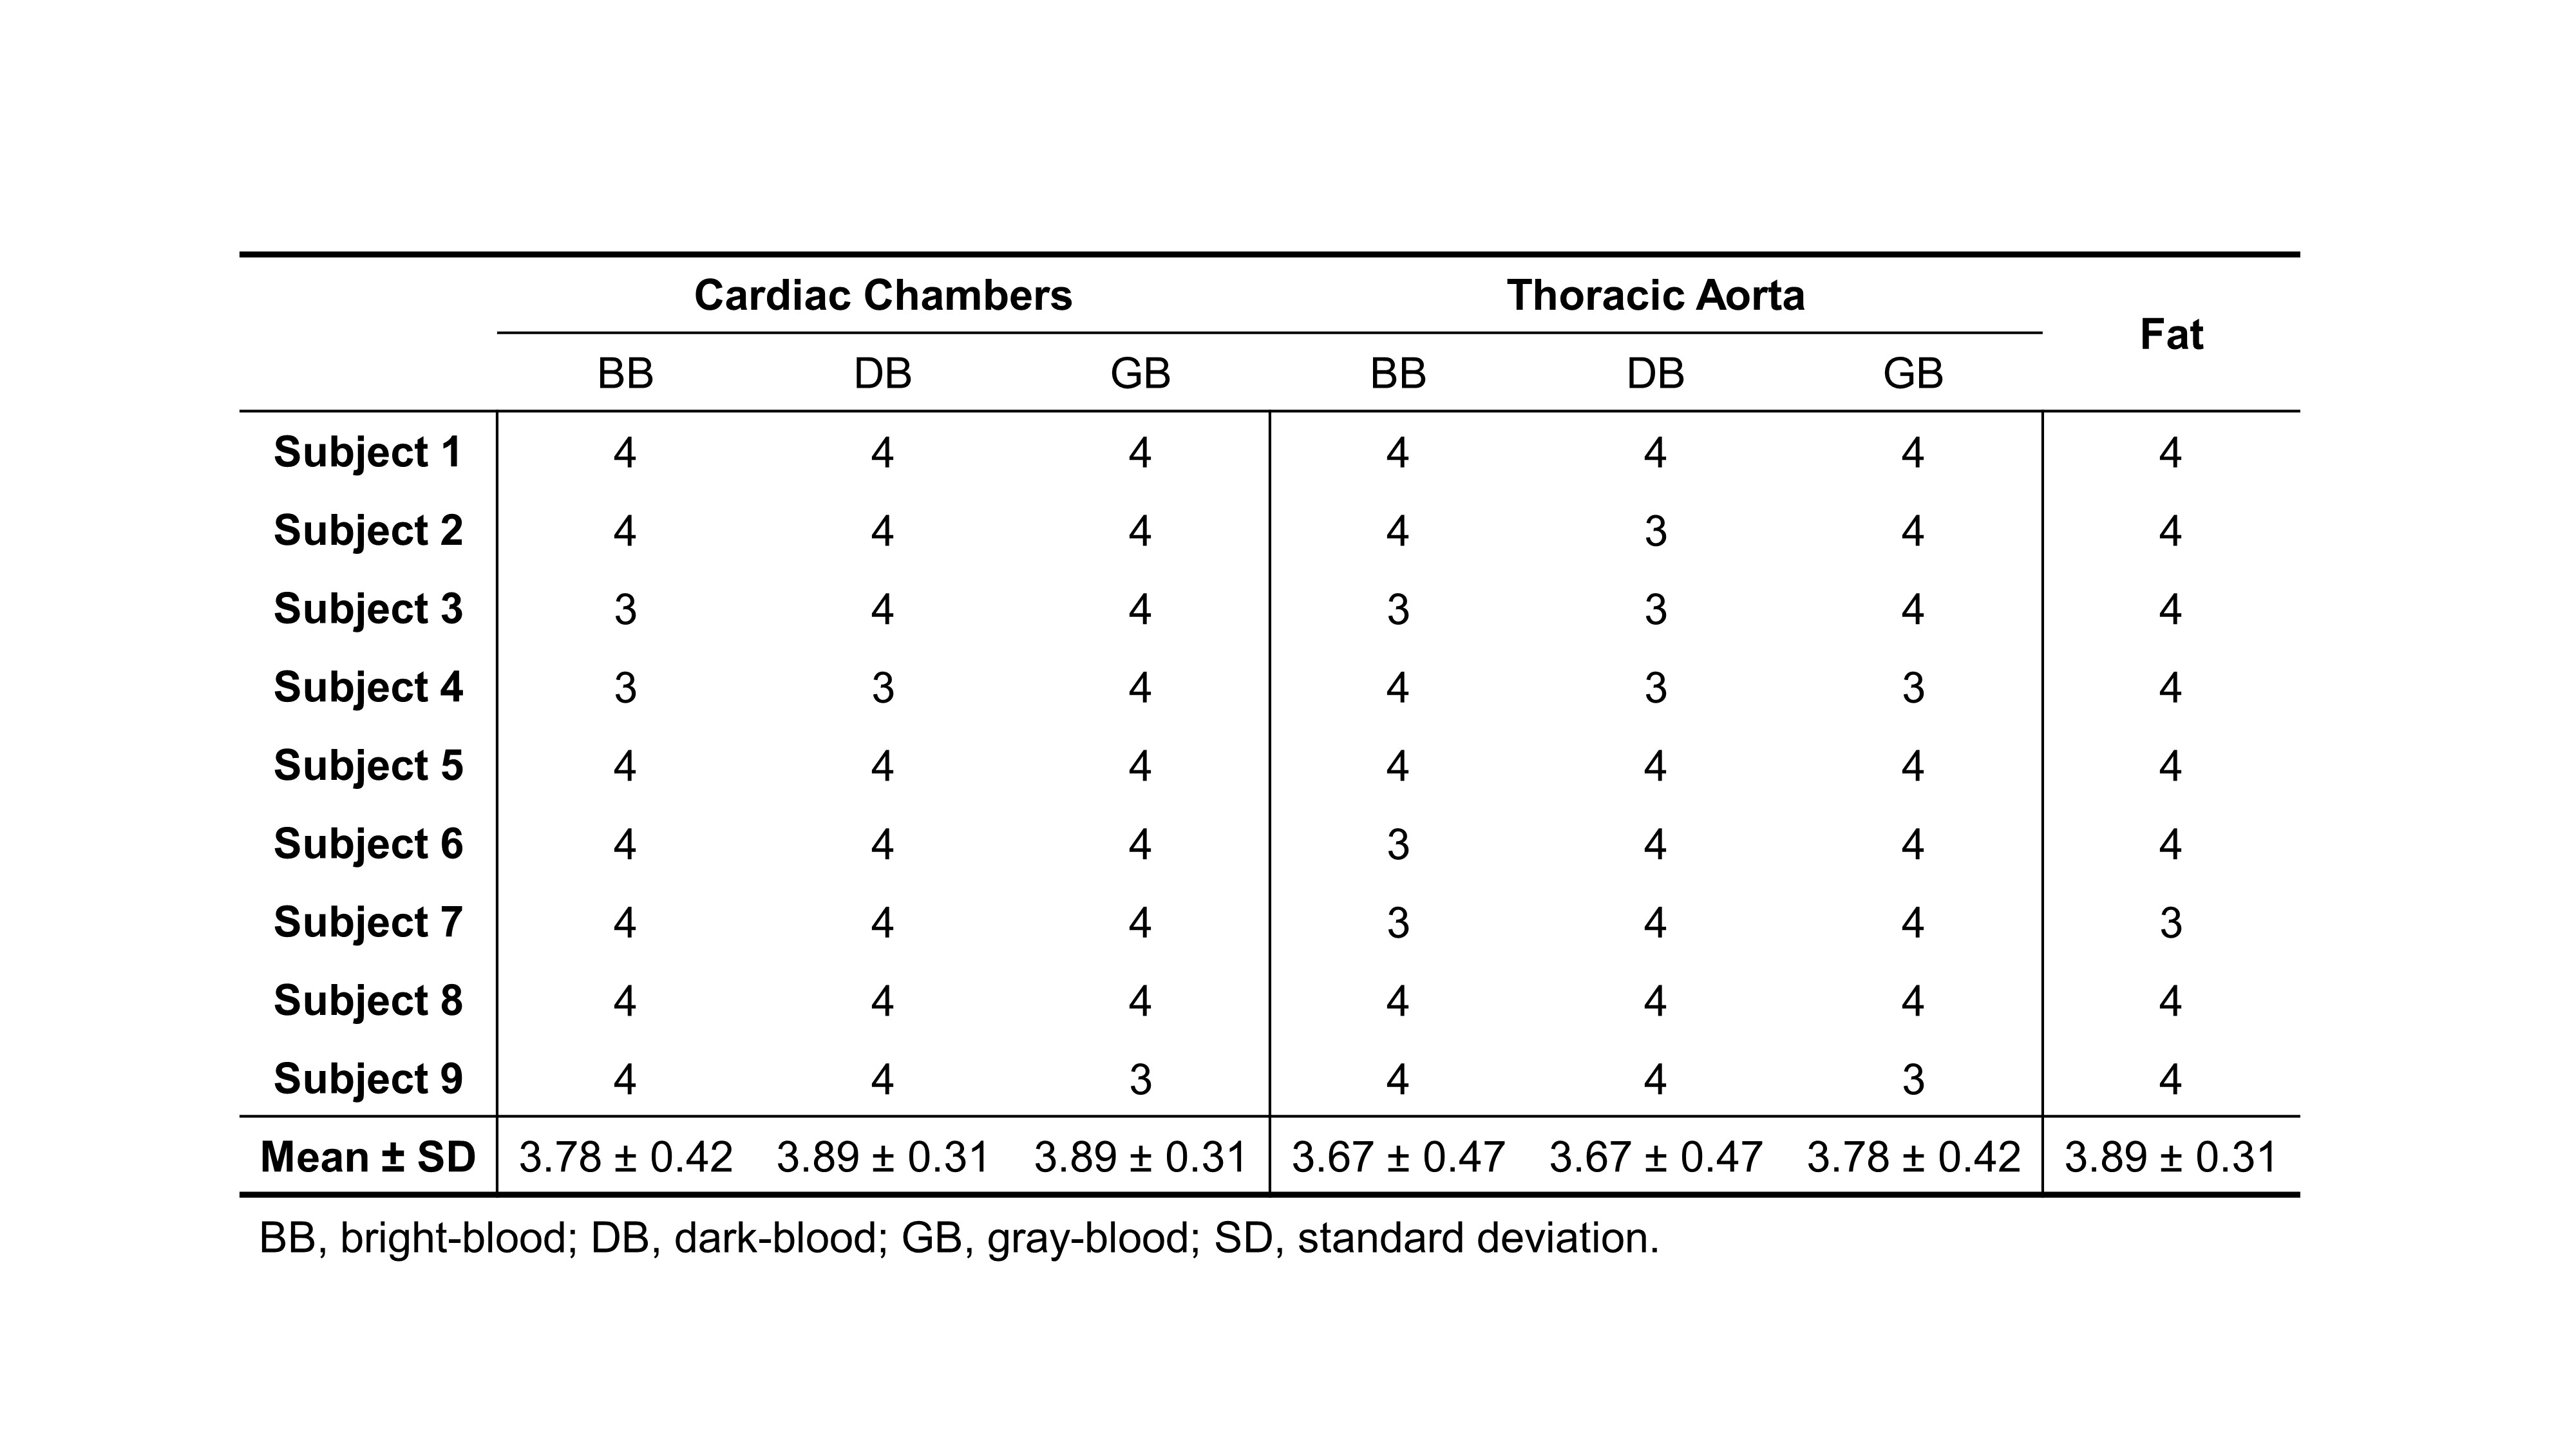
Image Analysis: Image reconstruction was performed offline to generate water-only images with multiple contrast weightings (i.e. bright-blood [BB], dark-blood [DB], gray-blood [GB]) and corresponding cine series as well as fat-only images. Qualitative (image quality score 1-4) and quantitative (left ventricular ejection fraction [LVEF], left atria [LA]/left ventricle [LV]/right atria [RA]/right ventricle [RV] wall thickness at middiastole) analyses were performed.
Results
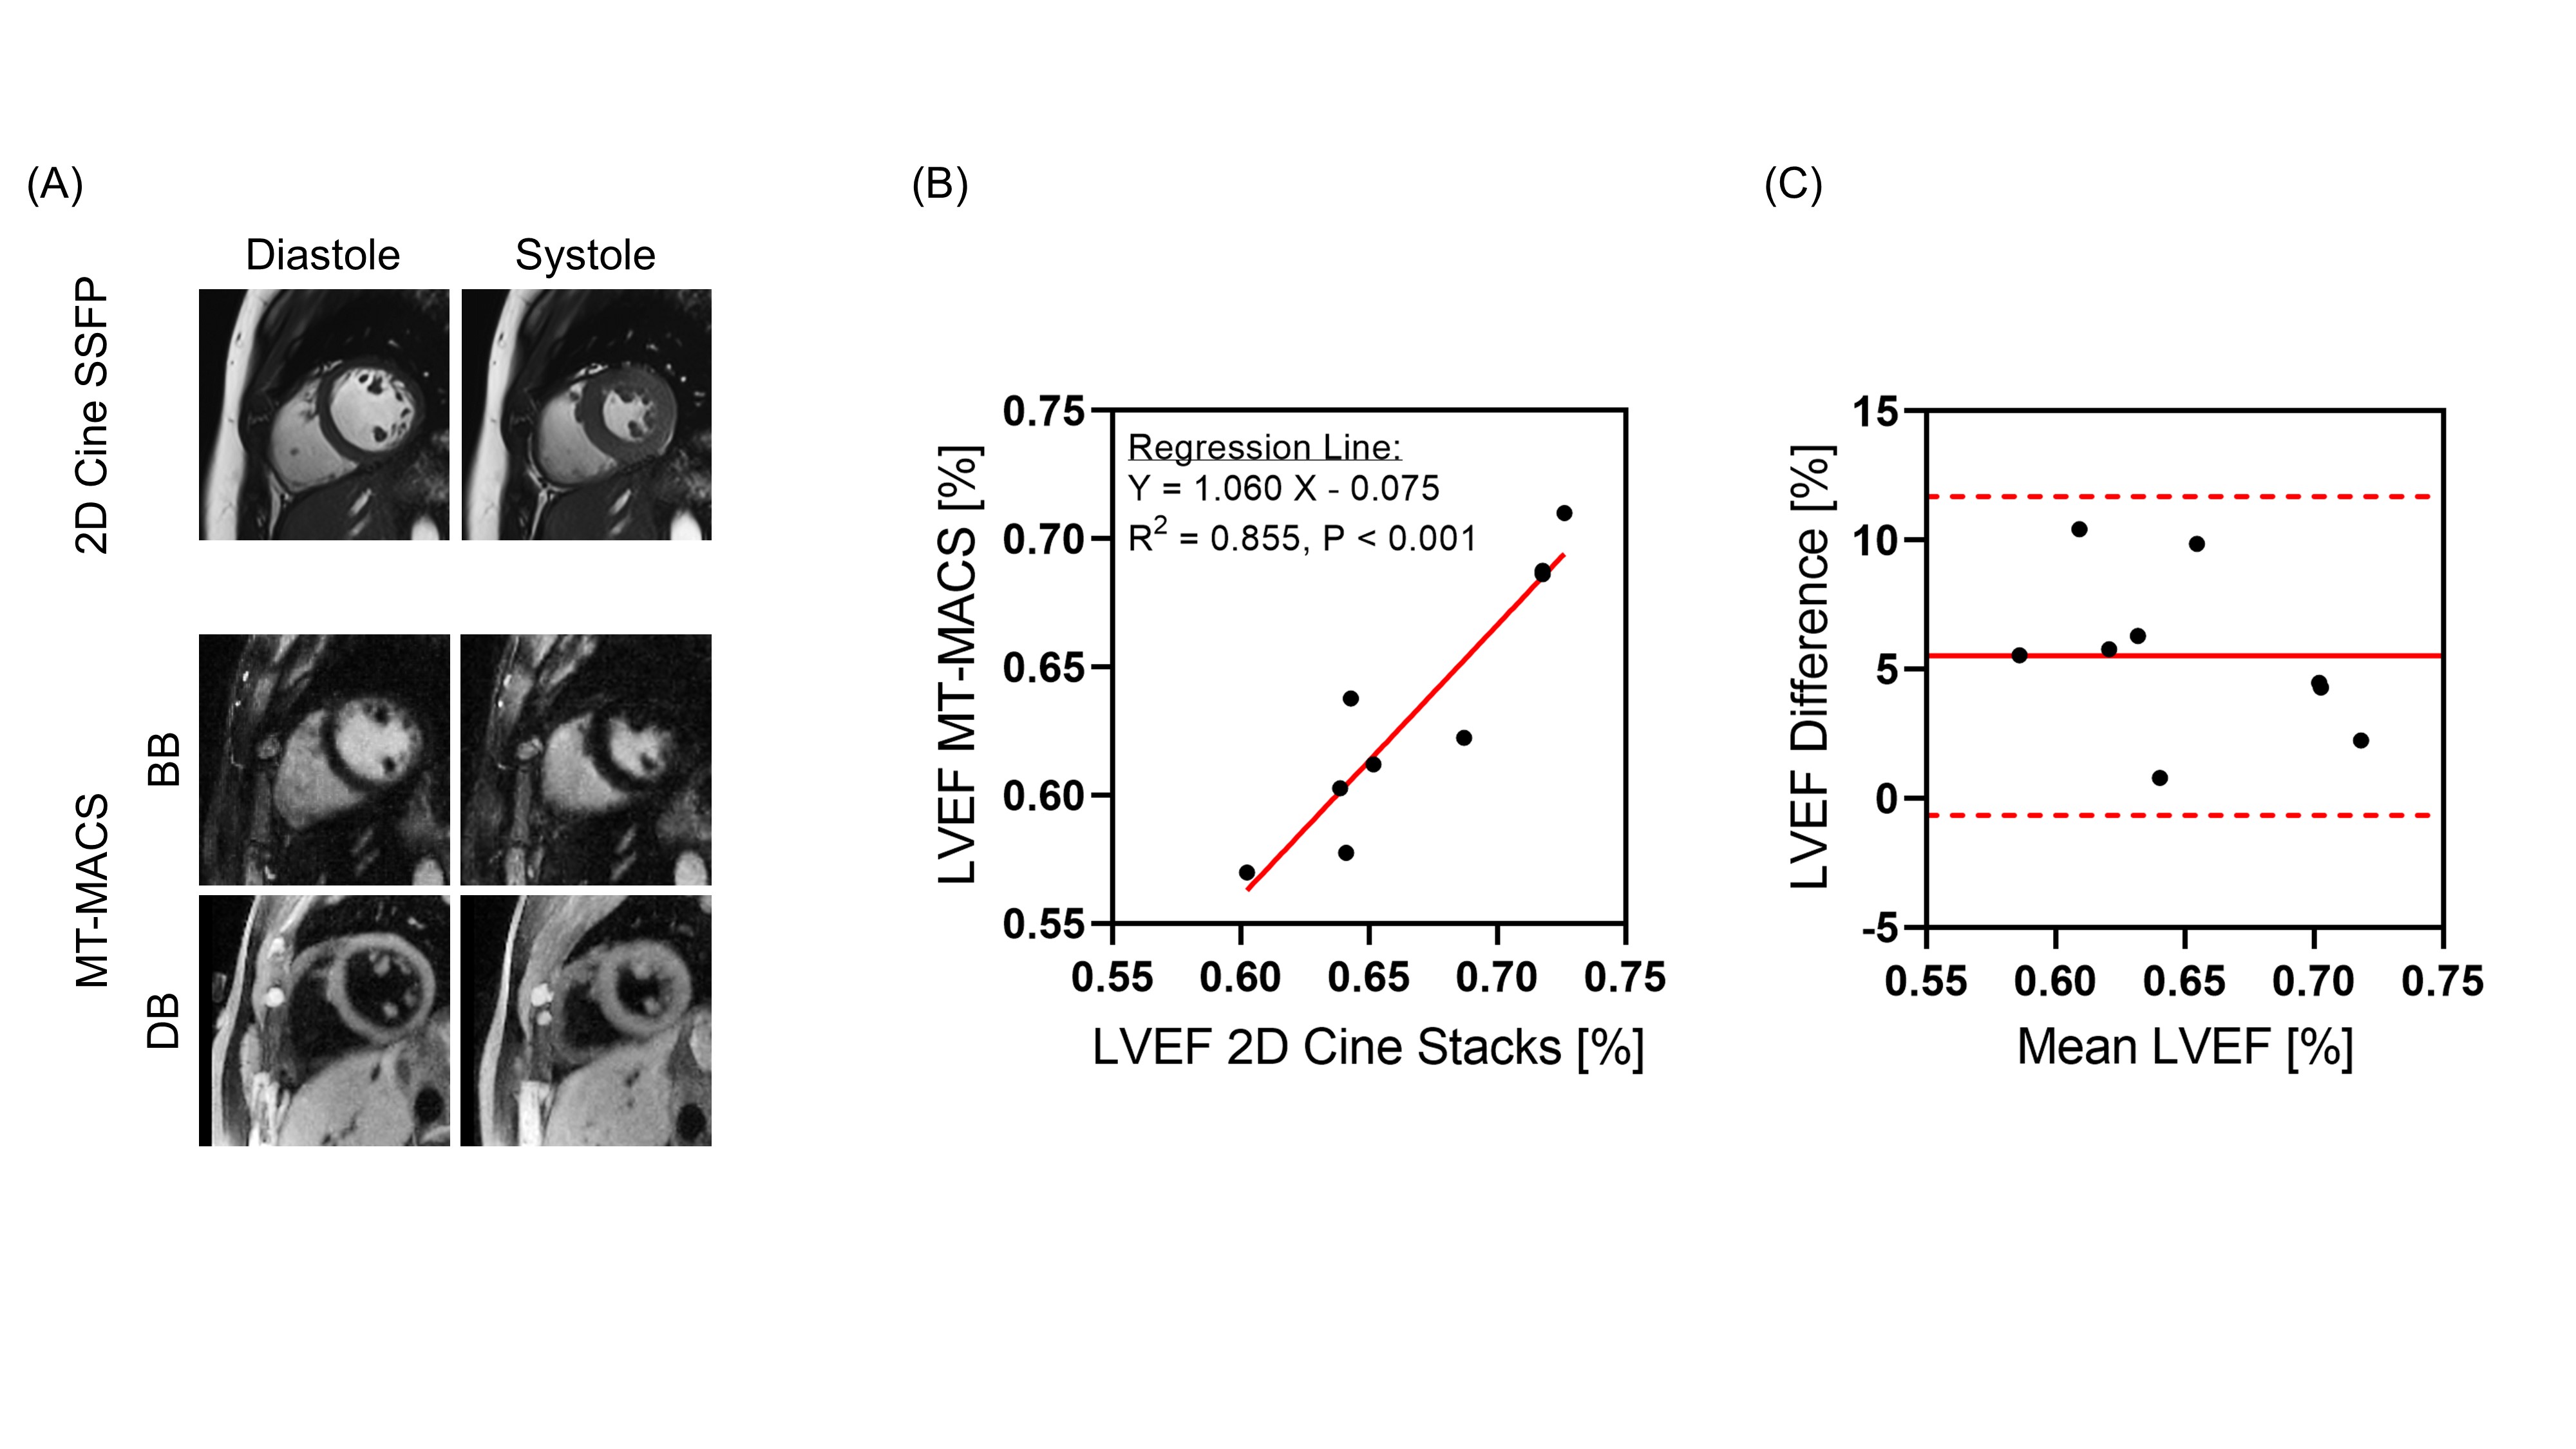
Figure 2 shows example images generated by MT-MACS, including water-only multi-contrast whole-heart anatomical images and corresponding cine series, together with fat-only images. A total of 36 3D image sets (3 water-only contrasts and 1 fat-only) were scored for image quality. For water-only images with three representative contrasts, cardiac chambers and thoracic aorta were evaluated separately (Table 1). MT-MACS provided slightly lower LVEF measurements compared with Cine SSFP (Regression line: Y=1.060X–0.075; R2=0.855, P<0.001), but the overall values were still within the physiological range8 (Figure 3). MT-MACS quantified the wall thickness of each cardiac chamber at their own optimal DB phases, thanks to the flexible image contrasts (Figure 4A). The thicknesses were 2.52 ± 0.19 mm, 8.99 ± 0.53 mm, 2.50 ± 0.21 mm, and 4.32 ± 0.78 mm, respectively for LA, LV, RA, and RV, which are all within the normal anatomical range9-12. The cardiac structures on 2D T2-TSE images from 2 subjects were substantially blurred due to respiratory motion and were therefore excluded from analysis. Good agreement was observed between MT-MACS and TSE in the remaining 7 subjects (Figure 4B).Discussion
MT-MACS provides a comprehensive ECG- and navigator-free assessment of cardiac and great vessel anatomy within a single 10-minute scan. By adopting the MR multitasking framework, the cardiac image is modeled as a multidimensional low-rank tensor, which contains a cardiac motion, an inversion recovery and a multi-echo time dimension for phase-resolved cardiac cine imaging, multi-contrast assessment, and water/fat separation, respectively. Furthermore, the continuous data acquisition scheme eliminates the need for ECG triggering, respiratory navigators or breath-holds, and provides flexible image contrasts for better cardiac chamber delineation, which can greatly simplify the acquisition workflow and potentially improve interpretation accuracy.Conclusion
In this work, we developed an MT-MACS technique for comprehensive assessment of the combined cardiac and thoracic aortic system. Further clinical validation is underway.Acknowledgements
This work was supported by NIH 1R01EB028146 and 1R01HL147355.References
1. Pushparajah K, Duong P, Mathur S, Babu-Narayan SV. EDUCATIONAL SERIES IN CONGENITAL HEART DISEASE: Cardiovascular MRI and CT in congenital heart disease. Echo research and practice 2019;6(4):R121-R138.
2. Milotta G, Ginami G, Cruz G, Neji R, Prieto C, Botnar RM. Simultaneous 3D whole‐heart bright‐blood and black blood imaging for cardiovascular anatomy and wall assessment with interleaved T2prep‐IR. Magnetic resonance in medicine 2019;82(1):312-325.
3. Leiner T, Bogaert J, Friedrich MG, Mohiaddin R, Muthurangu V, Myerson S, Powell AJ, Raman SV, Pennell DJ. SCMR Position Paper (2020) on clinical indications for cardiovascular magnetic resonance. Journal of Cardiovascular Magnetic Resonance 2020;22(1):1-37.
4. Feng L, Coppo S, Piccini D, Yerly J, Lim RP, Masci PG, Stuber M, Sodickson DK, Otazo R. 5D whole‐heart sparse MRI. Magnetic resonance in medicine 2018;79(2):826-838.
5. Hu Z, Christodoulou AG, Wang N, Shaw JL, Song SS, Maya MM, Ishimori ML, Forbess LJ, Xiao J, Bi X. Magnetic resonance multitasking for multidimensional assessment of cardiovascular system: Development and feasibility study on the thoracic aorta. Magnetic Resonance in Medicine 2020.
6. Christodoulou AG, Shaw JL, Nguyen C, Yang Q, Xie Y, Wang N, Li D. Magnetic resonance multitasking for motion-resolved quantitative cardiovascular imaging. Nature biomedical engineering 2018;2(4):215-226.
7. Coombs BD, Szumowski J, Coshow W. Two‐point Dixon technique for water‐fat signal decomposition with B0 inhomogeneity correction. Magnetic resonance in medicine 1997;38(6):884-889.
8. Kosaraju A, Makaryus AN. Left ventricular ejection fraction. 2019.
9. Takahashi K, Okumura Y, Watanabe I, Nagashima K, Sonoda K, Sasaki N, Kogawa R, Iso K, Ohkubo K, Nakai T. Relation between left atrial wall thickness in patients with atrial fibrillation and intracardiac electrogram characteristics and ATP‐provoked dormant pulmonary vein conduction. Journal of Cardiovascular Electrophysiology 2015;26(6):597-605.
10. Bishop M, Rajani R, Plank G, Gaddum N, Carr-White G, Wright M, O'Neill M, Niederer S. Three-dimensional atrial wall thickness maps to inform catheter ablation procedures for atrial fibrillation. Europace 2016;18(3):376-383.
11. Yoneyama K, Venkatesh BA, Bluemke DA, McClelland RL, Lima JA. Cardiovascular magnetic resonance in an adult human population: serial observations from the multi-ethnic study of atherosclerosis. Journal of Cardiovascular Magnetic Resonance 2017;19(1):52.
12. Ho S, Nihoyannopoulos P. Anatomy, echocardiography, and normal right ventricular dimensions. Heart 2006;92(suppl 1):i2-i13.
Figures