0172
Towards optimizing MR vascular fingerprinting1Univ. Grenoble Alpes, Inserm, U1216, Grenoble Institut Neurosciences, GIN, 38000, Grenoble, France, 2Univ. Grenoble Alpes, Inria, CNRS, G-INP, 38000, Grenoble, France
Synopsis
MR vascular fingerprinting aims at mapping cerebral vascular properties. We propose to improve the method on two levels: (1) by testing new acquisitions patterns using a Monte-Carlo based method that assesses the encoding capacity of MRF sequences; and (2) by testing new geometrical models that represent vascular networks during dictionary simulations. We obtained results suggesting that new MRF-type sequences can be tailored for vascular exploration and should be tested in vivo. We also showed the clear influence of geometry in the simulations and the possibility to include realistic vascular networks.
Introduction
MR vascular fingerprinting1 (MRvF) proposes to use the Magnetic Resonance Fingerprinting2 (MRF) framework to map cerebral microvascular properties. The initial MRvF implementation used the GESFIDSE (Gradient Echo Sampling of the FID and Spin Echo) sequence to measure blood oxygenation saturation (SO2), blood volume fraction (Vf) and vessel averaged radius (R). We propose to improve this method by: (1) testing new acquisitions patterns using a Monte-Carlo (MC) based method that assesses the encoding capacity of MRF dictionaries3 (2) testing new 3D representations of the vascular network on one pattern to produce the dictionary for MRvF data analysis. These 3D vascular networks include generated 3D voxels with various vascular networks as well as realistic vascular structures segmented from ex vivo microscopy. Until now, only 2D geometries have been used.Materials & Methods
Healthy and 9L tumor-implanted rats are imaged with a 4.7T Bruker system. A GESFIDSE sequence (32 echoes, SE=60ms) is acquired pre and post injection of USPIO (P904, Guerbet, France, 200µmol Fe/kg)4. Data processing is performed using MP35, a Matlab (The MathWorks Inc., Natick, Ma, USA) based home-made image processing software. Dictionaries are generated with MRVox6 (Matlab), using 2D or 3D geometries (cf. below), and dictionary matching is performed using direct distance minimization or a regression-based algorithm7.Testing new acquisition patterns with MC approach:
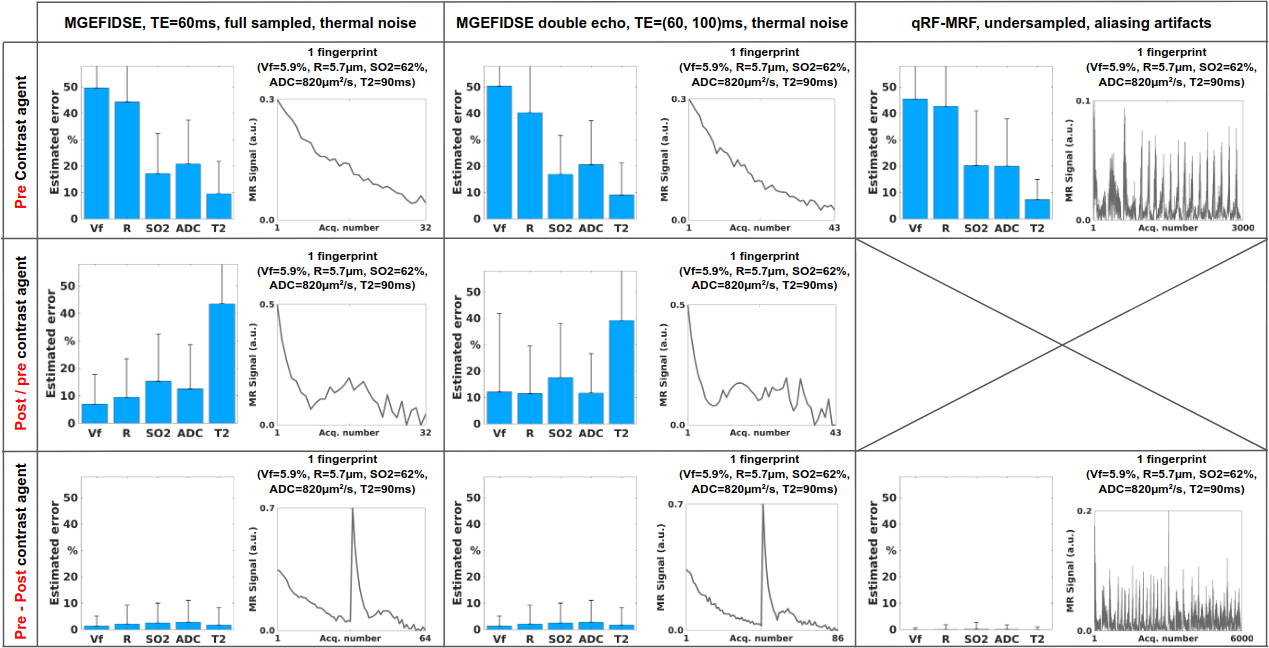
- We compare three sequences: the original GESFIDSE (TE=60ms), a double spin echo GESFIDSE (TE=60 & 100ms), and a qRF-MRF sequence originally designed for T2* measurements8. Using contrast agent (CA) injection, three patterns are evaluated: pre CA alone, ratio pre/post CA, and concatenation pre-post CA.
- For each sequence, we generate 10 000 signals before and after CA injection with MRVox. 5 parameters are considered: Vf=[1:10] % R=[1:10] µm, SO2=[0.35:0.9] %, T2=[45:110] ms and ADC=[600:1200] µm2/s.
- For the MC test, noise is added to the simulations to account for the acquisition process: Thermal noise for fully-sampled GESFIDSE acquisitions (duration: 6min30s) with a normal distribution (µ=0, σ=Signal/SNR, with SNR = 20); Aliasing artifacts3 for the qRF-MRF acquisition (duration: 3 min), with a normal distribution (µ=0 and σ=mean(signal)/SNR, with SNR=4). See Fig. 1 for noisy signals examples.
- Parameter and error evaluations are performed 2000 times on 50 entries equally distributed in the parameter space. Each repetition corresponds to a new noise generation.
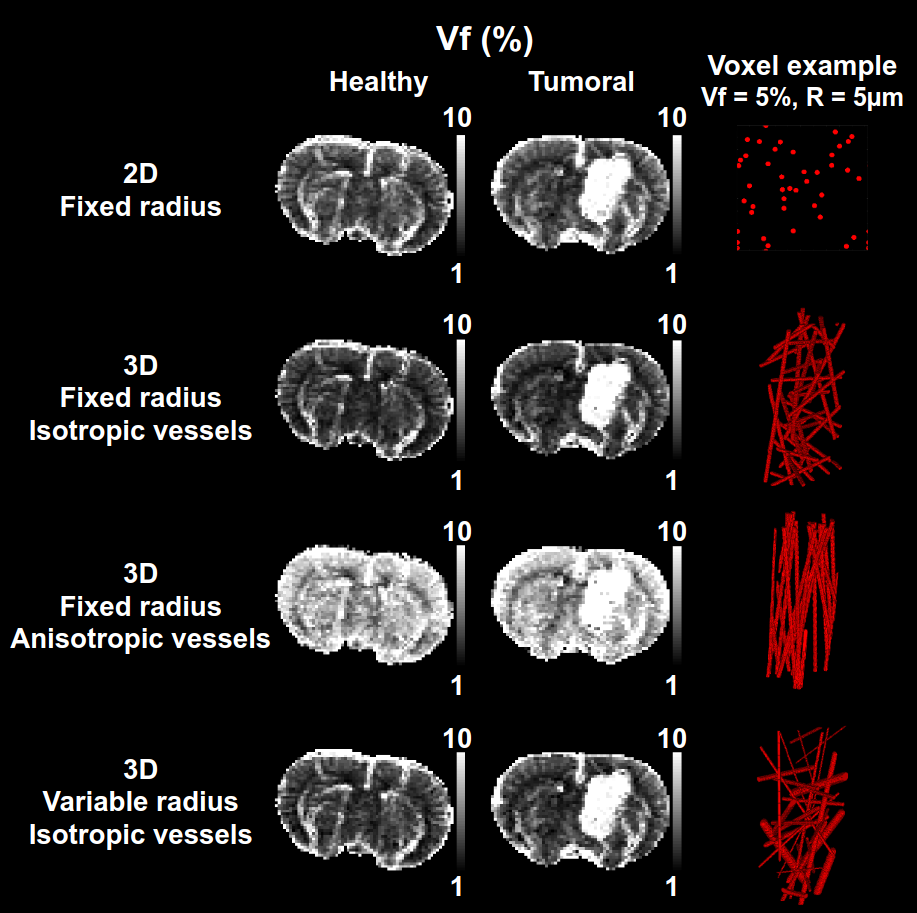
- 4 dictionaries based on cylinders: one with 2D geometries and three with 3D geometries are generated. For 2D, the vessel radius is fixed in the plane. For 3D, one dictionary has vessels with fixed radii and isotropic orientations, one has fixed radii and anisotropic orientations, and the last has distributed radii and isotropic orientations (see Fig. 4). Each dictionary contains 15 000 signals with similar parameters as above.
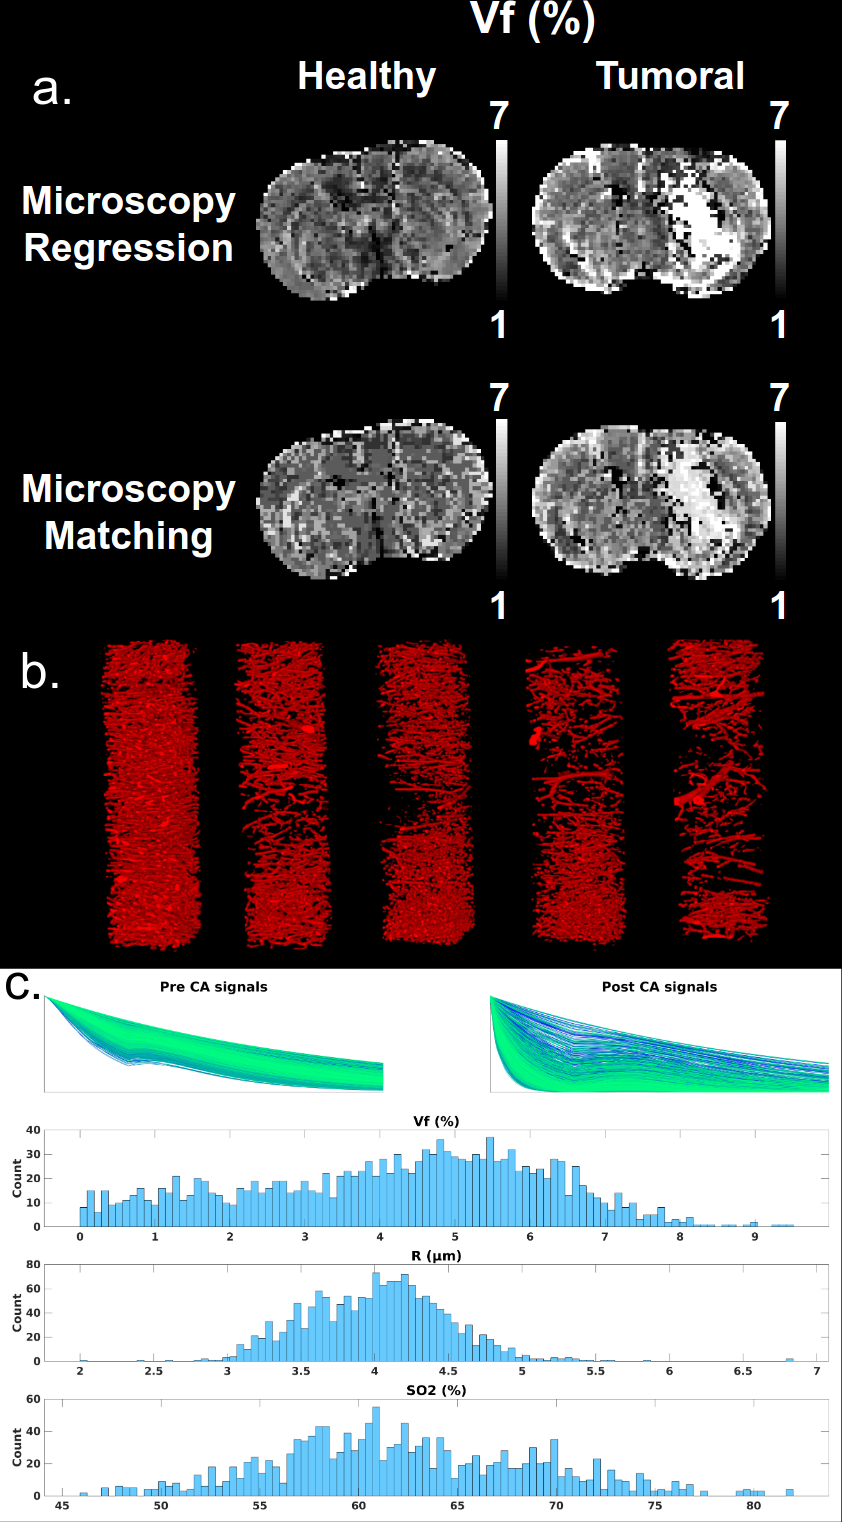
- 1 dictionary based on real 3D microvascular networks: ex vivo images from microscopy acquisitions9 were segmented. Due to the long segmentation process, only 1538 signals were obtained. Fig. 5c presents an overview of the parameters’ distributions.
Results
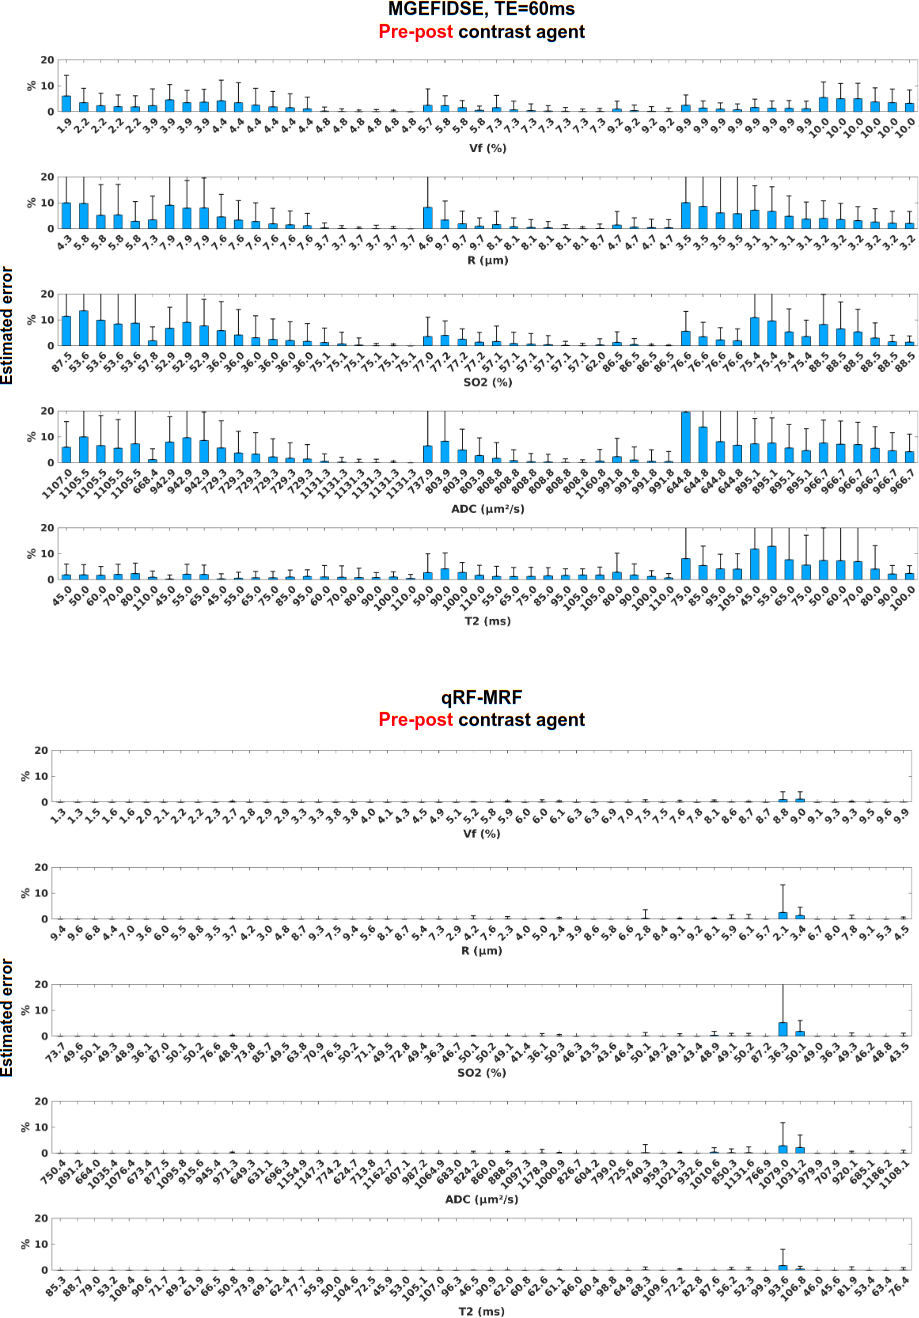
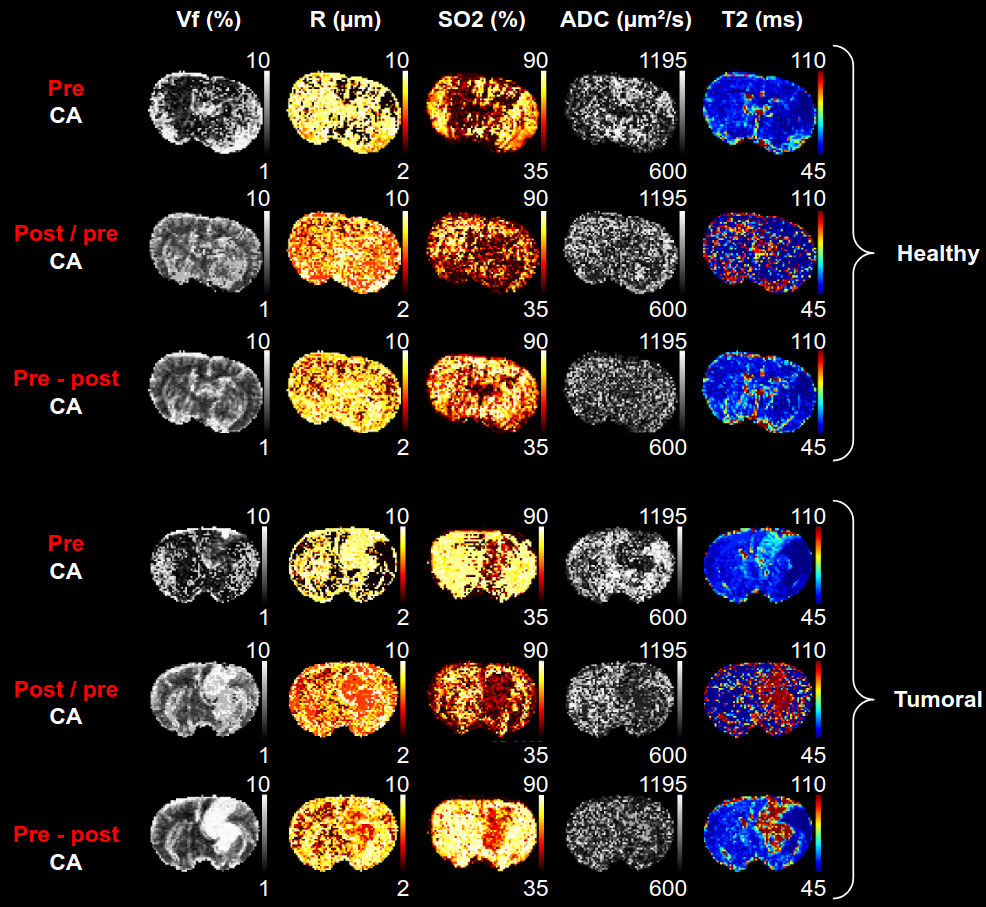
Based on MC reconstruction errors (Fig. 1), the pre CA patterns alone seem to perform poorly on all metrics (even with qRF-MRF with about 100 times more data points than the GESFIDSE (3000 vs. 32)). The ratio pattern performs better on Vf and R estimates (benefit of CA10), but does not improve the SO2 estimates. T2 estimates are expected to be lower as the exponential component of the signal is cancelled. The concatenation brings the best GESFIDSE results for all three sequences, with large improvement on all parameters. Error depends on parameter values (Fig. 2). The double echo GESFIDSE does not show any improvement over the classical GESFIDSE. The qRF-MRF with concatenation exhibits excellent results for all parameters (Fig. 1 & 2), with a tenfold error reduction compared to classical GESFIDSE.Figure 3 compares the three GESFIDSE patterns on animal data. The results are in good agreement with the previous MC results. Yet, in all cases, the ADC map has poor contrasts, and the T2 is generally too low.
Whatever the geometrical model, healthy and tumoral tissues show the expected contrast, except for the anisotropic vessels orientations (Fig. 4). The 2D case has globally higher values than the first and third 3D cases. This is in agreement with theoretical results (not shown here). The poor results obtained with the anisotropic orientations of vessels demonstrate that the model geometry can influence the quality of the estimations. Fig 5 shows that even with a small number of signals originating from realistic microscopy data, the regression algorithm is able to produce correct contrasts in the healthy tissues. The tumoral environment seems more challenging with the available data.
Conclusions
We successfully tested the MC framework3 to assess the ability of MRF to map microvascular estimates using various acquisition patterns. The good results obtained with the qRF acquisitions suggest that new MRF-type sequences can be tailored for vascular exploration and should therefore be tested in vivo. The vascular geometry used to simulate the dictionary has a clear influence on the results. The use of realistic vascular networks appears here as a promising solution.Acknowledgements
The MRI facility IRMaGe is partly funded by the French program “Investissement d’avenir” run by the French National Research Agency, grant “Infrastructure d’avenir en Biologie et Santé”. [ANR-11-INBS-006]References
1. T. Christen et al., « MR vascular fingerprinting: A new approach to compute cerebral blood volume, mean vessel radius, and oxygenation maps in the human brain », NeuroImage, vol. 89, p. 262‑270, avr. 2014, doi: 10.1016/j.neuroimage.2013.11.052.
2. D. Ma et al., ‘Magnetic resonance fingerprinting’, Nature, vol. 495, no. 7440, pp. 187–192, Mar. 2013, doi: 10.1038/nature11971.
3. K. Sommer et al., ‘Towards predicting the encoding capability of MR fingerprinting sequences’, Magn Reson Imaging, vol. 41, pp. 7–14, 2017, doi: 10.1016/j.mri.2017.06.015.
4. B. Lemasson et al., ‘In vivo imaging of vessel diameter, size, and density: A comparative study between MRI and histology’, Magnetic Resonance in Medicine, vol. 69, no. 1, pp. 18–26, 2013, doi: 10.1002/mrm.24218.
5. C. Brossard et al., ‘MP3: Medical Software for Processing Multi-Parametric Images Pipelines’, Front. Neuroinform., vol. 14, 2020, doi: 10.3389/fninf.2020.594799.
6. N. A. Pannetier et al., ‘A Simulation Tool for Dynamic Contrast Enhanced MRI’, 2013. https://journals.plos.org/plosone/article?id=10.1371/journal.pone.0057636 (accessed Oct. 10, 2019).
7. C. Y. Wang et al., ‘Magnetic resonance fingerprinting with quadratic RF phase for measurement of T2* simultaneously with δf, T1, and T2’, Magnetic Resonance in Medicine, vol. 81, no. 3, pp. 1849–1862, 2019, doi: https://doi.org/10.1002/mrm.27543.
8. A. P. Di Giovanna, ‘Whole-brain vasculature reconstruction at the single capillary level’, Harvard Dataverse, 2018, https://dataverse.harvard.edu/dataverse/mouse-brain_vasculature
9. F. Boux et al., 'Bayesian inverse regression for vascular magnetic resonance fingerprinting', HAL preprint hal-02314026v2 (2020).
10. I. Troprès et al., ‘Vessel size imaging’, Magnetic Resonance in Medicine, vol. 45, no. 3, pp. 397–408, 2001, doi: 10.1002/1522-2594(200103)45:3<397::AID-MRM1052>3.0.CO;2-3.
Figures