0171
Simultaneous comprehensive T1, T2, T2*, T1Ρ and Fat Fraction characterization with Magnetic Resonance Fingerprinting1School of Biomedical Engineering and Imaging Sciences, King's College London, London, United Kingdom
Synopsis
Quantitative T1, T2, T2* and fat fraction maps are promising imaging biomarkers for the assessment and follow-up of liver disease, while T1⍴ mapping has been reported to be a valuable tool for contrast-free assessment of liver fibrosis. However, these multiple scans are usually performed sequentially during separate breath-holds, leading to long scan times and potentially mis-registered maps. In this study we propose an 8-echo T1, T2 and T1⍴ prepared liver MRF sequence that allows for quantitative T1, T2, T2*, T1⍴ and FF liver tissue characterization in a single breath-hold scan. The proposed approach has been investigated in healthy subjects.
Introduction
Quantitative T1, T2, T2* and fat fraction (FF) maps are promising imaging biomarkers for the assessment and follow-up of liver disease1. In addition, T1⍴ mapping has been reported to be a valuable tool for the contrast-free assessment of liver fibrosis2. However, these multiple scans are usually performed sequentially during separate breath-holds, leading to long scan times and potentially mis-registered maps. Magnetic resonance fingerprinting (MRF) has been recently shown to enable simultaneous quantification of T1, T2, T2* and FF maps of the abdominal region1 from a single scan. In this study we propose to further extend this MRF framework to enable simultaneous co-registered T1, T2, T2*, T1⍴ and FF quantification in a single breath hold scan of ~18s, in order to allow for fully comprehensive liver tissue characterization.Methods
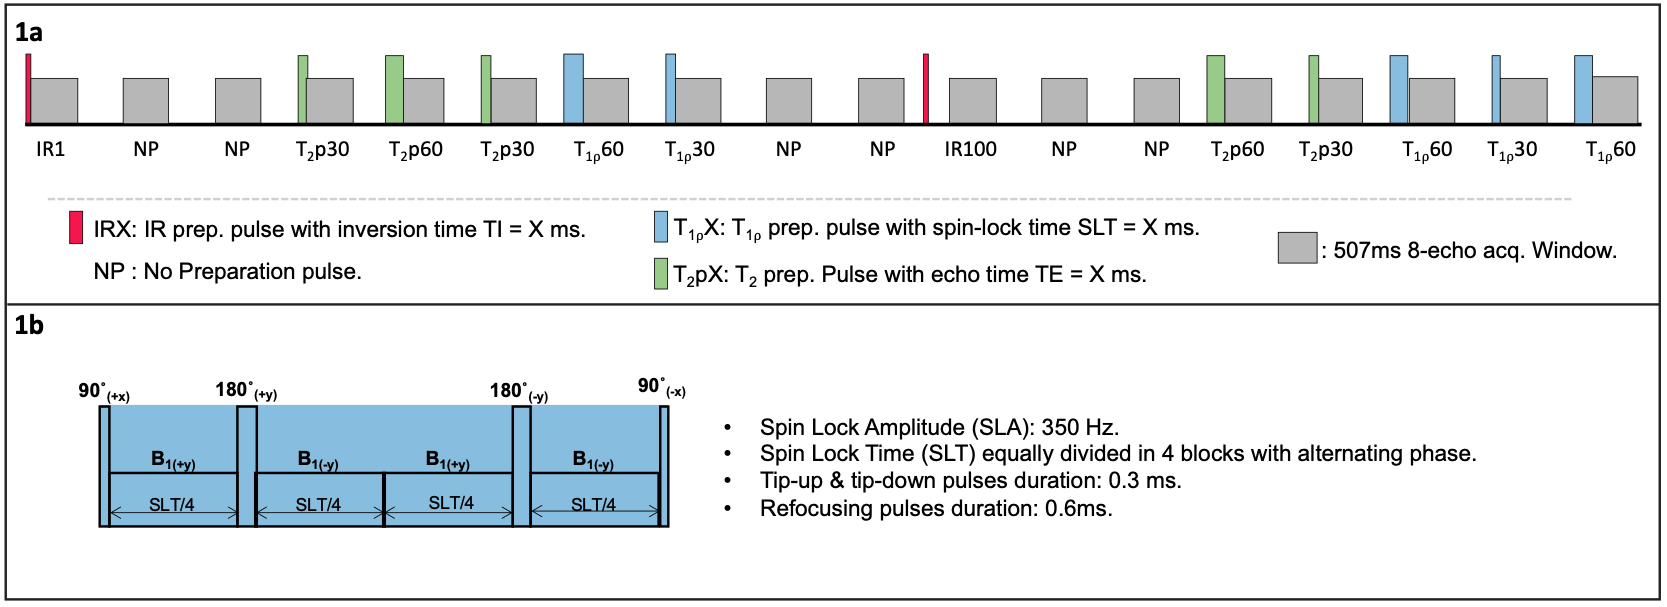
An 8-echo gradient echo liver MRF sequence with low flip angle (FA = 15°), varying magnetization preparation and golden angle radial trajectory is proposed (Figure 1a). This liver MRF acquisition includes two inversion recovery (IR) pulses, five T2 preparation (T2prep) pulses, five Spin Lock pulses (T1⍴ prep) of Spin Lock Amplitude (SLA) = 350 Hz and six additional shots in which no magnetization preparation is applied, leading to a total of 18 acquisition blocks of ~500ms duration each. Relevant acquisition parameters include TR/TE1/ΔTE= 16.9/1.5/2 ms, 2×2 mm2 resolution, 8 mm slice thickness and acquisition time ~18s. Reconstruction is performed using a multi-contrast patch-based higher-order low-rank reconstruction (HD-PROST)3 with dictionary-based temporal compression. Temporally compressed singular images approximating the MRF time‐series are reconstructed for each echo using HD‐PROST. Graph-cut water/fat separation4 is used to estimate T2* and B0 from the first singular image. Water and fat singular images are then matched (using dot‐product) to a previously generated MRF dictionary to obtain the water‐ and fat‐specific T1, T2, T1⍴ and relative M0 maps.The proposed approach was evaluated in 5 subjects on a 1.5T scanner (Ingenia, Philips Healthcare) and compared against conventional individual single breath hold maps (T1-MOLLI, T2-GraSE, Multiecho GRE, T1⍴ prepared single breath-hold scan and Proton Density Fat Fraction PDFF, for T1, T2,T2*, T1⍴ and FF estimation respectively).
Results
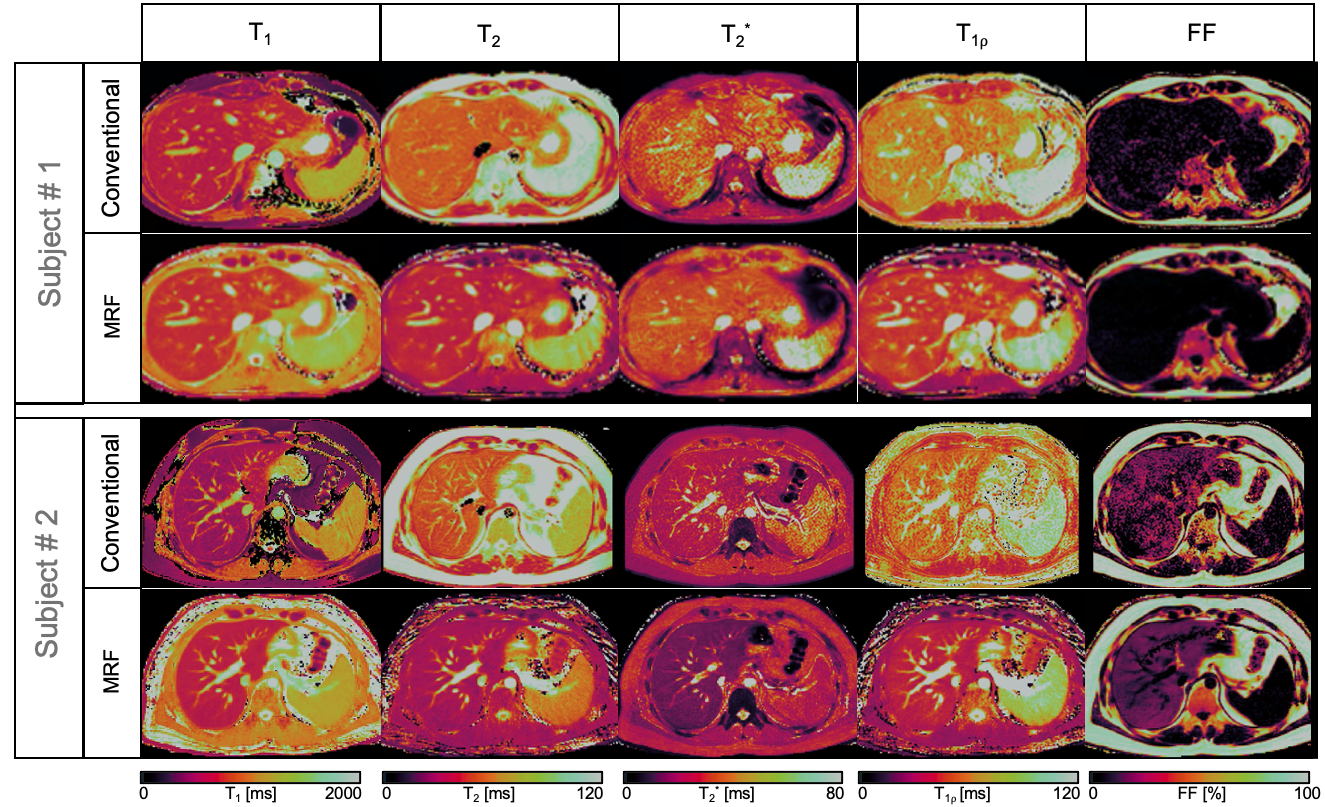
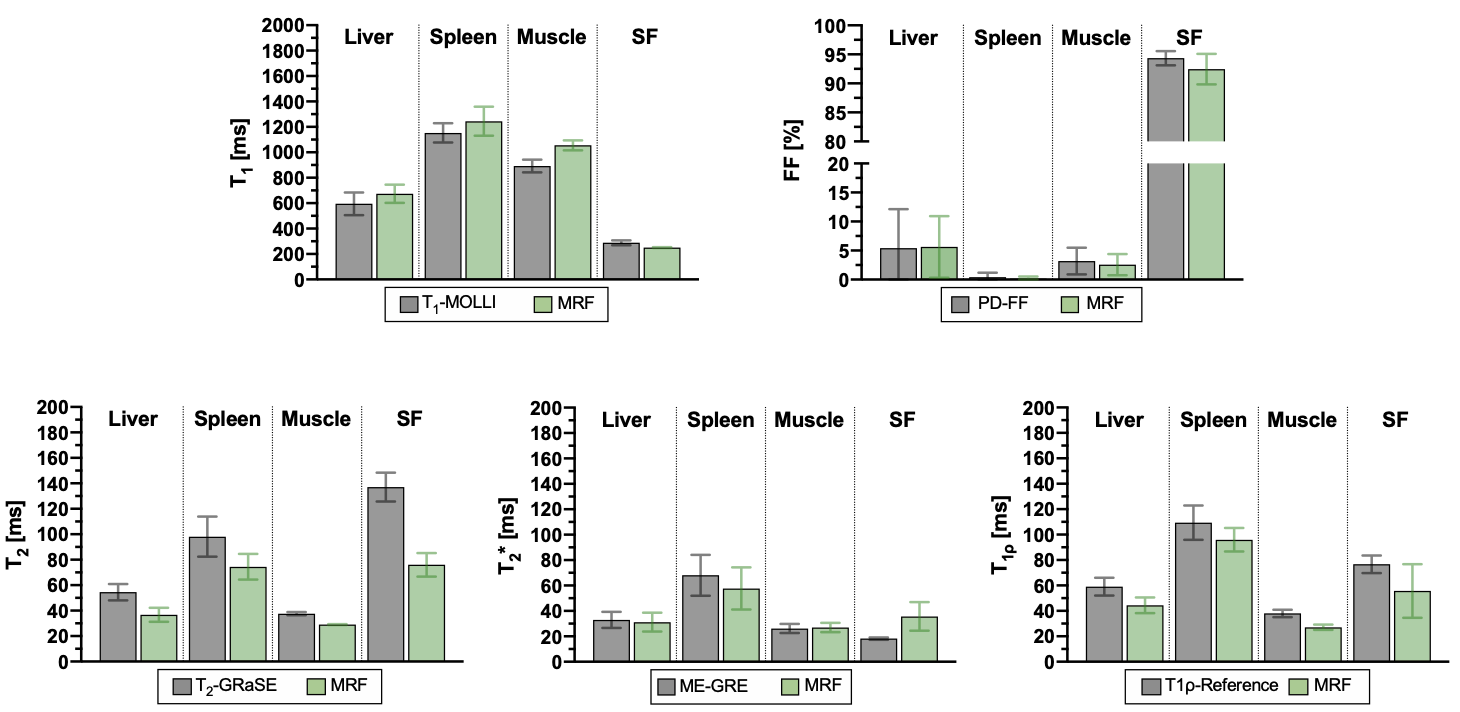
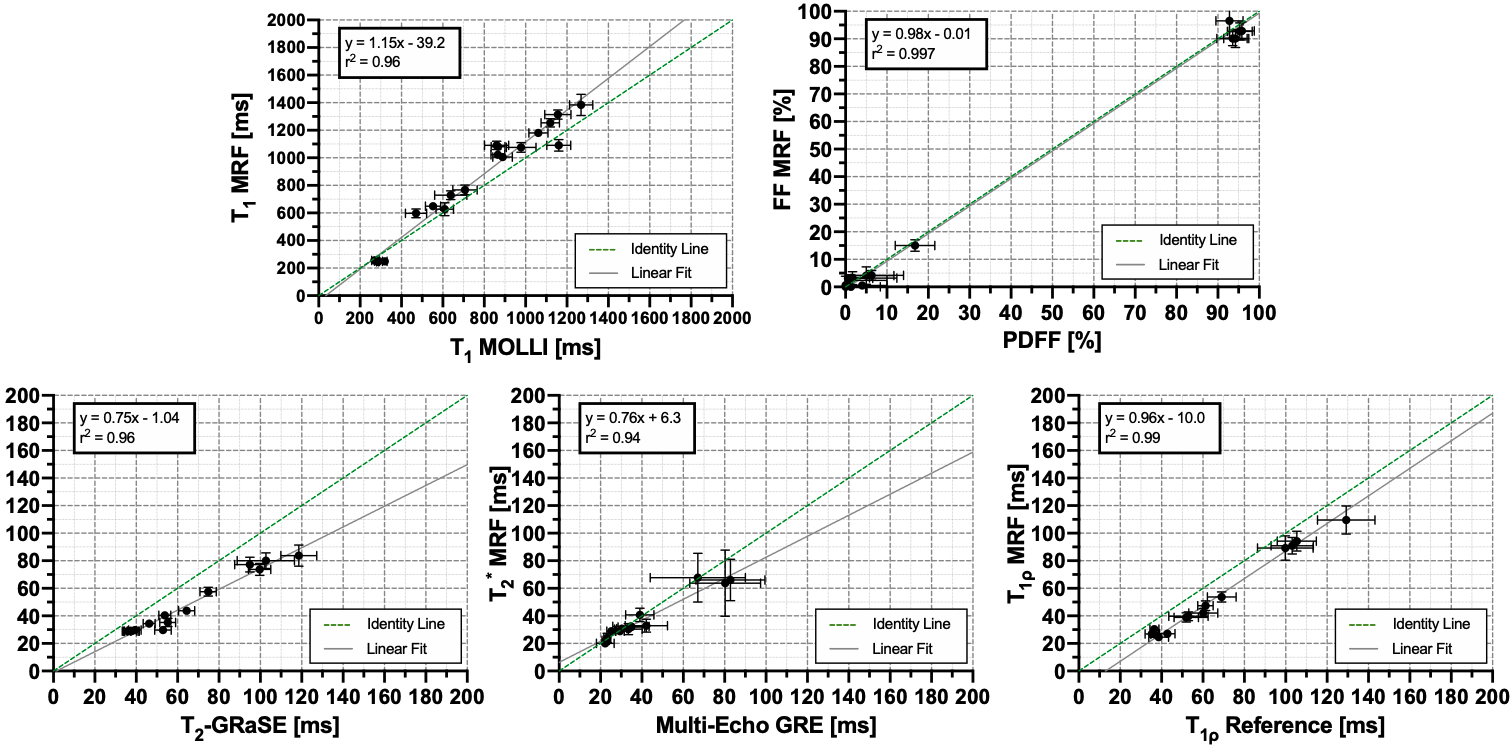
A comparison between the maps obtained with the proposed MRF technique and reference maps is shown in Figure 2 for two representative subjects. One of the subjects presented with previously diagnosed mild liver steatosis. This mild elevation of fat percentage in liver tissue can be observed in the proposed FF-MRF map and was confirmed by the reference PDFF. Quantitative MRF-derived T1, T2, T2*, T1⍴ and FF values measured within ROIs manually drawn inside the liver, spleen, erector spinae muscle and subcutaneous fat were compared against their corresponding references. The quantitative analysis is shown in Figures 3 and 4. A slight overestimation of T1 and underestimation of T2 with the proposed MRF sequence with respect to reference scans can be observed, which is consistent with previous findings5. The average values measured within each ROI are statistically different from the reference scans (p<0.05) for T1, T2, T2* and T1⍴ but not for FF, whereas correlation between MRF and reference values (shown in Figure 4) is excellent for each parameter (r2 = 0.96, r2 = 0.96, r2 = 0.94, r2 = 0.99 and r2 = 0.997 for T1, T2, T2*,T1⍴ and FF respectively).Conclusion
The proposed 8-echo IR, T2 and T1⍴ prepared liver MRF sequence presented in this work allows for quantitative T1, T2, T2*, T1⍴ and FF liver tissue characterization in a single breath-hold scan. Further, T1⍴ quantification with the proposed approach provides additional information and may improve the diagnostic power of multiparametric liver tissue characterization, especially in presence of liver fibrosis. Future work will aim to validate the proposed approach in patients with liver disease.Acknowledgements
This work was supported by EPSRC (EP/P001009, EP/P032311/1, EP/P007619/1) and Wellcome EPSRC Centre for Medical Engineering (NS/ A000049/1).References
1. Jaubert, O. et al. Magn Reson. Med. 2020; 84: 2625-2635. Doi:10.1002/mrm/28311.
2. Allkemper T, et al. Radiology. 2014; 271(2):408-15. doi:10.1148/radiol.13130342.
3. Bustin A et al. Magn Reson Med. (2019). 81(6):3705-3719. doi:10.1002/mrm.27694.
4. Hernando, D., et al. Magn. Reson. Med. 63, 79–90 (2010).
5. Hamilton, J. I. et al. Magn Reson Med 77, 1446–1458 (2017).
6. Qi H. et al. J Cardiovasc Magn Reson 22, 12 (2020). doi:10.1186/s12968-020-0597-5.
Figures