0166
Simultaneous morphometry and relaxometry of the human brain using three-dimensional MR fingerprinting at 1.5 and 3T
Shohei Fujita1,2, Matteo Cencini3,4, Guido Buonincontri3,4, Naoyuki Takei5, Rolf F. Schulte6, Wataru Uchida1, Akifumi Hagiwara1, Koji Kamagata1, Osamu Abe2, Michela Tosetti3,4, and Shigeki Aoki1
1Department of Radiology, Juntendo University, Tokyo, Japan, 2Department of Radiology, The University of Tokyo, Tokyo, Japan, 3Imago7 Foundation, Pisa, Italy, 4IRCCS Stella Maris, Pisa, Italy, 5MR Applications and Workflow, GE Healthcare, Tokyo, Japan, 6GE Healthcare, Munich, Germany
1Department of Radiology, Juntendo University, Tokyo, Japan, 2Department of Radiology, The University of Tokyo, Tokyo, Japan, 3Imago7 Foundation, Pisa, Italy, 4IRCCS Stella Maris, Pisa, Italy, 5MR Applications and Workflow, GE Healthcare, Tokyo, Japan, 6GE Healthcare, Munich, Germany
Synopsis
Magnetic resonance fingerprinting (MRF) permits simultaneous acquisition of T1 and T2 maps perfectly aligned to the anatomy, allowing morphometry and relaxometry analysis of the brain in a single scan. Here, we examined the reproducibility and repeatability of simultaneous morphology and relaxometry of brain structures in healthy volunteers using three-dimensional MRF at multiple field strengths. Scan-rescan tests of three-dimensional MRF were performed at 1.5 and 3T. The local thickness, volume, T1, and T2 values were calculated for each representative neuroanatomical structure using automatic brain segmentation software. These results can help establish imaging biomarkers using MRF for clinical use.
Introduction
Combined analysis of morphometry and relaxometry has been applied to tasks including automatic detection and quantification of lesions and local brain regions.1,2 While morphological information and relaxation times could allow for a more robust and comprehensive tissue evaluation, multiple separate scans require longer imaging times and lead to unavoidable misalignment that can be problematic. Magnetic resonance fingerprinting (MRF) permits simultaneous acquisition of T1 and T2 maps perfectly aligned to the anatomy, allowing morphometry and relaxometry of the brain in a single scan.3 Making clinical decisions based on MRF scans requires the detection of local changes in anatomically meaningful regions. However, studies focusing on the reliability of MRF have been mainly performed in a voxel-wise manner, and few studies have analyzed brain structure-wise morphometry and relaxometry using MRF, despite their clinical importance. Therefore, we aimed to evaluate the reproducibility and repeatability of three-dimensional (3D) MRF-based simultaneous morphometry and relaxometry of the brain in healthy volunteers using scan-rescan tests of 3D MRF at 1.5T and 3T.Methods
This study included 10 healthy volunteers (8 men and 2 women; age range, 28–43 years). All participants underwent scan-rescan tests of 3D MRF using a 1.5T scanner (Signa HDxt, GE Healthcare, Waukesha, WI, USA) and a 3T scanner (Discovery 750 w, GE Healthcare). The participants were repositioned between scans. The 3D MRF sequence was based on steady-state free precession with spiral projection k-space acquisition.4,5 The acquisition parameters were as follows: field of view, 225×225×225 mm; matrix size, 200×200×200; and acquisition time, 9 min 3 s for both 1.5T and 3T. A dictionary was generated using the extended phase graph formalism, and quantitative maps were obtained by inner-product pattern matching.3MRF-derived T1 maps were post-processed voxel-wise to generate synthetic T1-weighted images using the equation $$$S=1-2e^{-TI/T1}$$$, where S is the output signal, T1 is the T1 value obtained using MRF, and TI is the inversion time virtually set to 1300 ms. These MRF-derived T1-weighted images were imported to FreeSurfer (Version 6.0)6 to obtain local cortical thickness, subcortical volume, and the T1 and T2 values for each representative neuroanatomical region in the Desikan-Killiany atlas.7 The within-subject coefficient of variation (wCV) was used to assess the repeatability for each metric at 1.5T and 3T. The percent relative difference and intraclass correlation coefficient (ICC) were used to assess the inter-field-strength reproducibility of morphological measurements.
Results
Representative parcellations of 3D MRF-derived T1-weighted images using both 1.5T and 3T are shown in Figure 1.Measurement of Cortical Structures
The wCVs of local thickness, T1, and T2 across all cortical structures at 1.5T were 1.9 ± 0.9%, 0.5 ± 0.2%, and 1.9 ± 0.9%, respectively, while those at 3T were 1.9 ± 0.9%, 0.4 ± 0.2%, and 1.9 ± 0.7%, respectively (Figures 2 and 3). The percent relative difference in cortical thickness across all regions between 1.5T and 3T was 4.2 ± 2.1%. The ICC across all regions between 1.5T and 3T was 0.73 ± 0.12, and 88% of the regional areas showed substantial (ICC > 0.61) to almost perfect (ICC > 0.81) agreement.
Measurement of Subcortical Structures
The wCVs of local volume, T1, and T2 across all subcortical structures at 1.5T were 1.2 ± 0.6%, 0.6 ± 0.3%, and 2.4 ± 0.7%, respectively, while those at 3T were 1.6 ± 1.0%, 0.5 ± 0.1%, and 2.3 ± 0.6%, respectively (Figures 4 and 5). The percent relative difference in cortical thickness across all regions between 1.5T and 3T was 4.4 ± 2.5%. The ICC across all regions was 0.92 ± 0.13, and all regional areas showed substantial (ICC > 0.61) to almost perfect (ICC > 0.81) agreement.
Discussion
3D MRF-derived morphological information and relaxation times showed high repeatability at both 1.5T and 3T. The regional cortical thickness and subcortical volumes showed good agreement between the 1.5T and 3T scans. While voxel-wise evaluation is a more comprehensive way to assess the variance of a given imaging system, local changes should be detected in anatomically meaningful structures to make clinical decisions. This justifies the brain structure-wise analysis employed in this study.At both 1.5T and 3T, the T2 values showed lower repeatability than that of T1 values. This is consistent with the findings of previous studies that evaluated the voxel-wise repeatability of MRF-derived relaxation times.8,9 Although the results are dependent on the segmentation algorithm and cannot be generalized, the use of automatic measurement software is inevitable to obtain a comprehensive set of regional values. We believed that FreeSurfer, which is the most commonly used segmentation software, was the best available option.
The repeatability and reproducibility of the metrics for the discrimination of disease/healthy groups and lesions/non-lesioned areas should be addressed in the future. This is critical because the degree of error in the group-wise variance determines the usefulness of a given metric in the clinical setting.
Conclusion
3D MRF permits simultaneous acquisition of atlas-based morphological information and relaxation times with high repeatability at both 1.5T and 3T. The inter-field-strength reproducibility of 3D MRF-derived cortical thickness and subcortical volumes showed substantial to almost perfect agreement. These results can help establish imaging biomarkers using MRF for clinical use.Acknowledgements
No acknowledgement found.References
- Pell GS, Briellmann RS, Waites AB, et al. Voxel-based relaxometry: a new approach for analysis of T2 relaxometry changes in epilepsy. Neuroimage. 2004;21(2):707-713.
- Specht K, Minnerop M, Müller-Hübenthal J, et al. Voxel-based analysis of multiple-system atrophy of cerebellar type: complementary results by combining voxel-based morphometry and voxel-based relaxometry. Neuroimage. 2005;25(1):287-293.
- Ma D, Gulani V, Seiberlich N, et al. Magnetic resonance fingerprinting. Nature. 2013;495(7440):187-192.
- Cao X, Ye H, Liao C, Li Q, He H, Zhong J. Fast 3D brain MR fingerprinting based on multi-axis spiral projection trajectory. Magn Reson Med 2019;82(1):289-301.
- Gómez PA, Cencini M, Golbabaee M, et al. Rapid three-dimensional multiparametric MRI with quantitative transient-state imaging. Sci Rep. 2020;10(1):13769.
- Fischl B. FreeSurfer. Neuroimage 2012;62:774–781.
- Desikan RS, Segonne F, Fischl B, et al. An automated labeling system for subdividing the human cerebral cortex on MRI scans into gyral based regions of interest. Neuroimage 2006;31:968–980.
- Buonincontri G, Biagi L, Retico A, et al. Multi-site repeatability and reproducibility of MR fingerprinting of the healthy brain at 1.5 and 3.0T. Neuroimage 2019;195:362-372.
- Korzdorfer G, Kirsch R, Liu K, et al. Reproducibility and Repeatability of MR Fingerprinting Relaxometry in the Human Brain. Radiology 2019;292(2):429-437.
Figures
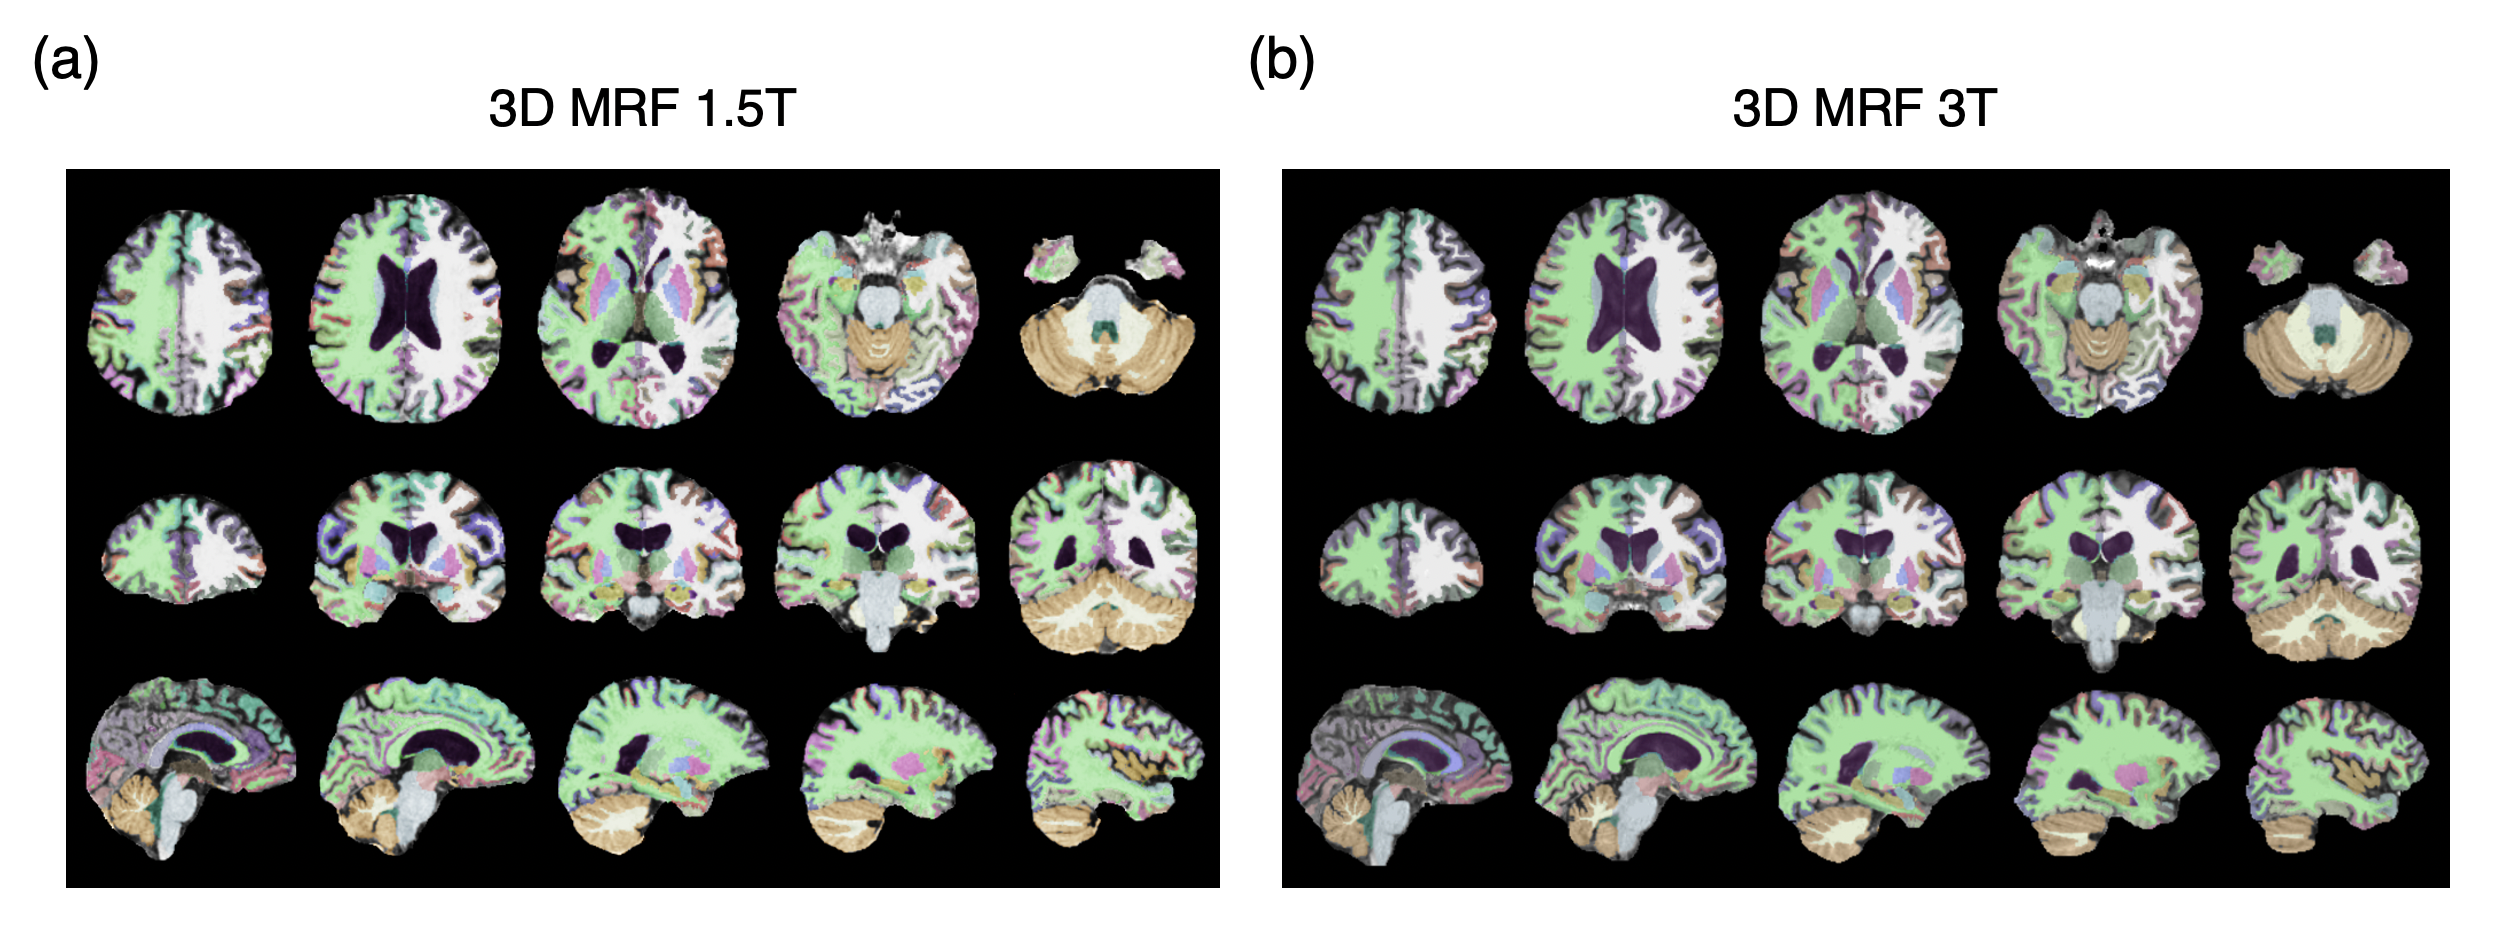
Figure 1. Representative FreeSurfer labels created from automated parcellation of brain regions using three-dimensional (3D) magnetic resonance fingerprinting (MRF)-based T1-weighted images. Images and parcellations at 1.5T (left) and images and parcellations at 3T (right). Results of automated brain segmentation are overlaid on the 3D MRF-based T1-weighted images.
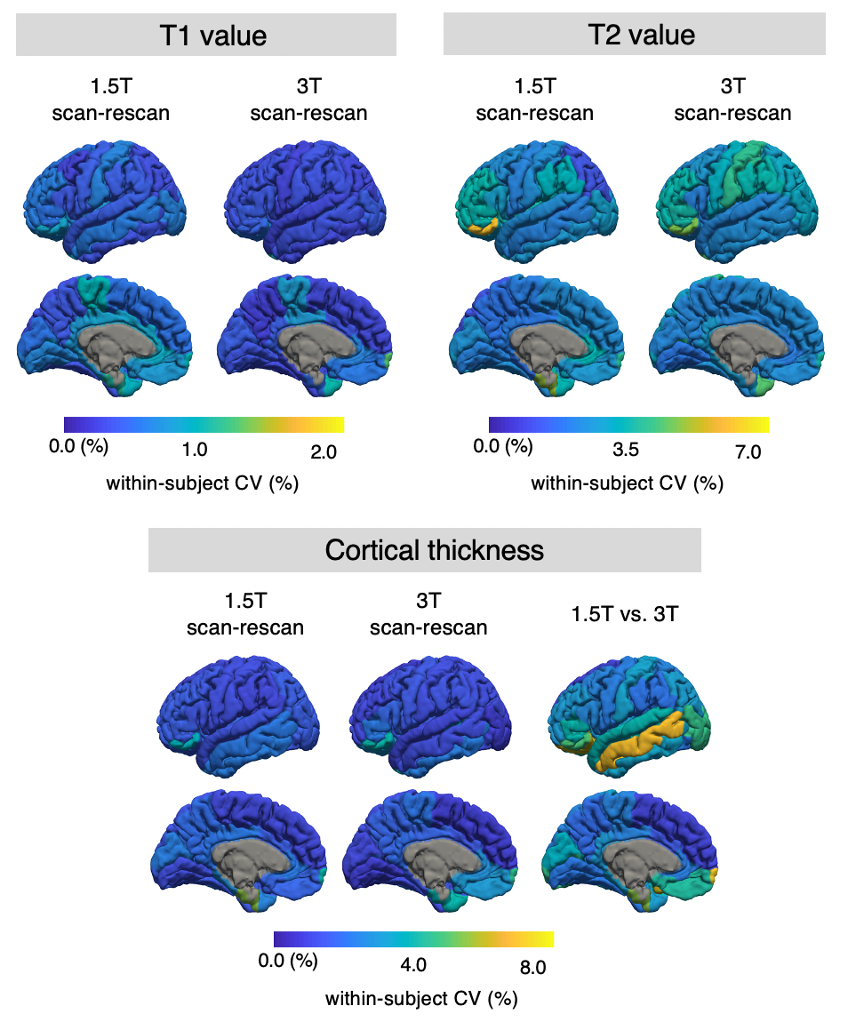
Figure 2. The scan-rescan within-subject coefficient of variance (wCV) of cortical thickness and relaxation times on cortical structures acquired with three-dimensional magnetic resonance fingerprinting. The scan-rescan wCVs of local cortical thickness, T1 value, and T2 value are overlaid on an inflated brain surface.
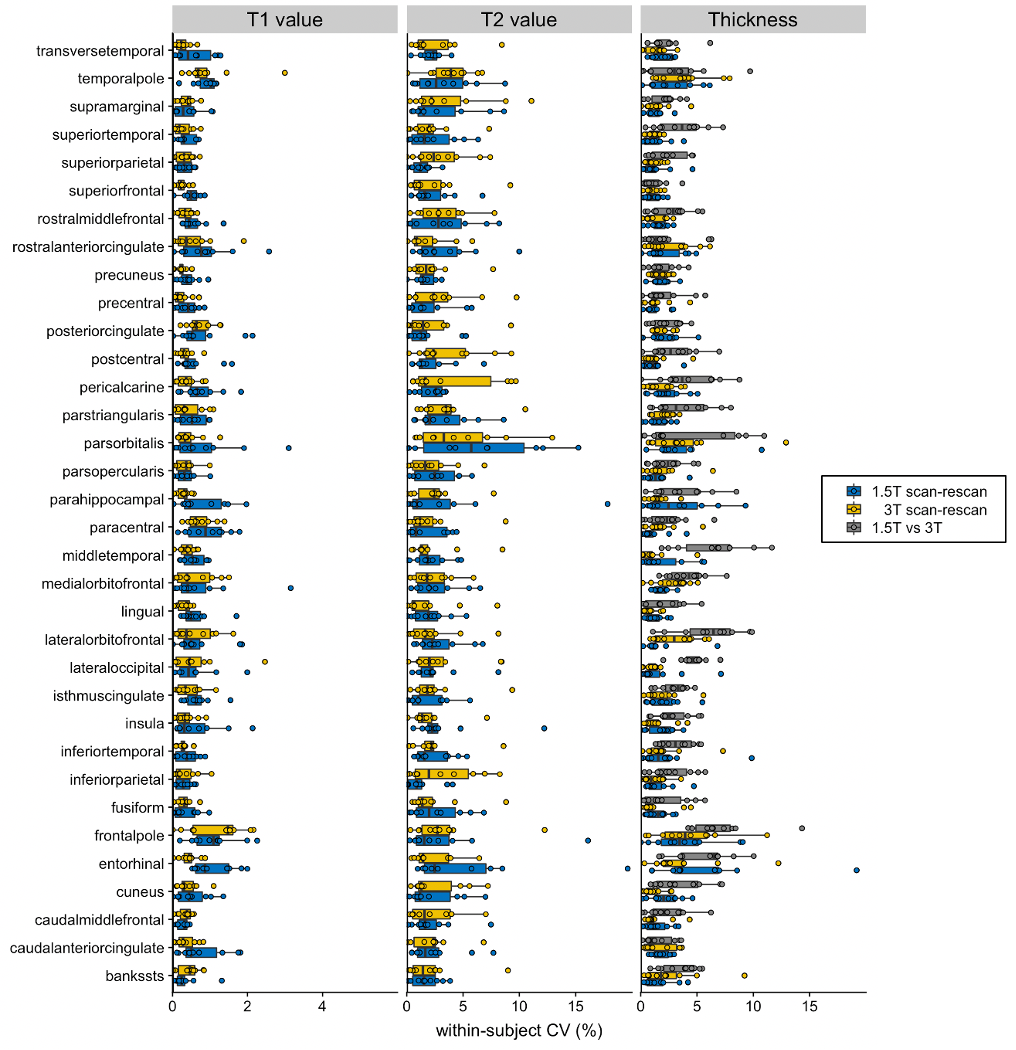
Figure 3. The scan-rescan within-subject coefficient of variance (CV) of three-dimensional magnetic resonance fingerprinting-derived cortical thickness, local T1 value, and local T2 value at 1.5T and 3T. The boxes indicate the interquartile range (25–75%), and the circles indicate the sample data points.
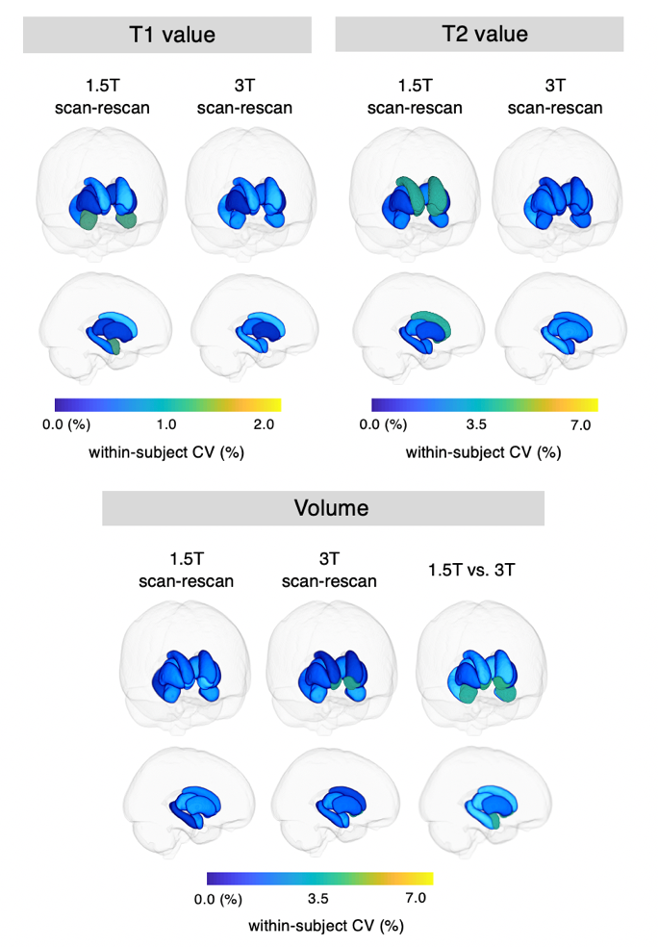
Figure 4. The scan-rescan within-subject coefficient of variance (wCV) of volume and relaxation times on subcortical structures acquired using three-dimensional magnetic resonance fingerprinting. The scan-rescan wCVs of subcortical volume, local T1 value, and local T2 value. Each subcortical structure is colored according to the regional wCV, and the brain surface is made transparent for the ease of visualization.
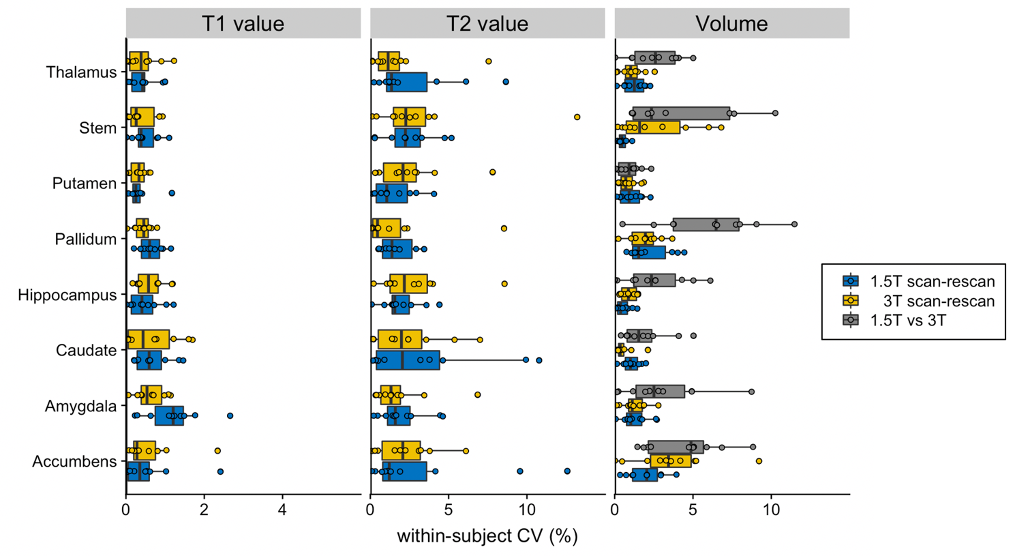
Figure 5. The scan-rescan within-subject coefficient of variance (CV) of three-dimensional magnetic resonance fingerprinting-derived subcortical volume, local T1 value, and local T2 value at 1.5T and 3T. The boxes indicate the interquartile range (25–75%), and the circles indicate the sample data points.