0165
Myelin Water Fraction Mapping in developing children using Magnetic Resonance Fingerprinting1IRCCS Stella Maris, Pisa, Italy, 2Imago7 Foundation, Pisa, Italy, 3IMT School for Advanced Studies Lucca, Lucca, Italy, 4Neuroradiology Unit, Azienda Ospedaliero-Universitaria Pisana, Pisa, Italy, 5Department of Clinical and Experimental Medicine, University of Pisa, Pisa, Italy
Synopsis
Magnetic Resonance Fingerprinting (MRF) has been used to obtain Myelin Water Fraction (MWF) estimates in a cohort of developing children by using a three-component signal model. Here, we used a recent approach in which we perform sub-voxel tissue characterization without assumptions on the number and properties of the model components. We then used this signal model to study the myelination process in the developing brain on a 2D MRF dataset. Finally, we measured MWF on a set of subjects acquired with 3D MRF scan and compared the results to the 2D experiment.
Introduction
Myelin fraction represents an essential biomarker in the study of brain development and white matter diseases1. To date, several MRI techniques that assess the integrity of the myelin sheath have been proposed2. In relaxometry-based methods, each voxel is decomposed in a fast decaying pool (water trapped within the myelin layers), a slow decaying pool (free water, e.g. the CSF) and an intermediate pool (intra/extracellular water). Amongst these, Magnetic Resonance Fingerprinting3 (MRF) represents a promising approach, providing an accurate and reproducible measurement of T1 and T2 within a short scan time4,5. MRF, combined with a multi-component signal model, has already been used to obtain Myelin, Intra/Extracellular and Free Water Fraction (MWF, IEWF, FWF) maps of the developing brain6, by characterizing each pool with a single set of T1/T2 values based on literature reports. This provided a robust but potentially biased quantification. To overcome this limitation, we used a recently proposed multi-component estimation algorithm (SPIJN7), which did not require assumptions on the number and properties of sub-voxel components. We applied the algorithm on a cohort of 2D MRF data to obtain site-specific values for the three-pool signal model. Finally, we tested the same model on a set of subjects acquired with a 3D MRF scan and compared the results with the outcome of the 2D experiment.Methods
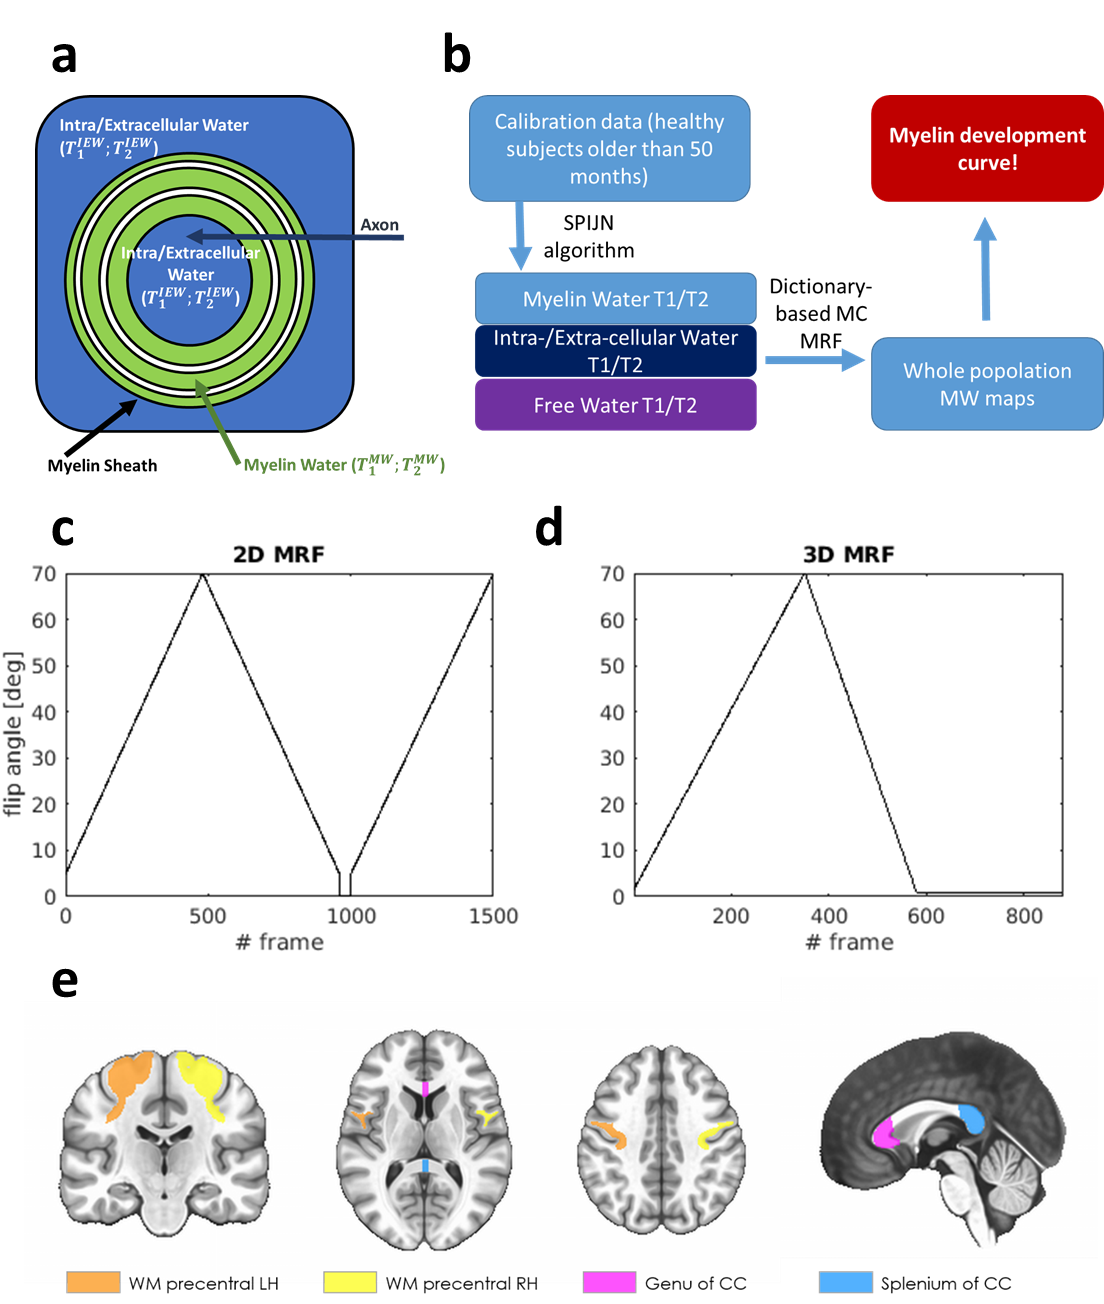
Subject cohort: The dataset included 18 subjects acquired with a 2D MRF technique (ages: 7–114 months) and 20 subjects acquired with a 3D MRF technique (ages: 3–143 months). Subjects did not show white matter alterations. A T1w image was acquired for each subject as an anatomical reference for segmentation.Dictionary Creation: here, we used a three-component signal model6 for the creation of the dictionary (Figure 1a), which can be expressed as:
$$D=w_{MW}D_{MW}+w_{IEW}D_{IEW}+w_{FW}D_{FW}$$
where $$$D_{MW;IEW,FW}$$$ are the signal evolutions describing each pool and $$$w_{MW,IEW,FW}\in\mathbb{R};w_{MW}+w_{IEW}+w_{FW}=1$$$ are the associated weights. Weights step-size was 0.01. In addition, a single-compartment T1-T2 dictionary was calculated.
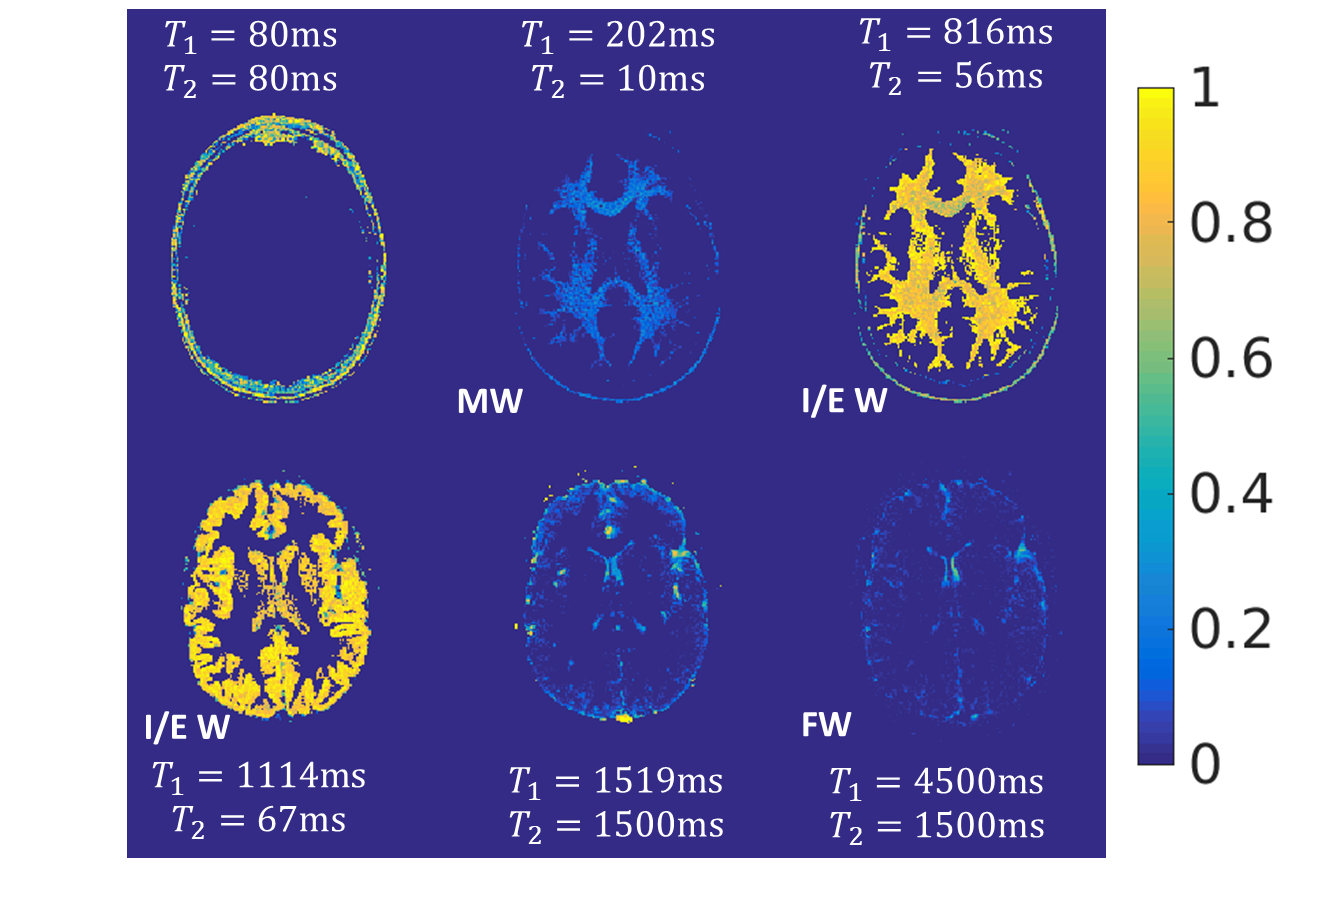
Model Calibration: To define the three pools properties, we applied SPIJN algorithm7 on the 6 subjects older than 60 months from the 2D MRF dataset. These subjects were selected as myelin content approach the value for adult white matter above this threshold8. Components associated with MW, IEW and FW were manually identified. The corresponding T1/T2 values were averaged across the calibration dataset and used as input for the dictionary-based multi-component estimation (Figure 1b).
Data acquisition: Both MRF acquisitions used inversion-prepared variable flip angle schemes (Figure 1c,d) with fixed TE/TR (1.8/10ms for 2D MRF and 0.5/8.5ms for 3D MRF). A spoiler gradient was used at the end of each TR to dephase magnetization along z9. For 2D experiment, k-space encoding was based on a 2D variable density spiral with golden angle rotation of the interleaves (spatial resolution: 1.2x1.2x5mm3). For 3D experiment, k-space sampling was performed using a 3D spiral projection10,11 trajectory with random permutations of the interleave ordering12 (spatial resolution: 1.1x1.1x1.1mm3) All the acquisitions were performed on a GE HDxt 1.5T using an 8 channels receiver coil.
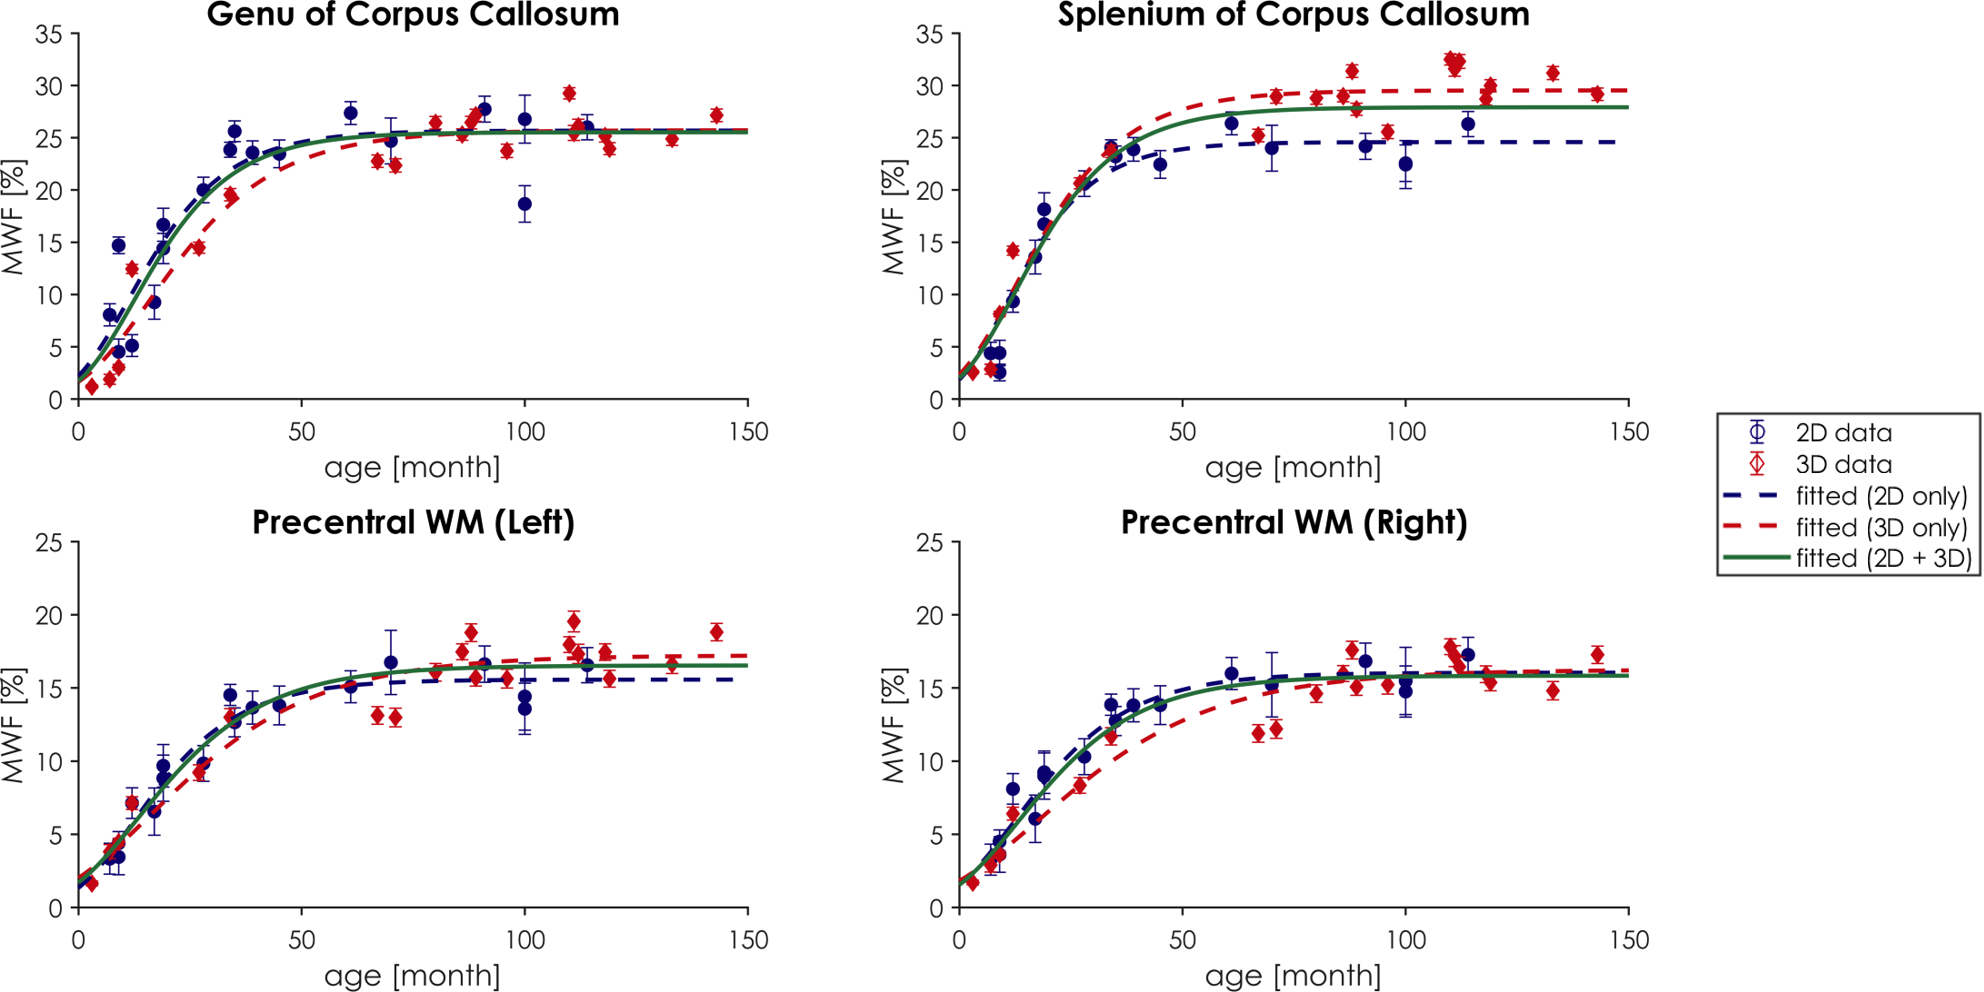
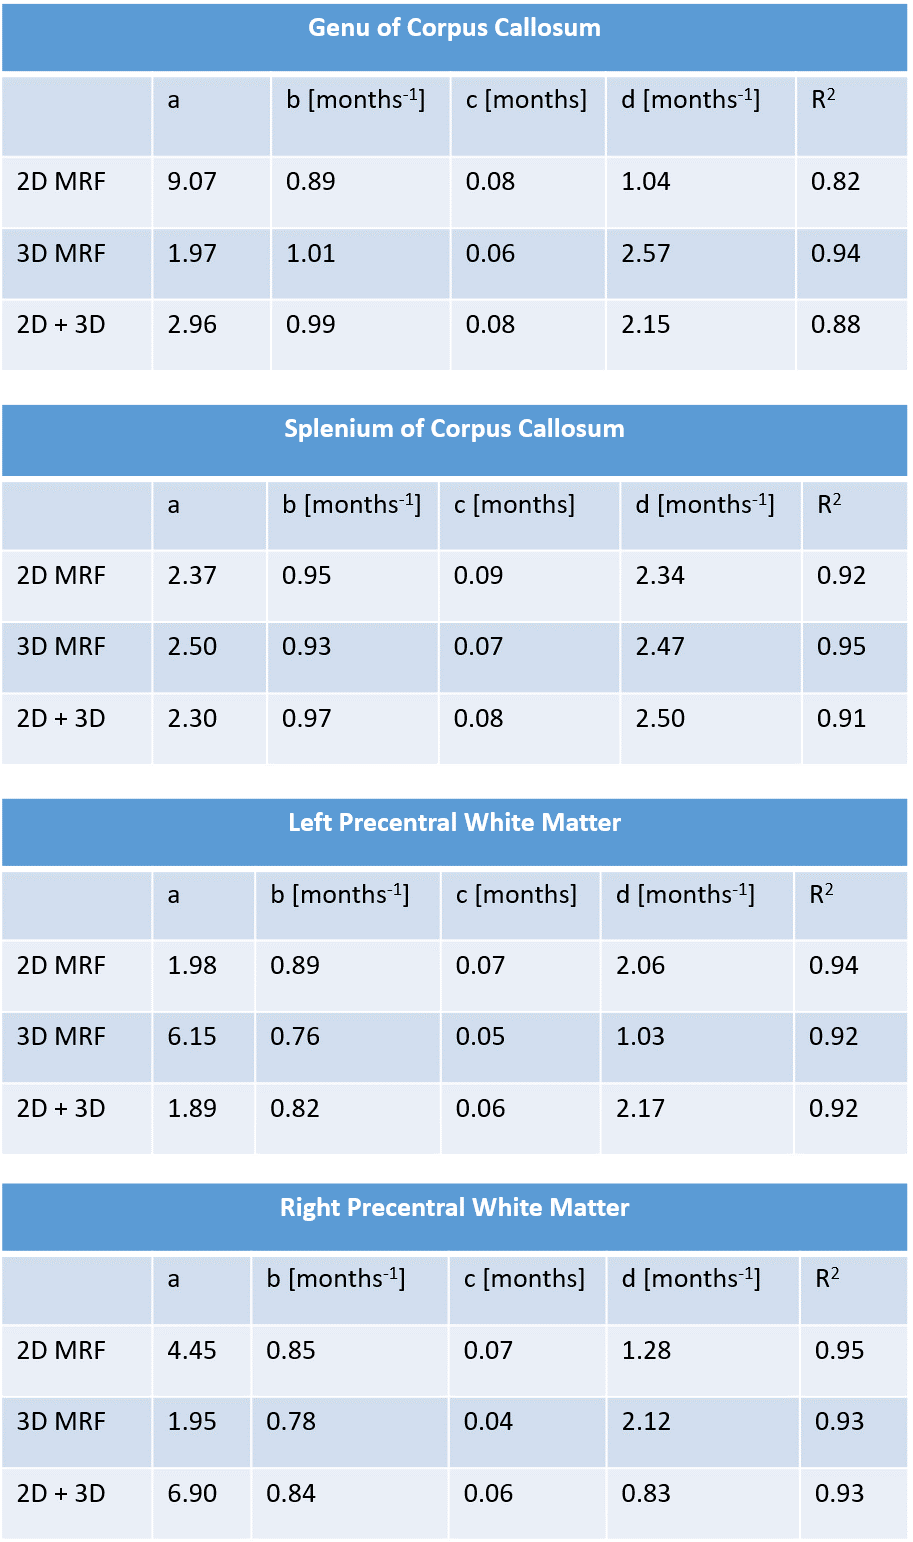
Data analysis: ROIs corresponding to splenium and genu of corpus callosum and to left/right precentral white matter were obtained using the subjects T1w images and Freesurfer13 segmentation (Figure 1e). Average myelin fraction values and corresponding standard error within each ROI were reported as a function of the patient age. Data were fitted using a modified Gompertz function14:
$$MWF(age)=a\cdot exp(b\cdot age - exp(c - d\cdot age))$$
Fit was performed using 2D data only, 3D data only and both 2D and 3D data.
Results
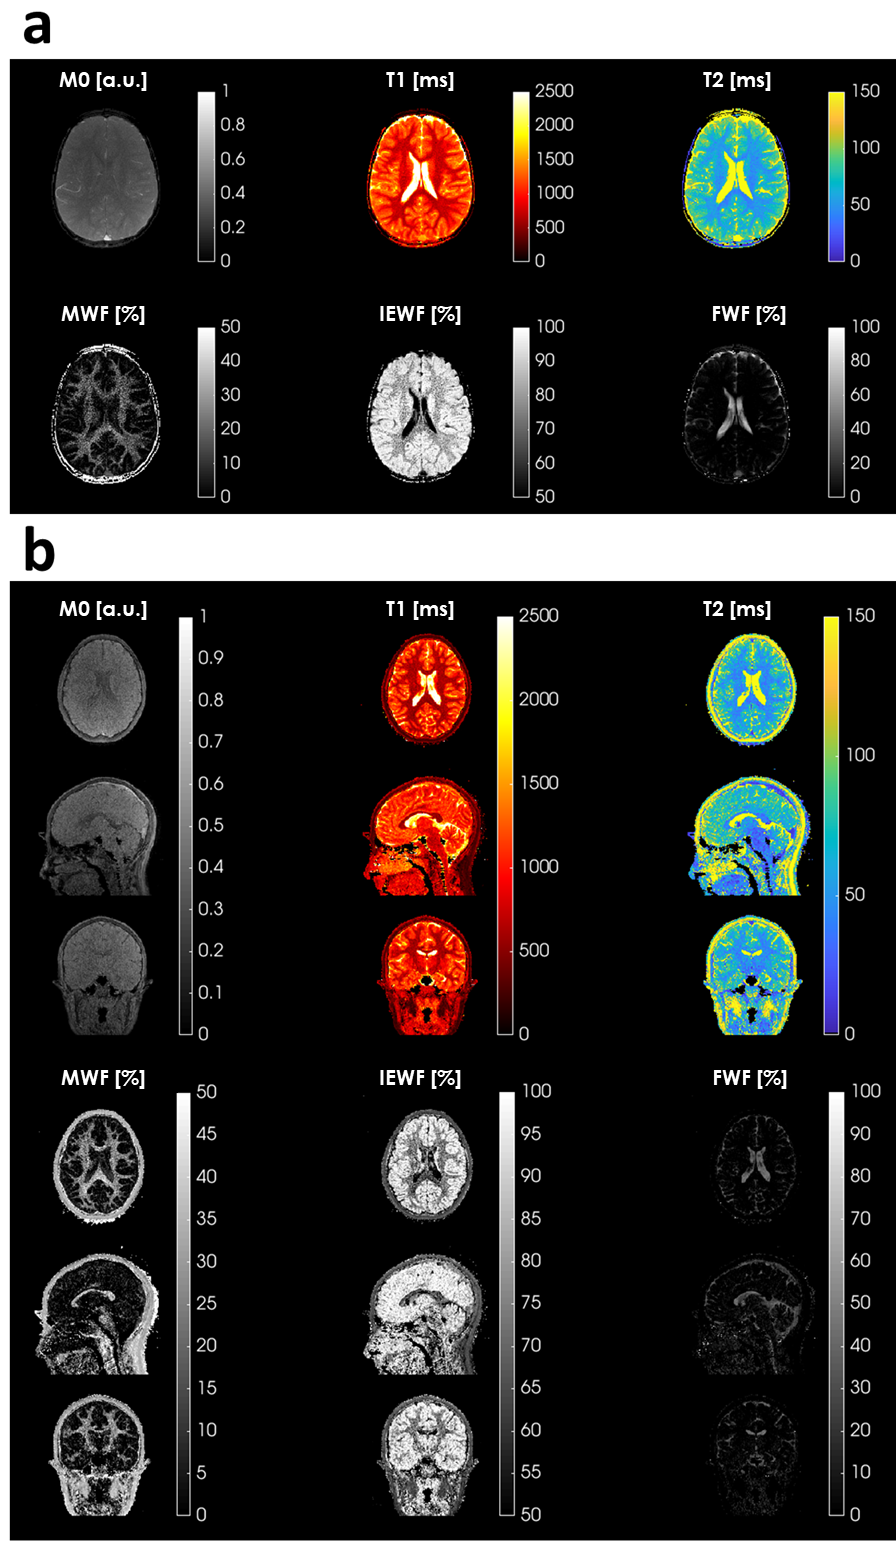
Results of the model calibration step are shown in Figure 2. MW and FW pools were both described with single signal evolution (T1,2=202/10ms for MW, T1,2=4500/1500ms for FW), while IEW was described with two signal evolutions (T1=889/1176ms; T2=58/58ms). MWF, IEWF and FWF maps, in addition to M0/T1/T2, were successfully obtained by using these values for the model definition. Results for a representative subject obtained with 2D MRF dataset are shown in Figure 3a. Using the same signal model, M0/T1/T2 and MWF/IEWF/FWF maps were obtained from 3D MRF data (Figure 3b). MWF and IEWF in gray and white matter regions were comparable to the 2D case, while FWF was underestimated. Figure 4 shows the quantitative evaluation of the myelination process in selected white matter ROIs. 2D and 3D data showed consistent trends, as reflected in the high R2 of aggregated fit (R2 >= 0.88, Figure 5).Discussion and Conclusion
Here, we obtained quantitative maps of MWF, IEWF and FWF from 2D and 3D MRF data, in addition to M0/T1/T2 maps. Notably, we performed a three-component dictionary estimation based on site-specific values, obtained with the SPIJN technique7. This method preserves the robustness of the dictionary-based approach while reducing the potential bias introduced by using literature-based values for the model definition. Finally, we demonstrated the feasibility of 3D MRF-based MWF mapping. Compared to 2D MRF, 3D MRF has a wider coverage and higher resolution, potentially improving spatial specificity of the quantitative analysis. Future work will focus on increasing the sample size (in particular in the early brain development age range) and on extending the analysis to different areas.Acknowledgements
The results here presented have been developed in the framework of the 18HLT05 QUIERO Project. This project has received funding from the EMPIR Programme co-financed by the Participating States and from the European Union’s Horizon 2020 Research and Innovation Programme. Funding from the Italian Minister of Health BIANCA-IDEA* (RRC-2018 -2019). Funding by the Italian Ministry of Health and co-funding by Health Service of Tuscany (project no. GR-2016–02361693).
*Italian DEvelopmental Age Health Network (IDEA Network) is constituted by the following centers: IRCCS Ospedale pediatrico Bambino Gesù (Rome); Fondazione IRCCS Istituto neurologico “Carlo Besta” (Milan); IRCCS Ospedale pediatrico “Giannina Gaslini” (Genoa); IRCCS Eugenio Medea (Bosisio Parini); IRCCS Associazione Oasi Maria SS Onlus – Troina.
References
1. Deoni, S. C. L. et al. Mapping infant brain myelination with magnetic resonance imaging. J. Neurosci. 31, 784–791 (2011).
2. Mancini, M. et al. The quest for measuring myelin with MRI – An interactive meta-analysis of quantitative comparisons with histology. bioRxiv (2020).
3. Ma, D. et al. Magnetic resonance fingerprinting. Nature 495, 187–92 (2013).
4. Buonincontri, G. et al. Multi-site repeatability and reproducibility of MR fingerprinting of the healthy brain at 1.5 and 3.0 T. Neuroimage (2019) doi:10.1016/j.neuroimage.2019.03.047.
5. Buonincontri, G. et al. Three dimensional MRF obtains highly repeatable and reproducible multi-parametric estimations in the healthy human brain at 1.5T and 3T. Neuroimage (2021) doi:10.1016/j.neuroimage.2020.117573.
6. Chen, Y. et al. MR fingerprinting enables quantitative measures of brain tissue relaxation times and myelin water fraction in the first five years of life. Neuroimage 186, 782–793 (2019).
7. Nagtegaal, M., Koken, P., Amthor, T. & Doneva, M. Fast multi-component analysis using a joint sparsity constraint for MR fingerprinting. Magn. Reson. Med. (2020) doi:10.1002/mrm.27947.
8. Deoni, S. C. L., Dean, D. C., O’Muircheartaigh, J., Dirks, H. & Jerskey, B. A. Investigating white matter development in infancy and early childhood using myelin water faction and relaxation time mapping. Neuroimage (2012) doi:10.1016/j.neuroimage.2012.07.037.
9. Jiang, Y., Ma, D., Seiberlich, N., Gulani, V. & Griswold, M. A. MR Fingerprinting Using Fast Imaging with Steady State Precession (FISP) with Spiral Readout. MRM (2014).
10. Cao, X. et al. Fast 3D brain MR fingerprinting based on multi-axis spiral projection trajectory. Magn Reson Med 82, 289 (2019).
11. Gómez, P. A. et al. Rapid three-dimensional multiparametric MRI with quantitative transient-state imaging. Sci. Rep. (2020) doi:10.1038/s41598-020-70789-2.
12. Kurzawski, J. W. et al. Retrospective rigid motion correction of three-dimensional magnetic resonance fingerprinting of the human brain. Magn. Reson. Med. (2020) doi:10.1002/mrm.28301.
13. Dale, A. M., Fischl, B. & Sereno, M. I. Cortical Surface-Based Analysis: I. Segmentation and Surface Reconstruction. Neuroimage 9, 179–194 (1999).
14. Chen, Y. et al. MR fingerprinting enables quantitative measures of brain tissue relaxation times and myelin water fraction in the first five years of life. Neuroimage (2019) doi:10.1016/j.neuroimage.2018.11.038.
Figures