0164
Altered dynamic functional connectivity in subjects with cerebral glioma
Siqi Cai1,2, Zhifeng Shi3, Yuchao Liang4, Chunxiang Jiang1,2, Shihui Zhou1,2, and Lijuan Zhang*1
1Shenzhen Institutes of Advanced Technology, Chinese Academy of Sciences, Shenzhen, China, 2University of Chinese Academy of Sciences, Beijing, China, 3Huashan Hospital of Fudan University, Shanghai, China, 4Neurosurgery, Beijing Tiantan Hospital of Capital Medical University, Beijing, China
1Shenzhen Institutes of Advanced Technology, Chinese Academy of Sciences, Shenzhen, China, 2University of Chinese Academy of Sciences, Beijing, China, 3Huashan Hospital of Fudan University, Shanghai, China, 4Neurosurgery, Beijing Tiantan Hospital of Capital Medical University, Beijing, China
Synopsis
This study investigated the impact of cerebral glioma on the dynamic properties of functional connectivity (dFC). Cerebral gliomas induce alteration in dFC featuring more frequent strengthened connectivity and state transition between strong and sparse functional connectivity, indicating an extensive disturbance of functional segregation. As alterations in the dFC were reported to be associated with the progression of brain diseases, dFC variation induced by glioma may entail additional information to interpret the clinical profiles that are not ascribed to the lesion topology and serve as a new biomarker for the tumor characterization of glioma.
Introduction
Cerebral glioma results in local or global functional remodeling in human brain.1 The dynamic of the temporal synchronization among brain regions may entail more informative pathological profile for glioma characterization. In this study, we aim to investigate the effect of glioma on the dynamic functional connectivity (dFC) based on resting state functional MR images (rs-fMRI).Materials and Methods
This study was approved by local institutional review board. A total of 43 subjects with histological confirmed glioma located in left frontal lobe were consecutively recruited, among which 25 were categorized as low grade glioma (LGG, female/male 14/11, aged 36.88±10.11 years) and 18 as high grade glioma (HGG, female/male 5/13, aged 48.47±14.67 years). Rs-fMRI data was acquired using gradient echo-planar imaging sequence (3.0T, Siemens Verio, Germany) with a 12-channel phase array head coil. The major imaging parameters were TR/TE 2000/35ms, FOV 210mm×210mm, matrix 64×64, 33 slices with thickness of 4.0mm, 240 volumes. In addition, rs-fMRI data of 25 healthy subjects was acquired as controls (HC, female/male 12/13, aged 32.84±8.48 years). The rs-fMRI data were preprocessed using DPABI.2 The first 10 time points were discarded for scanner calibration. Slice timing and realignment were performed in turn to remove the temporal differences between slices and correct head movement. Nuisance variables including Friston 24-parameter motion model and signals of white matter as well as cerebrospinal fluid were regressed out. Images were then normalized to the standard Montreal Neurological Institute template (MNI152) with voxel size resampled to 3mm x 3mm x 3 mm and spatially smoothed by a Gaussian kernel (FWHM = 4mm). Spatial group ICA analysis was performed using Group ICA of functional MRI Toolbox (GIFT v3.01), by which all the data was decomposed into 100 independent components (ICs) with a 20- time repeatation in ICASSO for estimation stability.3 GICA based back-reconstruction method was performed to obtain the subject-specific spatial maps and time-courses of each IC. Meaningful ICs were identified based on previously established criteria and categorized into seven resting-state networks (RSN).4 The time courses of subject-specific components were further detrended, despiked and band-pass filtered (0.01-0.15Hz). Sliding window approach was utilized to perform dFC analysis with a tapered window generated by convolving a rectangle (width = 22TRs) with a Gaussian window (σ=3TRs) and a sliding step of 1TR.4 K-means clustering method was performed on FC matrices to estimate FC states with the optimal cluster number determined by silhouette statistics. Furthermore, the state transition vector of each subject was recorded. The fractional windows (percentage of the time spent of each state), mean dwell time (mean value of consecutive windows assigned in one state) and number of state transitions of dFC states were calculated to quantify the temporal dynamic properties of resting-state functional networks. The aforementioned features were compared between HCs and glioma subjects using Mann-Whitney U test.Results
Forty-nine meaningful ICs were identified and categorized into seven RSNs (Figure 1). The FC matrices were classified into two states by k-means clustering. State-I was less frequent (21.67%) and featuring strong connection (Figure 2A), while State-II was more frequent (78.33%) but featuring sparse connection (Figure 2B). The fractional window and mean dwell time of state-I for LGGs (31.77%, 24.68 windows) and HGGs (26.37%, 26.59 windows) were significantly higher than those of HCs (8.16%, 5.63 windows) (p<0.05, FDR correction). The same measurements of state-II for LGGs (68.21%, 80.21 windows) and HGGs (73.63%, 79.12 windows) were significantly decreased as compared with HCs (91.84%, 118.60 windows) (p<0.05, FDR correction). The number of state-transition was comparable between LGGs (2.12±2.09) and HGGs (2.11±1.91), but significantly higher than that of HCs (1.08±1.85) (p <0.05, FDR correction).Discussion and Conclusions
Cerebral gliomas induced alteration in dFC which features more frequent strengthened connectivity and state-transition, indicating an extensive disturbance of functional segregation. As alterations in the dFC were reported to be associated with the progression of brain diseases,5 dFC variation induced by glioma may entail additional information to interpret the clinical profiles that are not ascribed to the lesion topology, thus could serve as a new biomarker for the tumor characterization of glioma.Acknowledgements
This study was partially supported by GJHZ20180928120207356 and NSFC81627901.References
- Kong, N. W., et al. Neuroplasticity: Insights from Patients Harboring Gliomas. Neural Plast 2016; 2365063.
- Yan, C. G., et al. DPABI: Data Processing & Analysis for (Resting-State) Brain Imaging. Neuroinformatics 2016; 14: 339-351.
- Calhoun, V. D., et al. A method for making group inferences from functional MRI data using independent component analysis. Human Brain Mapping 2001; 14: 140-151.
- Allen, E. A. et al. Tracking Whole-Brain Connectivity Dynamics in the Resting State. Cerebral Cortex 2014; 24: 663-676.
- Filippi, M., et al. Resting State Dynamic Functional Connectivity in Neurodegenerative Conditions: A Review of Magnetic Resonance Imaging Findings. Frontiers in Neuroscience 2019; 13: 657.
Figures
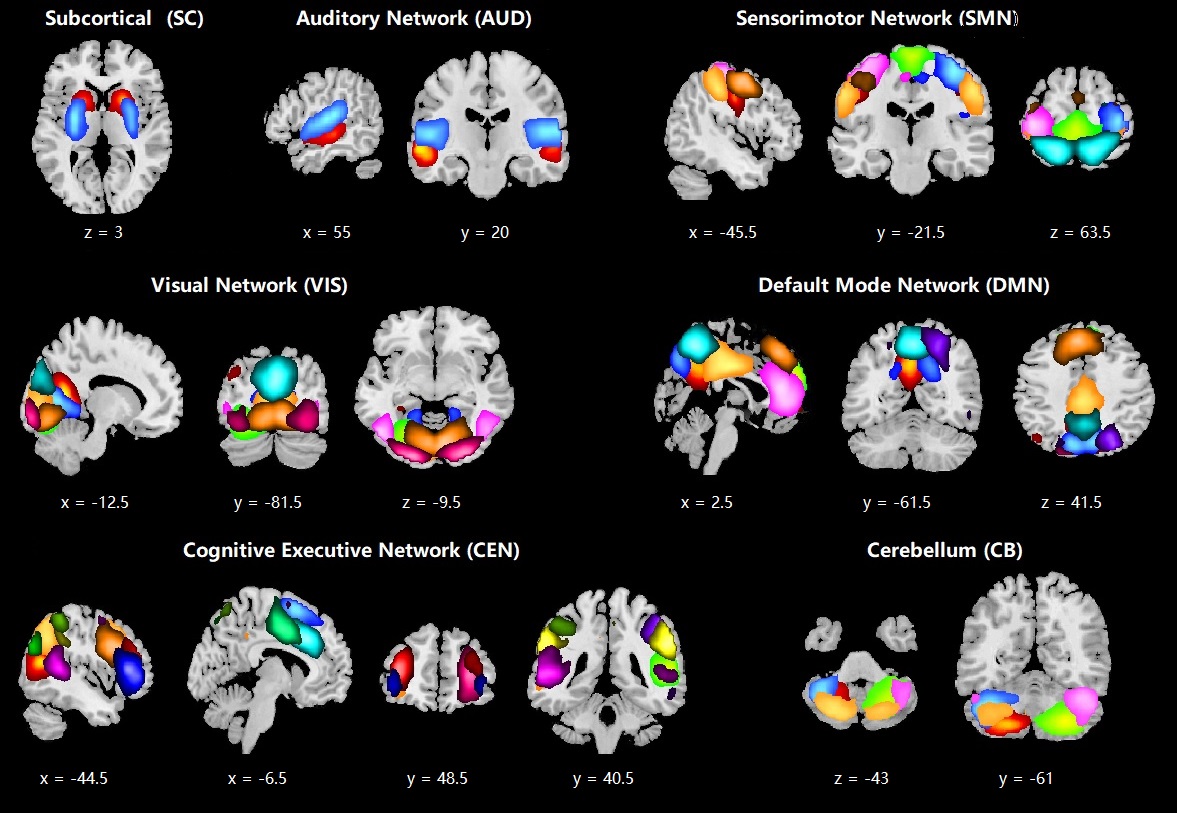
Figure 1. Spatial maps of 49 selected independent components (IC). Colors discriminate the identified ICs.
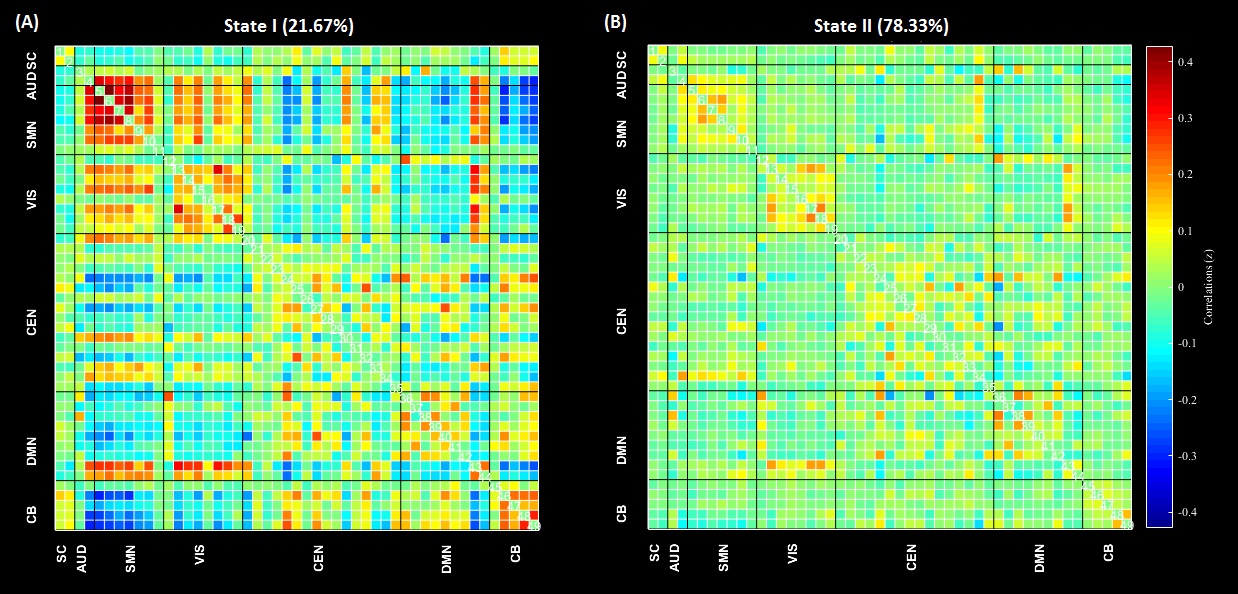
Figure 2. The cluster centroids of two functional connectivity states. (SC: subcortical, AUD: auditory network, SMN: sensorimotor network, VIS: visual network, CEN: cognitive executive network, DMN: default mode network, CB: cerebellum)