0163
Cerebrovascular reactivity changes in glaucoma patients using resting-state fMRI
Russell W. Chan1,2, Ji Won Bang2, Vivek Trivedi2, Peiying Liu3, Gadi Wollstein2, Joel S. Schuman2, and Kevin C. Chan1,2,4
1Neuroscience Institue, New York University Grossman School of Medicine, New York, NY, United States, 2Department of Ophthalmology, New York University Grossman School of Medicine, New York, NY, United States, 3Department of Radiology, Johns Hopkins University School of Medicine, Baltimore, MD, United States, 4Department of Radiology, New York University Grossman School of Medicine, New York, NY, United States
1Neuroscience Institue, New York University Grossman School of Medicine, New York, NY, United States, 2Department of Ophthalmology, New York University Grossman School of Medicine, New York, NY, United States, 3Department of Radiology, Johns Hopkins University School of Medicine, Baltimore, MD, United States, 4Department of Radiology, New York University Grossman School of Medicine, New York, NY, United States
Synopsis
Cerebrovascular reactivity (CVR) is the response of cerebral blood vessels to vasoactive stimuli. Dampened CVR can precede and contribute to neuropathology. However, CVR assessments in glaucoma patients have been lacking at the whole-brain scale. Here, we applied relative CVR (rCVR) mapping using resting-state fMRI to investigate vascular reserve changes in glaucoma patients. Our results show that visual cortical rCVR decreases with severity and is coupled with clinical ophthalmic assessments. Interestingly, rCVR in both basal forebrain and hippocampus increase with severity indicating their involvements in glaucoma. Together, resting-state fMRI derived rCVR can potentially be used for studying, diagnosing and monitoring glaucoma.
INTRODUCTION
Cerebrovascular reactivity (CVR) is the response of cerebral blood vessels to vasoactive stimuli. Dampened CVR impairs blood delivery to brain regions, which often precedes and contributes to neuropathology over time. Glaucoma can cause progressive vision loss and irreversible blindness, and is primarily considered an eye disease with widespread involvements of the brain. Recent Doppler ultrasound studies have shown CVR reduction in the visual cortex1 and middle cerebral artery2,3 in glaucoma patients. Recent MRI studies have suggested a role of the basal forebrain4 (BF) and hippocampus5 (HP) in glaucoma. However, CVR changes at the whole-brain scale have yet to be elucidated.Whole-brain CVR mapping is typically performed using hypercapnic gas inhalation while collecting BOLD fMRI images6, which requires additional settings and presents an obstacle for routine clinical use. Recently, relative CVR (rCVR) mapping is achieved using resting-state fMRI7 (rsfMRI) without gas challenges and has been shown to resemble hypercapnia-inhalation CVR mapping. This provides a task-free method to measure vascular reserve. In this study, we applied whole-brain rCVR mapping using rsfMRI to verify the feasibility of detecting visual cortical vascular reserve changes in glaucoma patients. Subsequently, we establish the relationship between these rCVR changes and their corresponding clinical assessments. Lastly, we explore rCVR changes in the basal forebrain and hippocampus in glaucoma patients.
METHODS AND MATERIALS
Normal controls (n=22), early-stage glaucoma patients (n=18), and advanced-stage (n=19) glaucoma patients were scanned with a 3-Tesla Allegra head scanner (Siemens, Germany). For rsfMRI, single-shot GE-EPI was performed with TE/TR=26/2000 ms, FOV=20.5×20.5 cm2, matrix=104×104, and 28 contiguous 3-mm slices. rCVR maps were generated with MriCloud (https://braingps.mricloud.org/rs-cvr). rCVR values were extracted in the occipital lobe, parietal lobe, BF and HP using SPM12 regions of interest (ROIs). 3D MPRAGE anatomical MRI was performed with TE/IT/TR=2.5/800/1400 ms, FOV=25.6×25.6×17.6 cm3, and matrix=256×256×176. The optic nerve volume and optic chiasm volume were measured from the MPRAGE images using ImageJ (https://imagej.nih.gov/ij/). Age, optical coherence tomography measurements [peripapillary retinal nerve fiber layer (RNFL) thickness, cup/disc ratio, macular ganglion cell and inner plexiform layers (GCIPL) thickness], and Humphrey visual field mean deviation (VF-MD) were obtained from clinical records. Results are presented as mean±SEM. One-way ANOVA followed by post-hoc Bonferroni's multiple comparisons test, trend analysis, and linear regression were applied.RESULTS AND DISCUSSION
Clinical ophthalmic assessments confirmed normal control and glaucoma groups
Demographics (age), clinical ophthalmic assessments (RNFL thickness, cup/disc ratio, GCIPL thickness and VF-MD) and volumetric MRI assessments (optic nerve volume and optic chiasm volume) were compared between groups (Figure 1). RNFL thickness, GCIPL thickness, VF-MD, optic nerve volume and optic chiasm volume show decreasing trends with severity, while cup/disc ratio has an increasing trend. These confirmed the characteristics of the anterior visual pathways in the normal control, early-stage glaucoma and advance-stage glaucoma groups.Visual cortical rCVR decreases with glaucoma severity
Averaged rCVR maps were calculated for the groups (Figure 2). The average rCVR map from normal controls is consistent with a previous study7. Advanced-stage glaucoma patients [0.54±0.03 relative unit (r.u.); p<0.05] have significantly lower rCVR in the visual cortex compared to normal controls (0.70±0.05 r.u.; early-stage: 0.60±0.03 r.u.). In addition, rCVR in the visual cortex has a decreasing trend with severity. These results corroborate with previous Doppler ultrasound studies1. No significant rCVR change was observed in the somatosensory cortex of the parietal lobe.Visual cortical rCVR is coupled with clinical ophthalmic assessments and volumetric MRI assessments
Visual cortical rCVR is positively correlated with RNFL thickness, GCIPL thickness, VF-MD, optic chiasm volume and optic nerve volume, while negatively correlated with cup/disc ratio (Figure 3). No significant correlation was found between visual cortical rCVR and age. Together, rsfMRI derived rCVR can be a potential biomarker for studying brain involvements across glaucoma severity.Glaucoma involvements of the basal forebrain (BF) and hippocampus (HP)
Early-stage (BF: 0.99±0.06 r.u., p<0.05; HP: 1.12±0.05 r.u., p<0.05) and advanced-stage (BF: 1.22±0.07 r.u., p<0.001; HP: 1.14±0.05 r.u., p<0.05) glaucoma patients have significantly higher rCVR in BF and HP compared to normal controls (BF: 0.82±0.06 r.u.; HP: 0.94±0.04 r.u.; Figure 4). rCVR in these regions also have an increasing trend with severity. Cholinergic neurons in the visual pathway mainly originate from BF which may play a role in glaucoma in terms of visual plasticity, visual perception and regulation of intracranial pressure4. Hippocampal structural change was previously reported in glaucoma patients5. Our results further solidify that the basal forebrain and hippocampus play a role in glaucoma structurally, neurovascularly and functionally.Future directions
We analyzed sub-regions of the occipital lobe and parietal lobe to gain further insights (Figure 5). Parietal operculum is related to somatosensory and motor functions while superior parietal lobule is closely linked with occipital lobe. Although statistically insignificant, it is not entirely surprising that the superior parietal lobule has a decreasing trend similar to the occipital lobe. Future studies can elucidate how different sub-regions play a role in glaucoma.CONCLUSION
rsfMRI derived rCVR offers a whole-brain vascular reserve assessment, and is capable of detecting changes in glaucoma patients. Specifically, visual cortical rCVR decreases with severity and is coupled with clinical assessments. Interestingly, rCVR in both basal forebrain and hippocampus increase with severity indicating their involvements in glaucoma. Together, rCVR can potentially be used for studying, diagnosing and monitoring glaucoma.Acknowledgements
This work was supported in part by the National Institutes of Health R01-EY028125 and UF1-NS107680 (Bethesda, Maryland); BrightFocus Foundation G2013077, G2016030, and G2019103 (Clarksburg, Maryland); Research to Prevent Blindness/Stavros Niarchos Foundation International Research Collaborators Award (New York, New York); and an unrestricted grant from Research to Prevent Blindness to NYU Langone Health Department of Ophthalmology (New York, New York).References
- Zhang S, Xie Y, Yang J, Tang Y, Li R, Wang N, Zhang C. Reduced cerebrovascular reactivity in posterior cerebral arteries in patients with primary open-angle glaucoma. Ophthalmology. 2013 Dec;120(12):2501-2507. doi: 10.1016/j.ophtha.2013.05.017. Epub 2013 Jun 29. PMID: 23816432.
- Harris A, Zarfati D, Zalish M, Biller J, Sheets CW, Rechtman E, Migliardi R, Garzozi HJ. Reduced cerebrovascular blood flow velocities and vasoreactivity in open-angle glaucoma. Am J Ophthalmol. 2003 Feb;135(2):144-7. doi: 10.1016/s0002-9394(02)01927-x. PMID: 12566016.
- Arslan GD, Olgun A, Ozcan D, Gökcal E, Guven D, Asil T. Assessment of Cerebral Vasomotor Reactivity in Patients with Primary Open Angle Glaucoma and Ocular Hypertension using the Breath-Holding Index. J Glaucoma. 2020 Oct 16. doi: 10.1097/IJG.0000000000001711. Epub ahead of print. PMID: 33074963.
- Faiq MA, Wollstein G, Schuman JS, Chan KC. Cholinergic nervous system and glaucoma: From basic science to clinical applications. Prog Retin Eye Res. 2019 Sep;72:100767. doi: 10.1016/j.preteyeres.2019.06.003. Epub 2019 Jun 23. PMID: 31242454; PMCID: PMC6739176.
- Williams AL, Lackey J, Wizov SS, Chia TM, Gatla S, Moster ML, Sergott R, Spaeth GL, Lai S. Evidence for Widespread Structural Brain Changes in Glaucoma: A Preliminary Voxel-Based MRI Study. Invest Ophthalmol Vis Sci. 2013 Aug 28;54(8):5880-7. doi: 10.1167/iovs.13-11776. PMID: 23838767.
- Lu H, Liu P, Yezhuvath U, Cheng Y, Marshall O, Ge Y. MRI mapping of cerebrovascular reactivity via gas inhalation challenges. J Vis Exp. 2014 Dec 17;(94):52306. doi: 10.3791/52306. PMID: 25549106; PMCID: PMC4396915.
- Liu P, Li Y, Pinho M, Park DC, Welch BG, Lu H. Cerebrovascular reactivity mapping without gas challenges. Neuroimage. 2017 Feb 1;146:320-326. doi: 10.1016/j.neuroimage.2016.11.054. Epub 2016 Nov 23. PMID: 27888058; PMCID: PMC5321860.
Figures
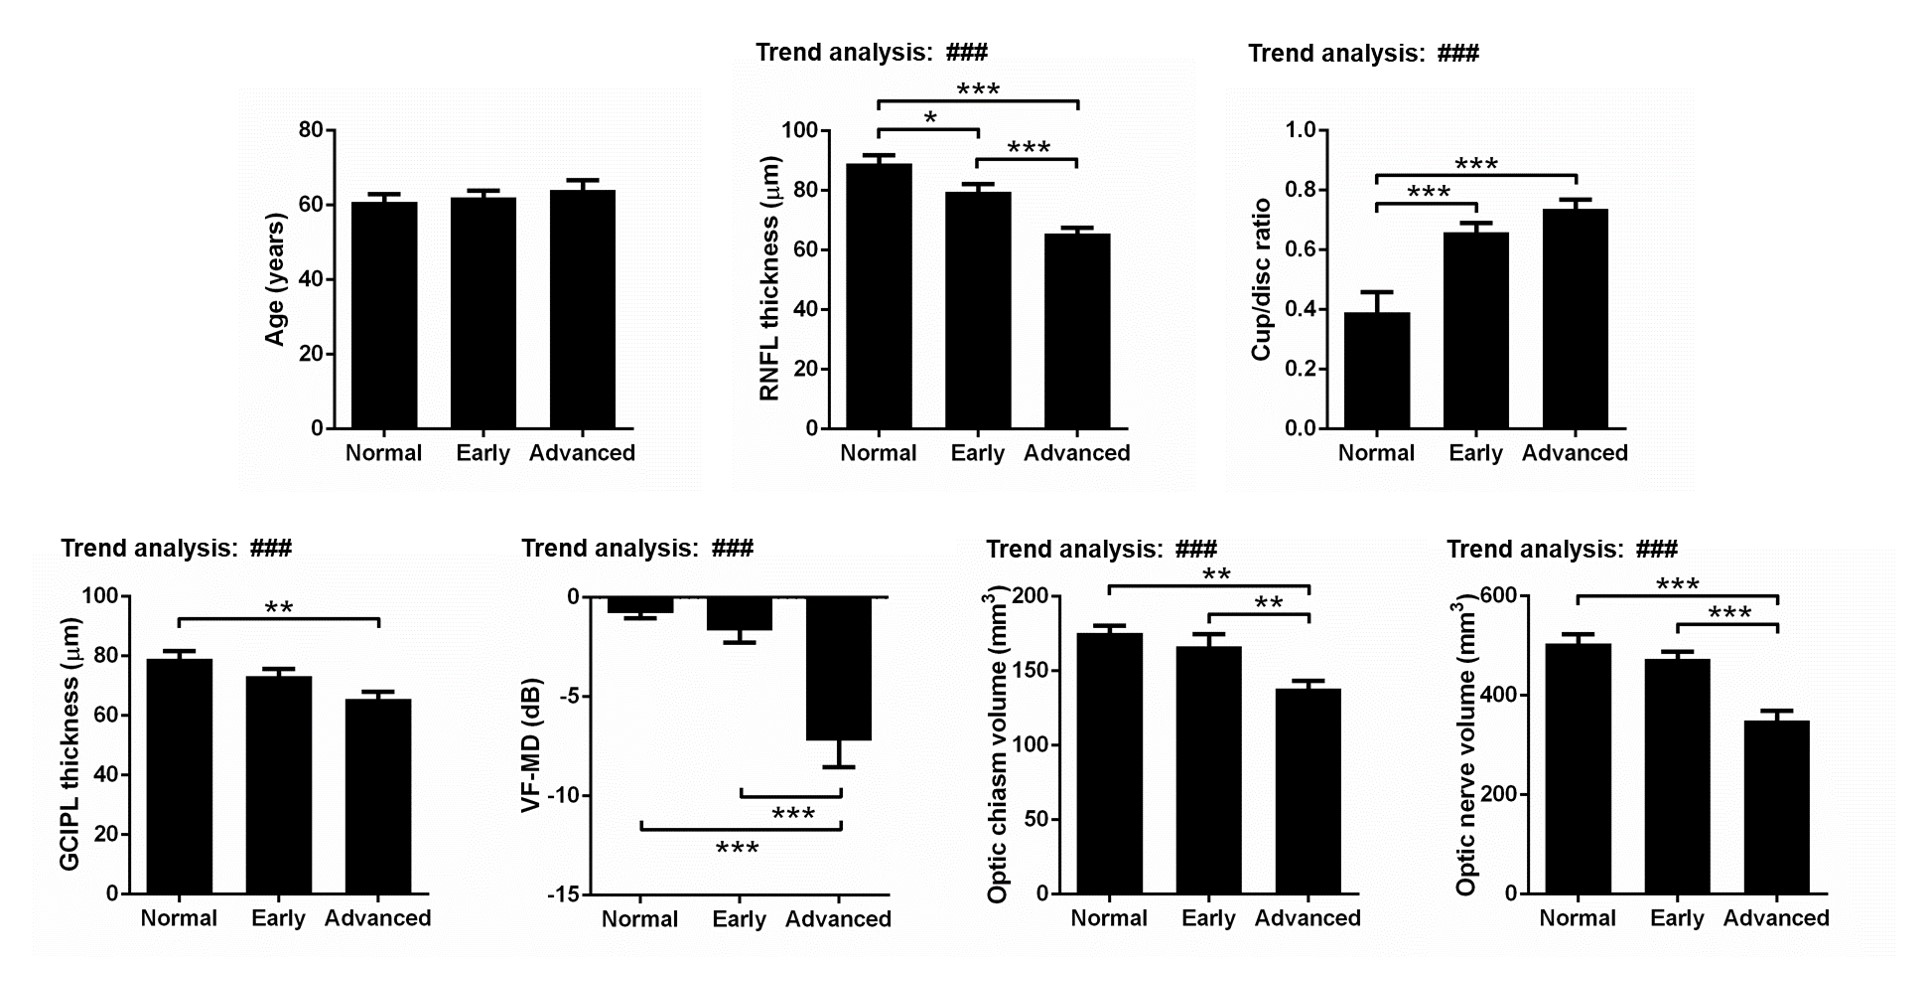
Figure 1: Clinical ophthalmic assessments confirmed normal control and glaucoma groups. RNFL thickness, GCIPL thickness, VF-MD, optic
nerve volume and optic chiasm volume have decreasing trends with glaucoma severity,
while cup/disc ratio has an increasing trend. These confirmed the normal
control, early-stage glaucoma and advance-stage glaucoma groups. One-way ANOVA
followed by Bonferroni’s post hoc test (*p<0.05, **p<0.01 and ***p<0.001)
and trend analysis (###p<0.001) were applied. Error bars indicate
±SEM.
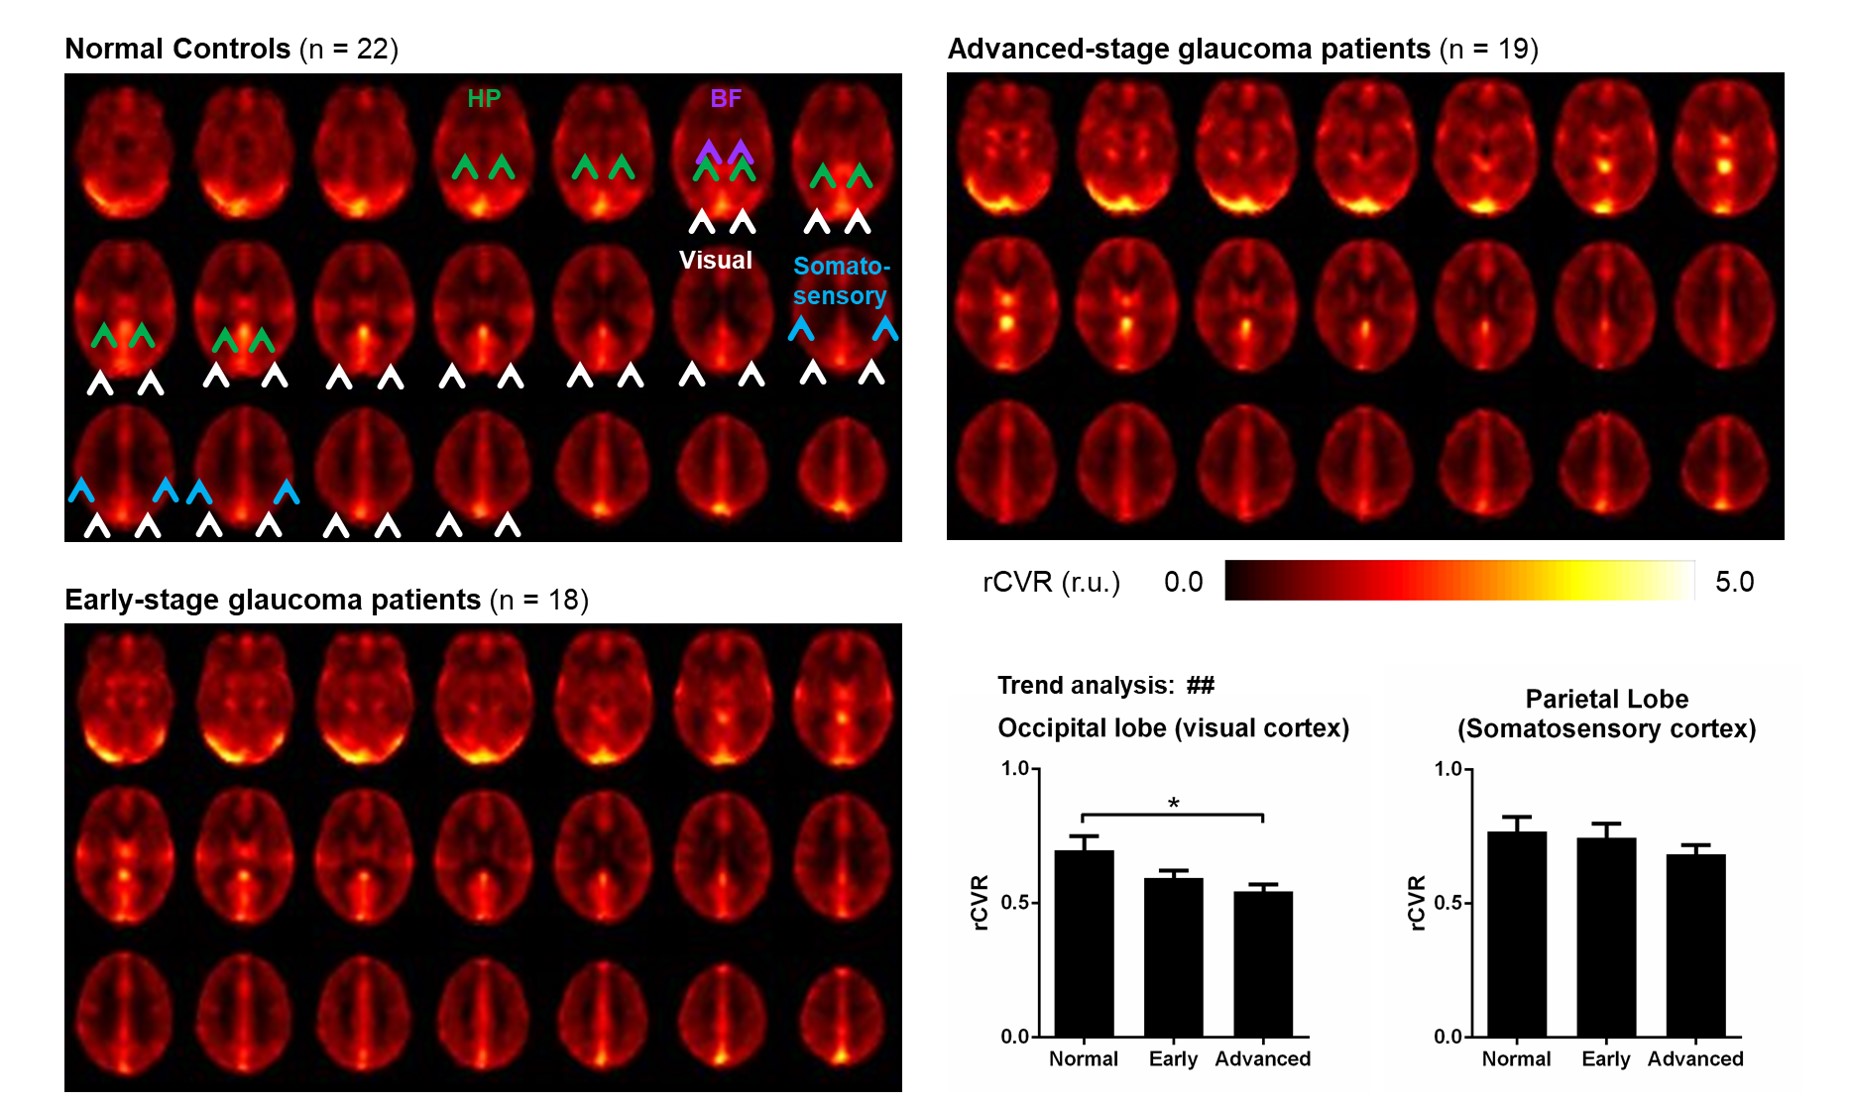
Figure 2: Advanced-stage glaucoma patients have
significantly lower rCVR in visual cortex. Averaged rCVR maps were calculated for normal controls, early-stage glaucoma patients,
and advanced-stage glaucoma patients. Advanced-stage glaucoma patients have
significantly lower rCVR in the visual cortex. In addition, rCVR in the visual
cortex has a decreasing trend with glaucoma severity. These were not observed
in the somatosensory cortex. One-way ANOVA followed by Bonferroni’s post hoc
test (*p<0.05) and trend analysis (##p<0.01) were applied. Error bars indicate ±SEM.
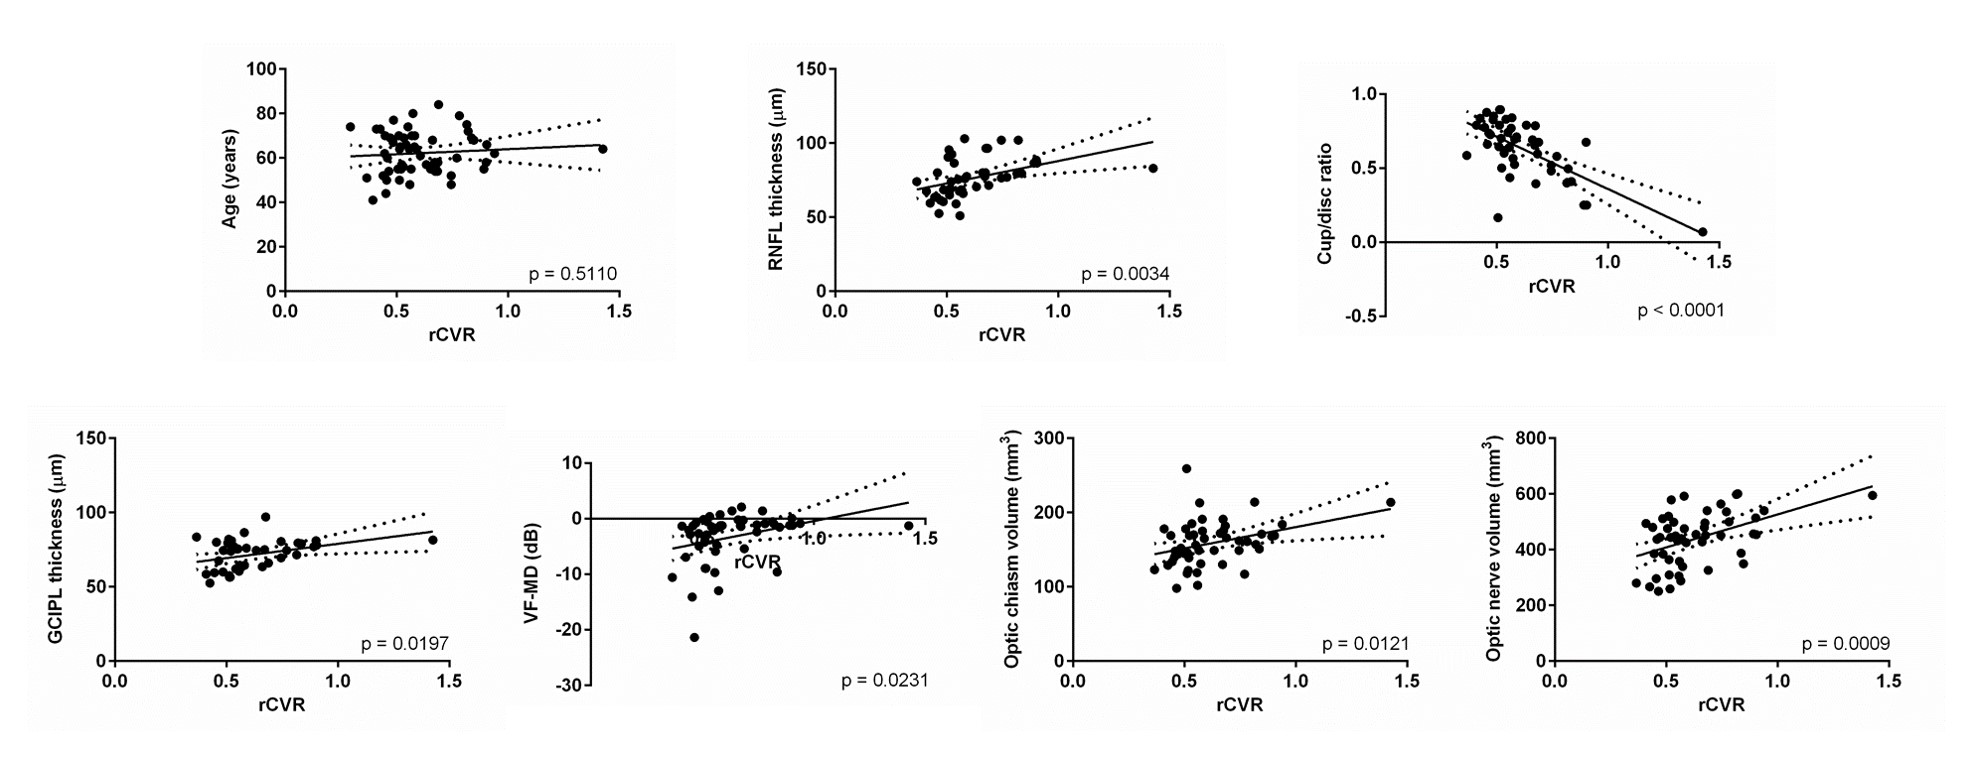
Figure 3: Visual cortical rCVR is coupled with clinical
ophthalmic assessments and volumetric MRI assessments. Scatter plots show the
relationship between rCVR in visual cortex and age, clinical ophthalmic
assessments, as well as volumetric MRI assessments. Visual cortical rCVR is
positively correlated with RNFL thickness, GCIPL thickness, VF-MD, optic chiasm
volume and optic nerve volume, while negatively correlated with cup/disc ratio.
No significant correlation was found between visual cortical rCVR and age.
Linear regression was applied.
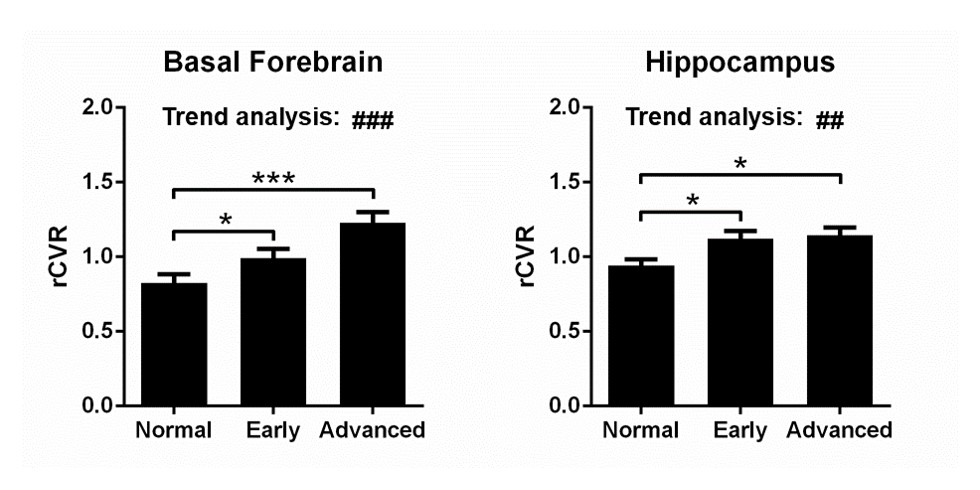
Figure 4: Basal forebrain and hippocampus play a role in glaucoma. Early-stage and advanced-stage glaucoma
patients have significantly higher rCVR in the basal forebrain and hippocampus
compared to normal controls. rCVR in the basal forebrain and hippocampus also
have an increasing trend with glaucoma severity. These results indicate that
the basal forebrain and hippocampus play a role in glaucoma. One-way ANOVA
followed by Bonferroni’s post hoc test (*p<0.05 and ***p<0.001) and trend
analysis (##p<0.01 and ###p<0.001) were applied. Error
bars indicate ±SEM.
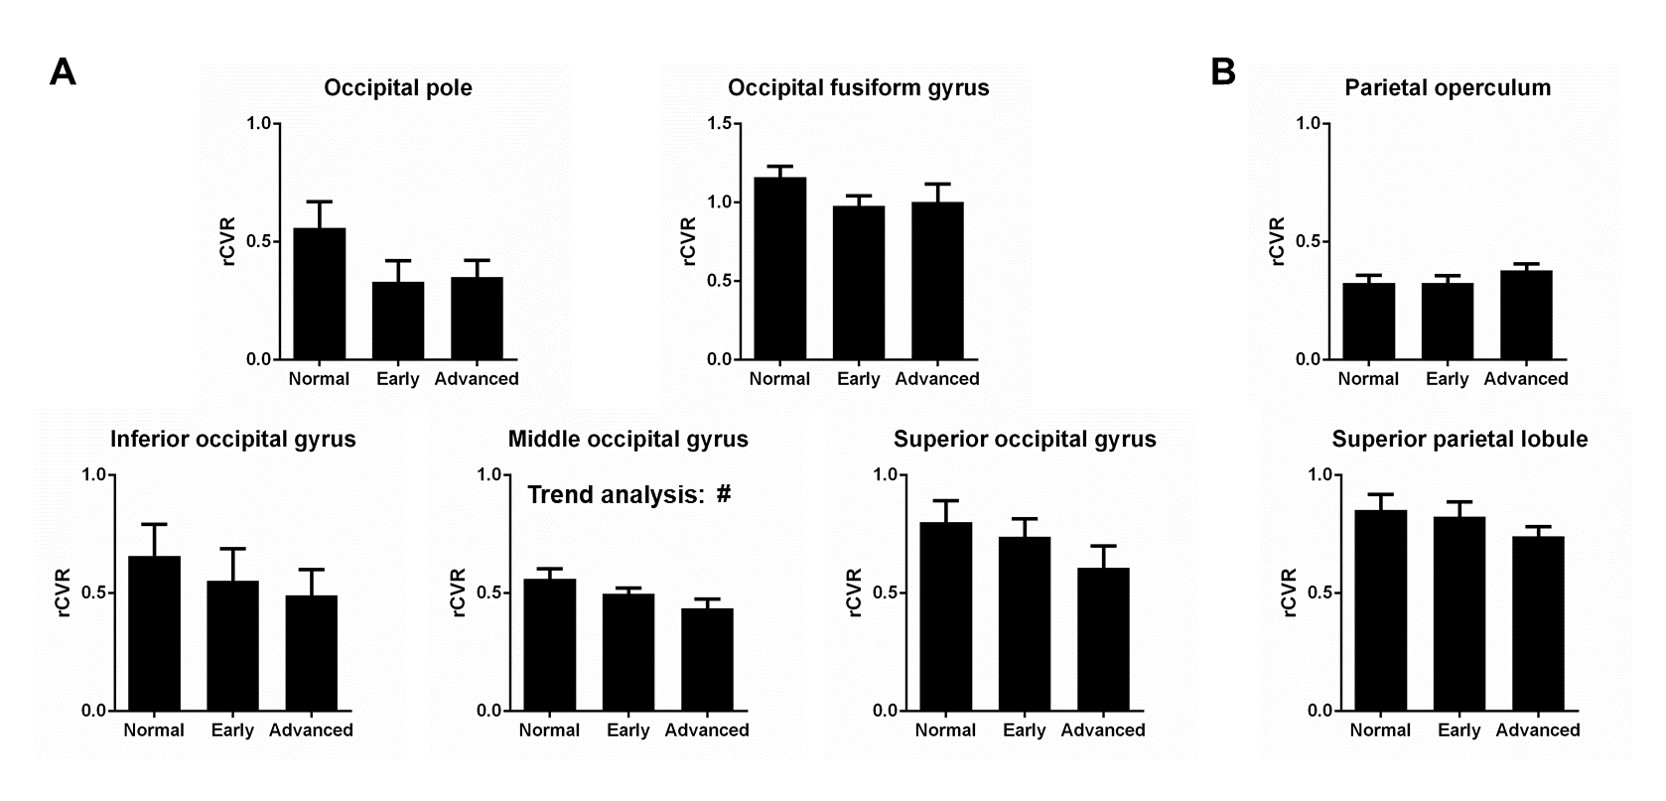
Figure 5: Sub-regional quantification of the occipital
lobe (visual cortex) and the parietal lobe (somatosensory cortex). Although not statistically significant (besides
middle occipital gyrus), slight differences in trends are apparent between
sub-regions. Future studies with a larger sample size can elucidate how
different sub-regions play a role in glaucoma. One-way ANOVA followed by
Bonferroni’s post hoc test and trend analysis (#p<0.05) were
applied. Error bars indicate ±SEM.