0162
Altered brain functional network dynamics in obsessive-compulsive disorder
Lekai Luo1, Qian Li1, Wanfang You1, Yuxia Wang1, Yanchun Yang2, Qiyong Gong1, and Fei Li1
1Huaxi MR Research Centre (HMRRC), Department of Radiology, West China Hospital of Sichuan University, Chengdu, China, 2Psychiatry, West China Hospital of Sichuan University, Chengdu, China
1Huaxi MR Research Centre (HMRRC), Department of Radiology, West China Hospital of Sichuan University, Chengdu, China, 2Psychiatry, West China Hospital of Sichuan University, Chengdu, China
Synopsis
Dynamic functional connectivity (dFC) and dynamic topological analyses were used to investigate the whole brain resting-state dynamic property abnormalities in patients with obsessive-compulsive disorder (OCD). Our results provide evidence of clinically relevant aberrant dynamic brain activity in OCD. Increased functional segregation among networks and impaired functional flexibility in connections among brain regions in default mode network (DMN) and salience network (SAN) may play important roles in the neuropathology of OCD.
Introduction
OCD is a debilitating and disabling neuropsychiatric disorder characterized by intrusive thoughts and repetitive or ritualistic behaviors. The neurobiological basis of OCD remains largely unclear. Traditional resting state functional magnetic resonance imaging (rfMRI) studies have found aberrant static FC in OCD. However, the brain is a highly dynamic system with non-stationary and rapidly-changing neural activities1, and this information is lost in static FC analysis. Currently, alterations in whole-brain FC and topological properties in the context of brain dynamics remain relatively unexplored in OCD.Methods
Twenty-nine patients with OCD and 40 matched healthy controls (HC) participated in this study (Table 1). The rfMRI were collected using a 3T GE scanner (TR/TE=2000ms/30ms, flip angle=90°, slice thickness=5mm with no gap, voxel size=3.75×3.75×5mm3). After preprocessing, group independent component analysis was used to obtain 100 independent components (ICs) and 51 ICs were selected as meaningful and sorted into eight functional networks (Fig. 1A). We used a sliding-window approach (window size=22TR, step=1TR) to generate dFC matrices2, then dFC patterns were clustered into multiple reoccurring states, and state transition metrics were obtained. To ensure the validity of the results, we used a 30TR window size to replicate the analysis. Besides, graph-theory methods were applied to dFC matrices to calculate the temporal variability of nodal degree centrality (DC) and efficiency of each IC. Permutation tests (10000 iterations) were used to assess group differences of all brain dynamic measures. Significance was set at P<0.05 with false discovery rate (FDR) correction for state transition metrics, and false positive adjustment3 for nodal dynamic topological metrics. We also explored the correlation between altered dynamic metrics and clinical measures for heuristic purposes (nominal significance P<0.05).Results
We found three dFC states across all subjects: state 1 occurred in a moderate proportion (31%), and showed the lowest mean FC between networks; state 2 occurred in a low proportion (14%), and showed the highest mean FC within and between networks; state 3 occurred most frequently (55%), and showed moderate mean FC within and between networks (Fig. 1B and 1C). OCD and HC showed similar cluster centroids, and we visualized the top 5% FC with the strongest connections: in state 1, the strongest connections mainly located within DMN and SAN with positive coupling, and between the two networks with negative coupling; in state 2 and 3, the strongest connections scattered within and between many networks with positive coupling (Fig. 2). For state transition metrics, patients with OCD showed both greater fractional time (P=0.034) and mean dwell time (P=0.017) in state 1 than control (Fig. 3A and 3B). Besides, fractional time of state 1 was positively correlated with HARS scores in OCD (r=0.487, P=0.017) (Fig. 3D). Validation analysis showed repeatable results.For dynamic topological analysis, OCD showed decreased temporal variability of DC and efficiency in IC 28 (both P=0.004) and IC 36 (P=0.006 and P=0.006 respectively), as well as decreased variability of DC in IC 57 (P=0.019) compared with controls (Fig. 4A). IC 28 and IC 36 located in DMN, IC 57 located in SAN (Fig. 4C). Correlation analysis showed variability of DC and efficiency in IC 36 was negatively correlated with illness duration (r=-0.468, P=0.018; r=-0.457, P=0.022 respectively), and variability of DC in IC 57 was negatively correlated with obsessive subscale score (r=-0.398, P=0.049) (Fig. 4B).
Discussion
For dFC state analysis, we found OCD spent more time in state 1. Previous static rfMRI studies in OCD found lower FC between DMN and SAN4, 5, therefore our findings that a higher occurrence of the state with the lowest FC between the two networks might be the neural substrate for the decreased static FC between DMN and SAN in OCD. Moreover, the fractional time of state 1 was positively correlated with anxiety ratings, which are a characteristic of OCD6, 7. Thus, the inability to shift from state 1 might reflect a parallel inability to shift thinking about obsessive concerns associated with increased anxiety8. These results indicated an abnormal functional relationship between DMN and SAN as a core feature underpinning the neurophysiological basis of OCD.For dynamic topological analysis, we also found decreased temporal variability of ICs in DMN and SAN in OCD. Decreased dynamics of these regions suggest reduced efficiency or flexibility in their communication with other brain regions. A previous study found regions in SMN, SAN, and DMN exhibit stronger mean FC and lower temporal variability than other brain areas9. Regions that tend to maintain a high level of FC are likely to be less easily modulated based on contextual demands2, perhaps contributing to their vulnerability in ways that increase the cognitive and behavioral rigidity that characterizes OCD. Furthermore, we found negative correlations between dynamics of these regions and both illness duration and obsession symptom ratings in patients, which offers preliminary evidence for progressive brain abnormalities in this network in OCD.
Conclusion
Our results provide evidence of clinically relevant aberrant dynamic brain activity in OCD. Increased functional segregation among networks and impaired functional flexibility in connections among brain regions in DMN and SAN may play important roles in the neuropathology of OCD.Acknowledgements
This study was supported by the National Natural Science Foundation (Grant Nos. 81621003, 81761128023, 81820108018, 81227002, and 81401396) and Program for Changjiang Scholars and Innovative Research Team in University (PCSIRT, Grant No. IRT16R52) of China. Dr. Qiyong Gong would also like to acknowledge the support from his Changjiang Scholar Professorship Award (No. T2014190) of China. Dr. Fei Li would like to acknowledge the support from the Sichuan Science and Technology Program (2019YJ0098).References
- Fu, Z., et al., Characterizing dynamic amplitude of low-frequency fluctuation and its relationship with dynamic functional connectivity: An application to schizophrenia. Neuroimage. 180(Pt B),619-631 (2018).
- Allen, E.A., et al., Tracking whole-brain connectivity dynamics in the resting state. Cereb Cortex. 24(3),663-76 (2014).
- Fornito, A., et al., General and specific functional connectivity disturbances in first-episode schizophrenia during cognitive control performance. Biol Psychiatry. 70(1),64-72 (2011).
- Cyr, M., et al., Altered network connectivity predicts response to cognitive-behavioral therapy in pediatric obsessive-compulsive disorder. Neuropsychopharmacology2020).
- Chen, Y.H., et al., Decreased Intrinsic Functional Connectivity of the Salience Network in Drug-Naive Patients With Obsessive-Compulsive Disorder. Front Neurosci. 12,889 (2018).
- Weidt, S., et al., Common and differential alterations of general emotion processing in obsessive-compulsive and social anxiety disorder. Psychol Med. 46(7),1427-36 (2016).
- Swartz, J.R., et al., Altered activation of the rostral anterior cingulate cortex in the context of emotional face distractors in children and adolescents with anxiety disorders. Depress Anxiety. 31(10),870-9 (2014).
- Hirschtritt, M.E., M.H. Bloch, and C.A. Mathews, Obsessive-Compulsive Disorder: Advances in Diagnosis and Treatment. JAMA. 317(13),1358-1367 (2017).
- Shou, G., et al., Whole-brain electrophysiological functional connectivity dynamics in resting-state EEG. J Neural Eng. 17(2),026016 (2020).
Figures
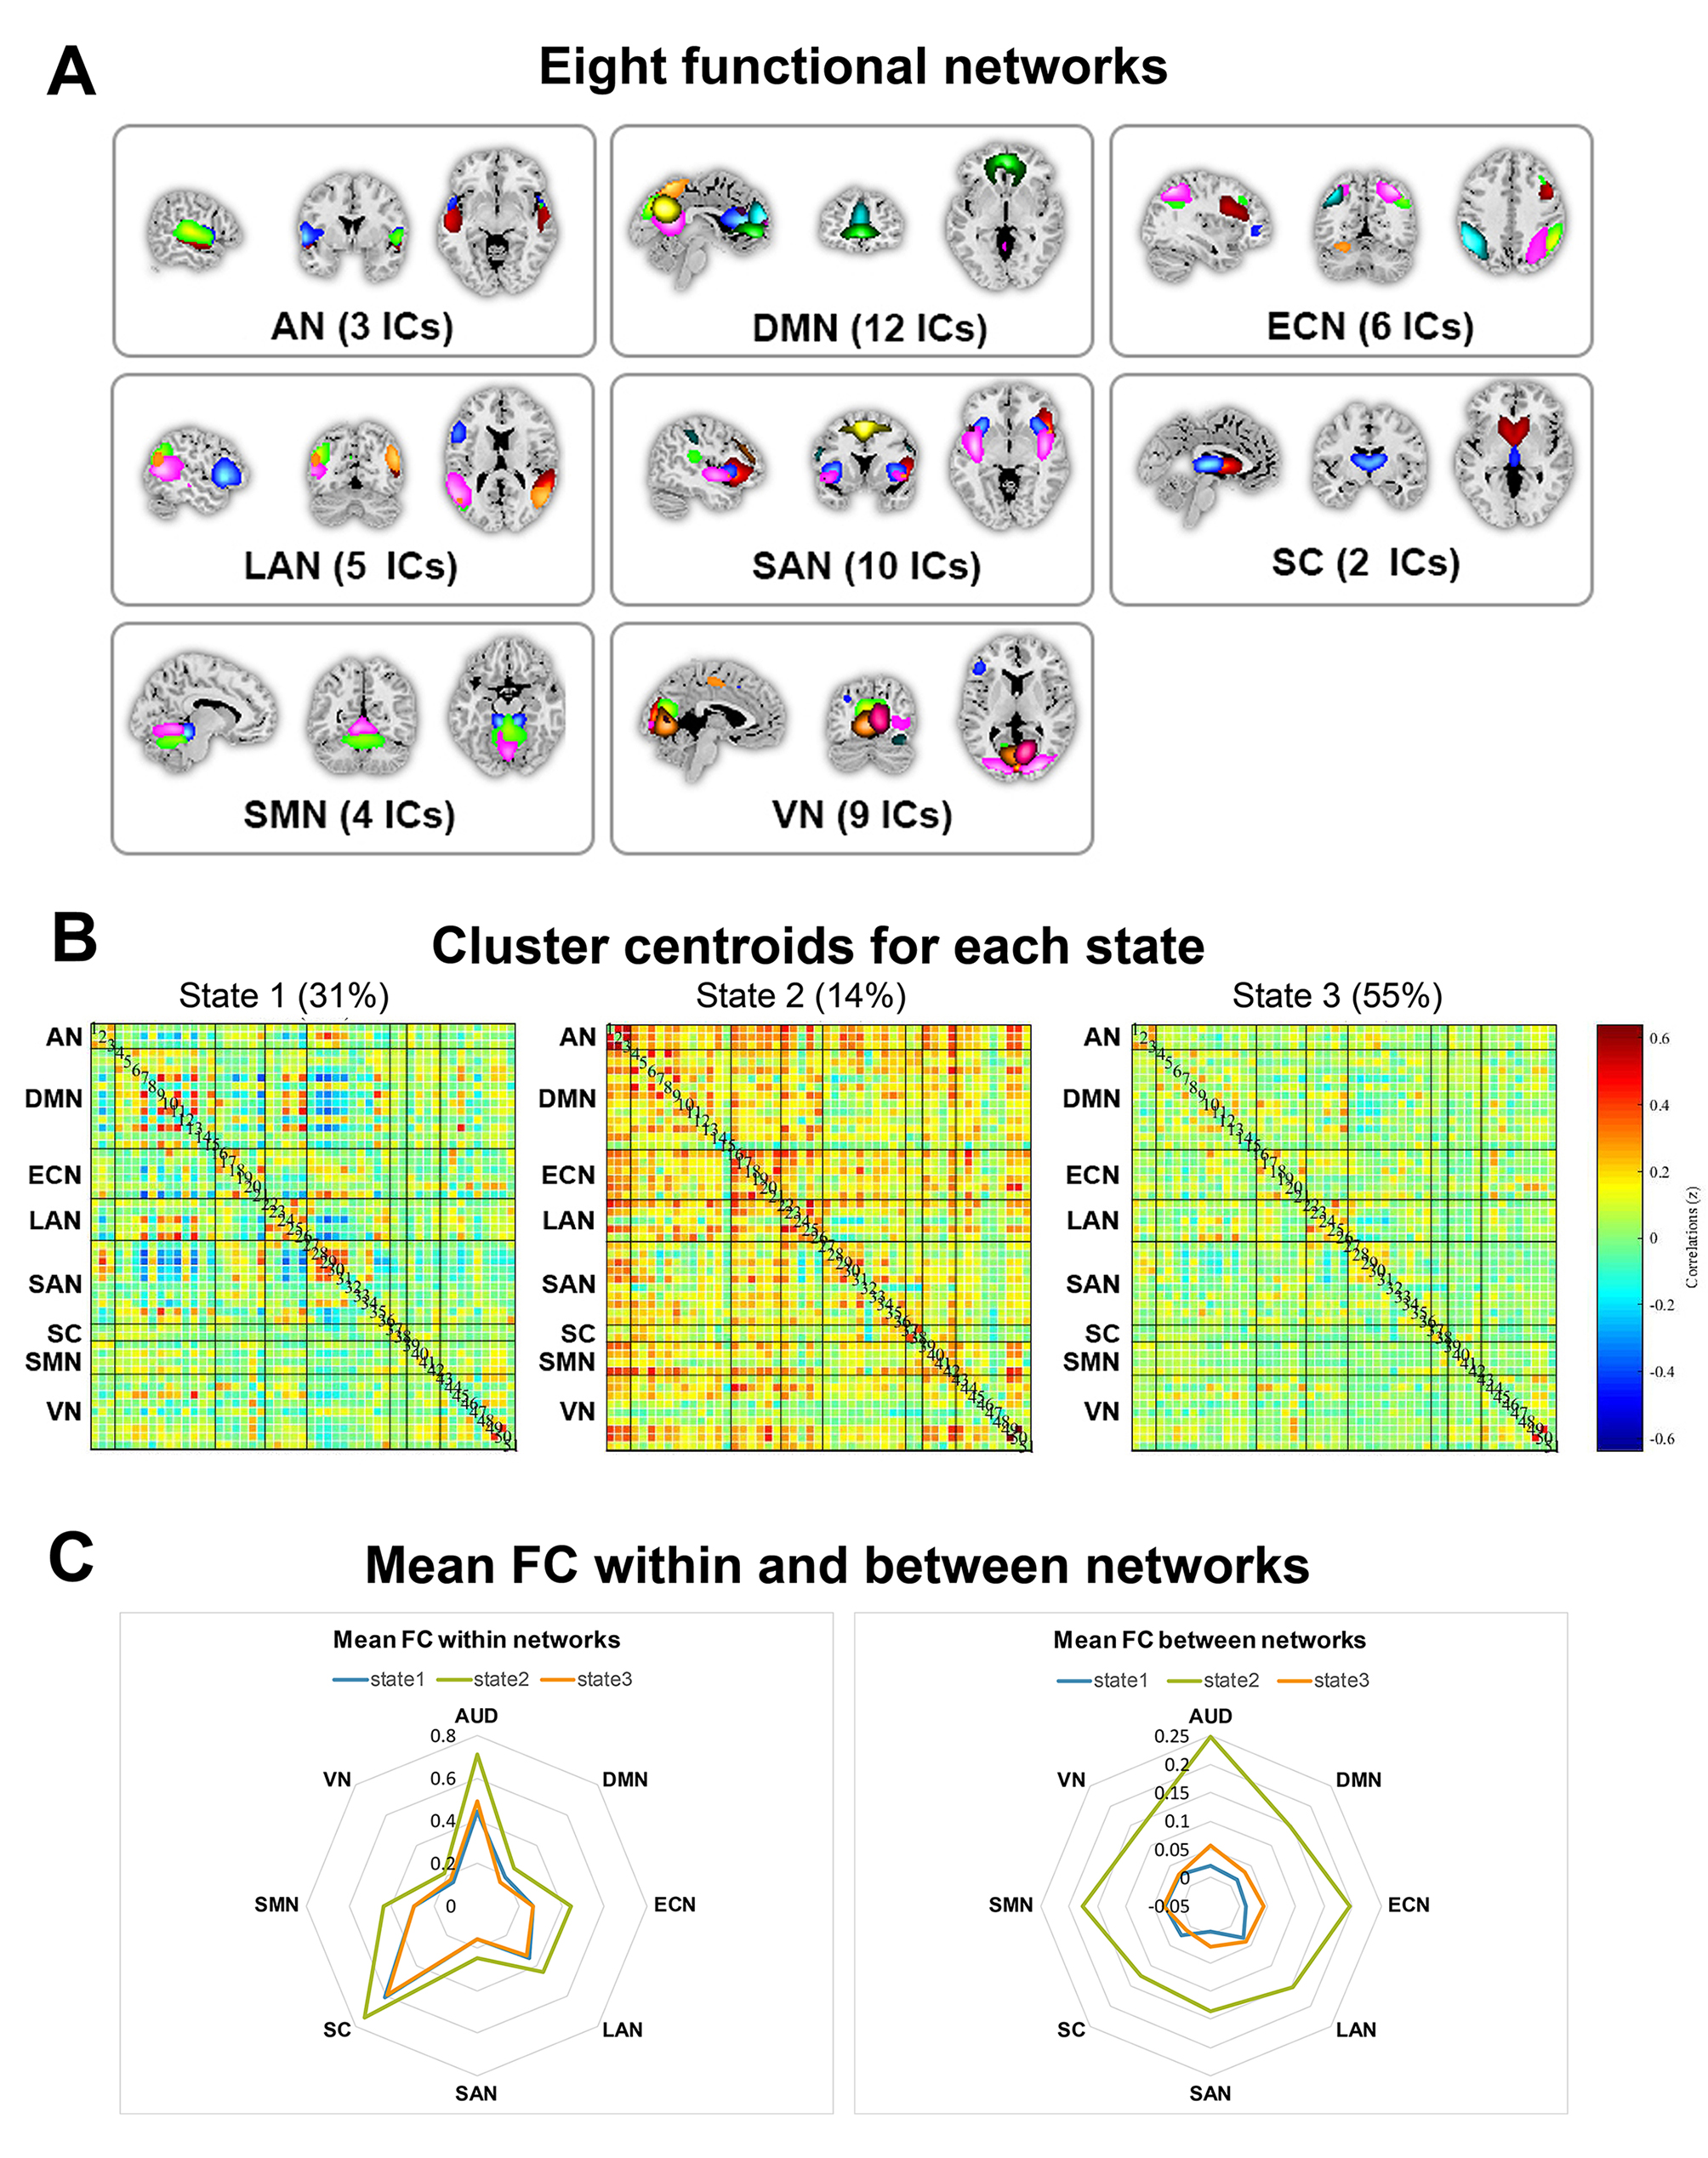
Fig. 1. A.
Eight functional networks: auditory network (AN), default mode network (DMN),
executive control network (ECN), language network (LAN), salience network
(SAN), subcortical network (SC), sensorimotor network (SMN), and visual network
(VN). B. Cluster centroids for each
state. C. The radar map of the mean
FC strength within and between networks for three states.
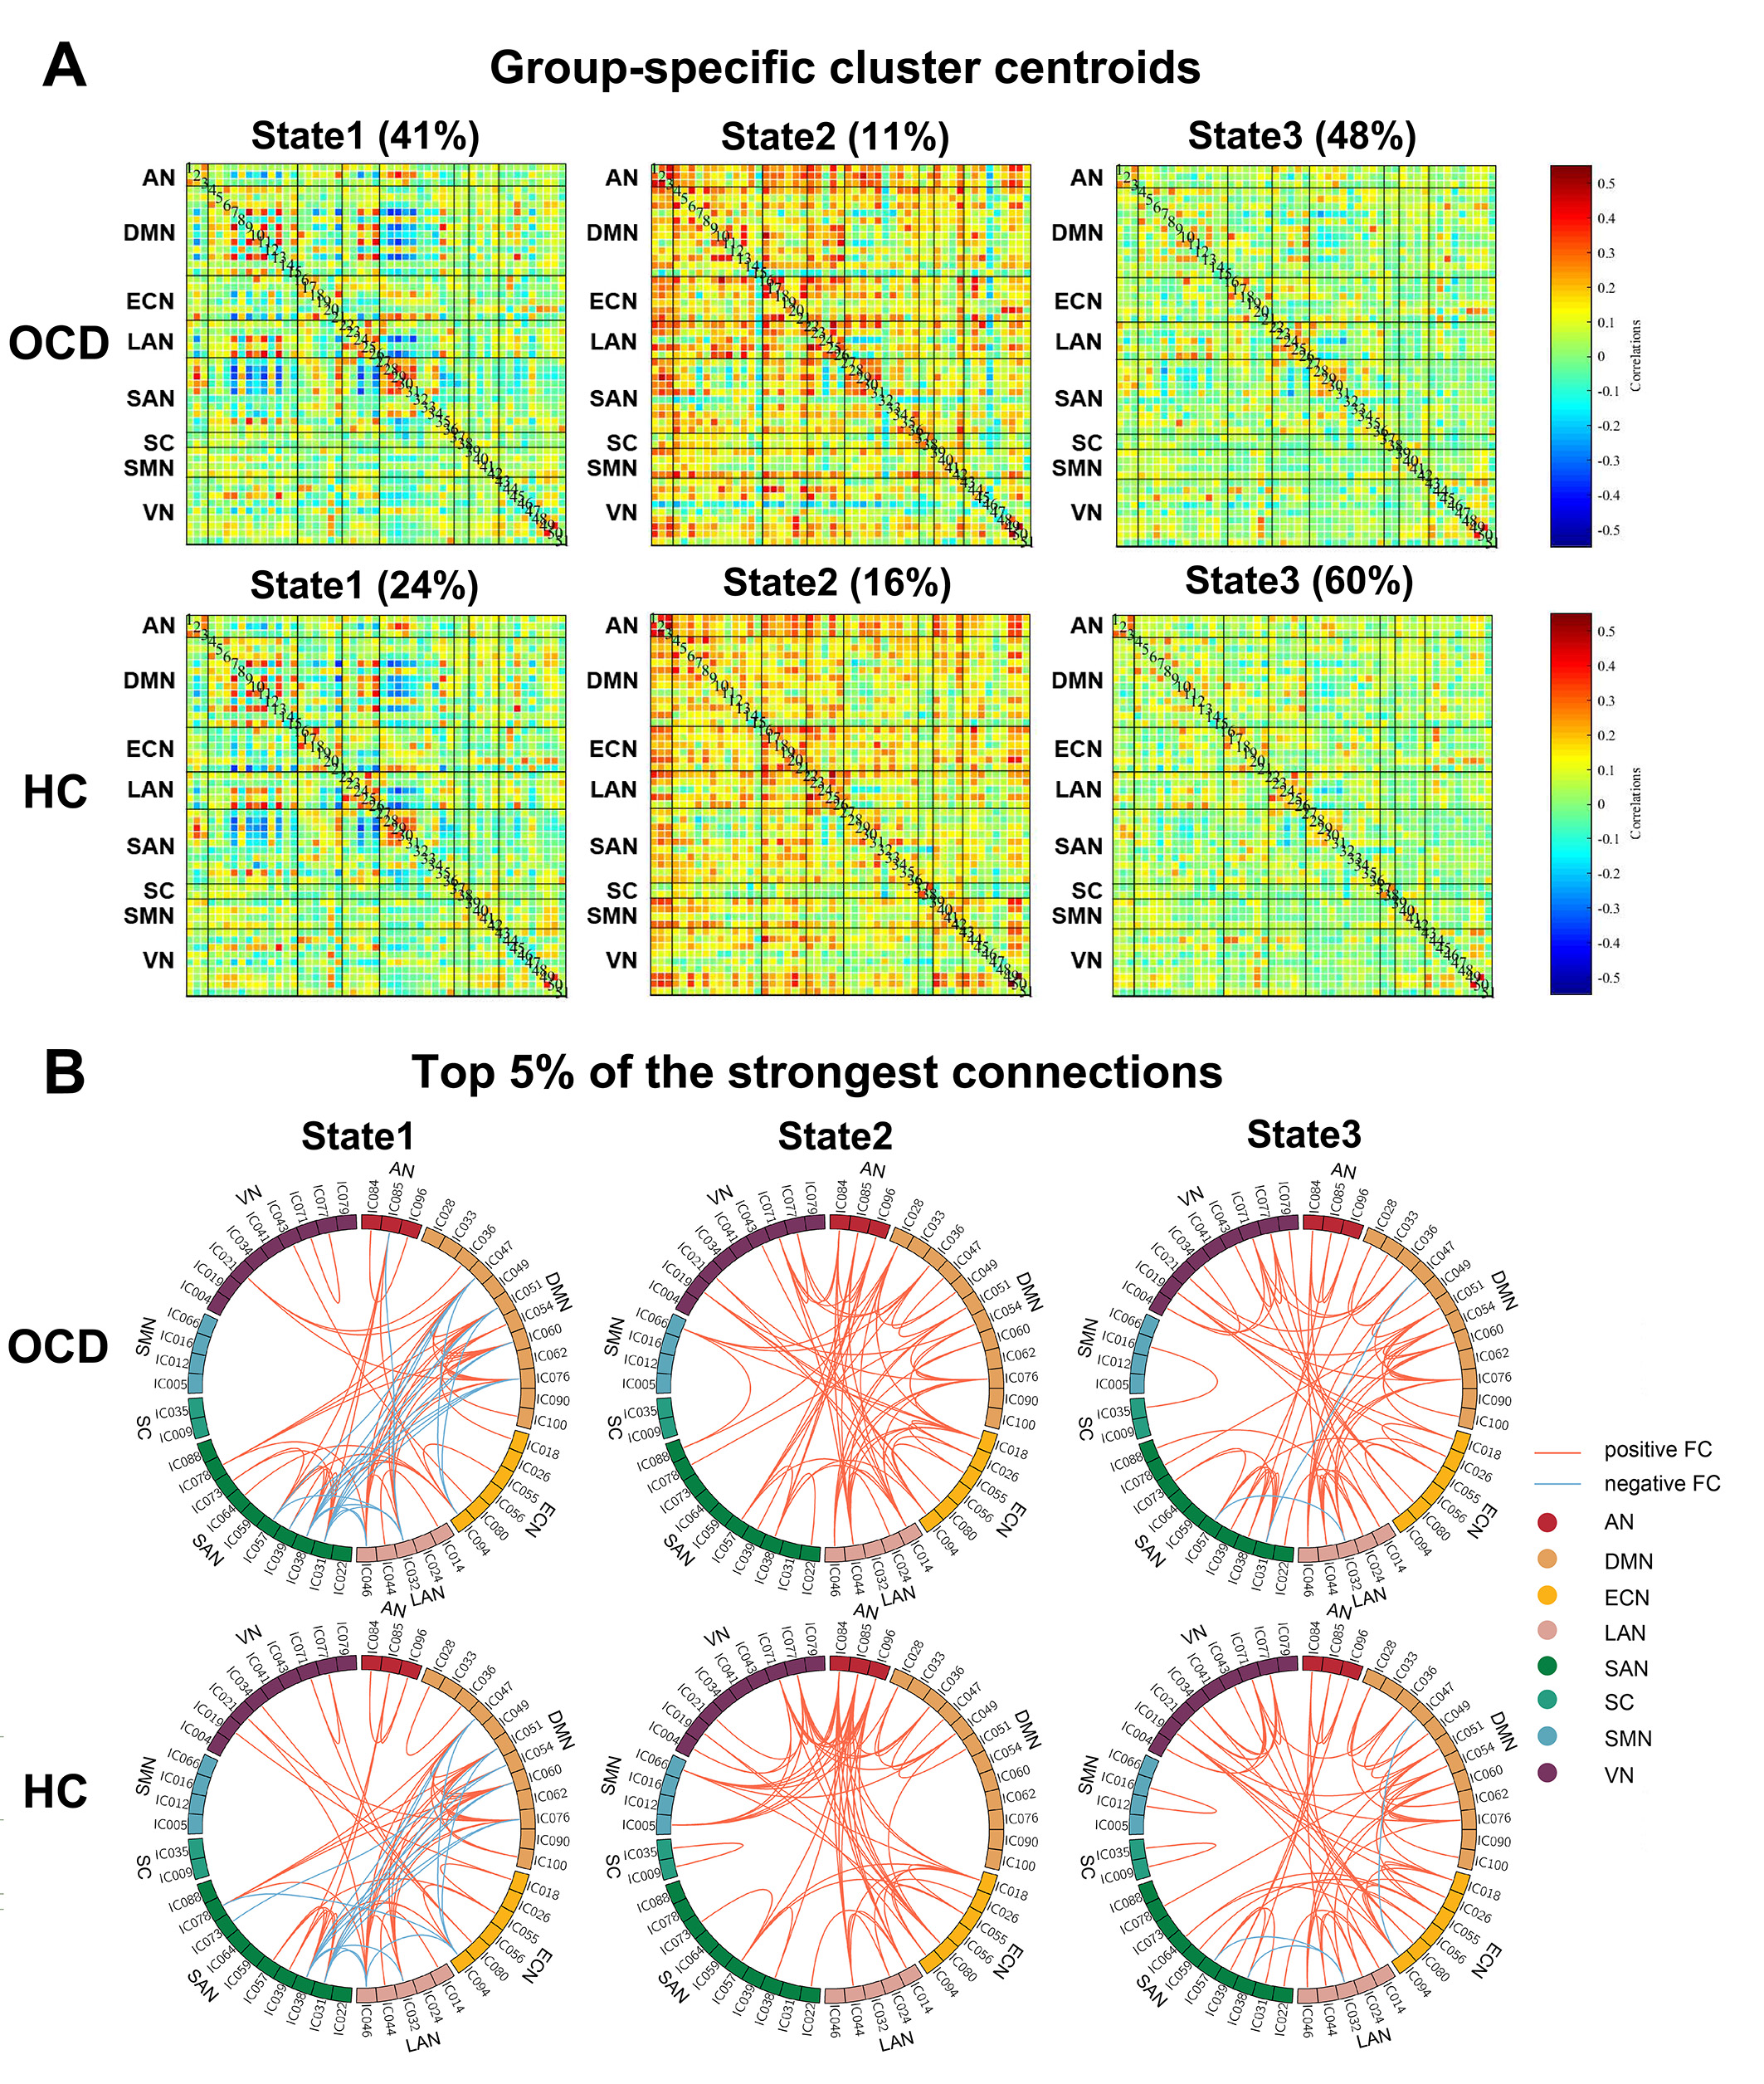
Fig. 2.
Centroids of dynamic functional connectivity (FC) states and connections with
the top 5% in FC strength in patients with obsessive-compulsive disorder (OCD) and
healthy controls (HC) under the window size of 22-TR.
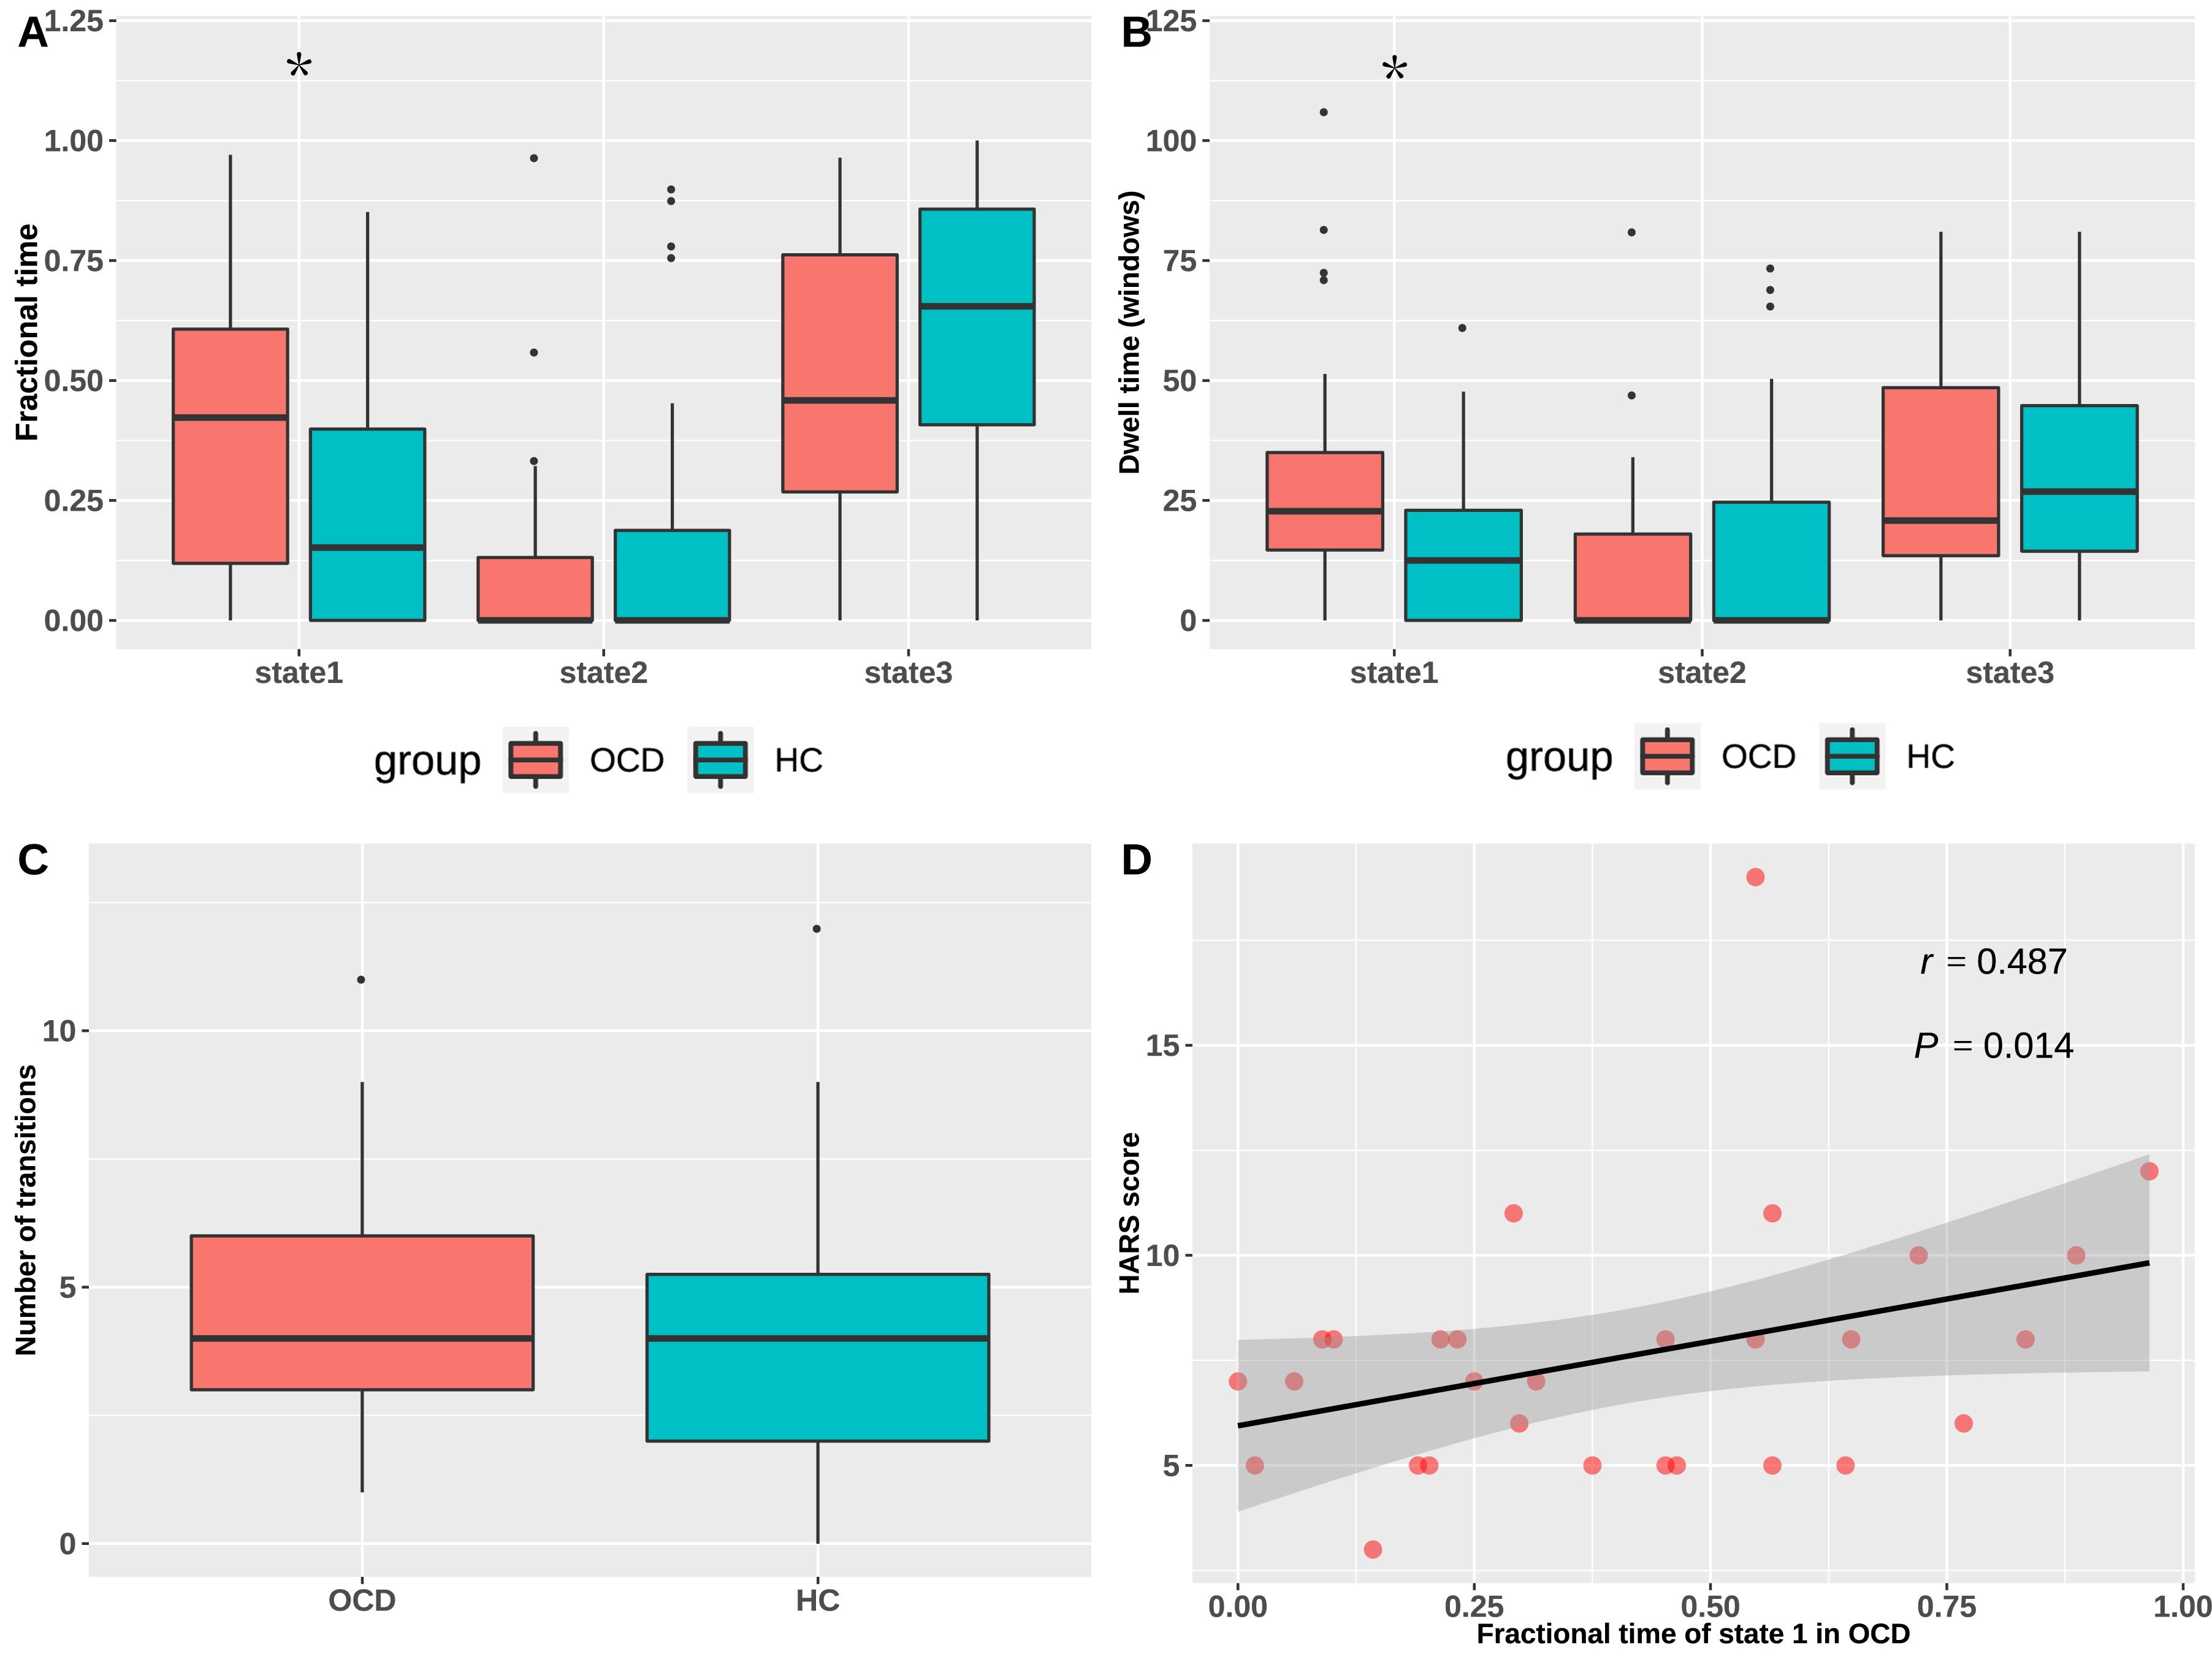
Fig. 3. State transition
vectors in patients and controls, and the correlation between state transition
vectors and clinical symptom ratings, in patients with obsessive-compulsive
disorder.
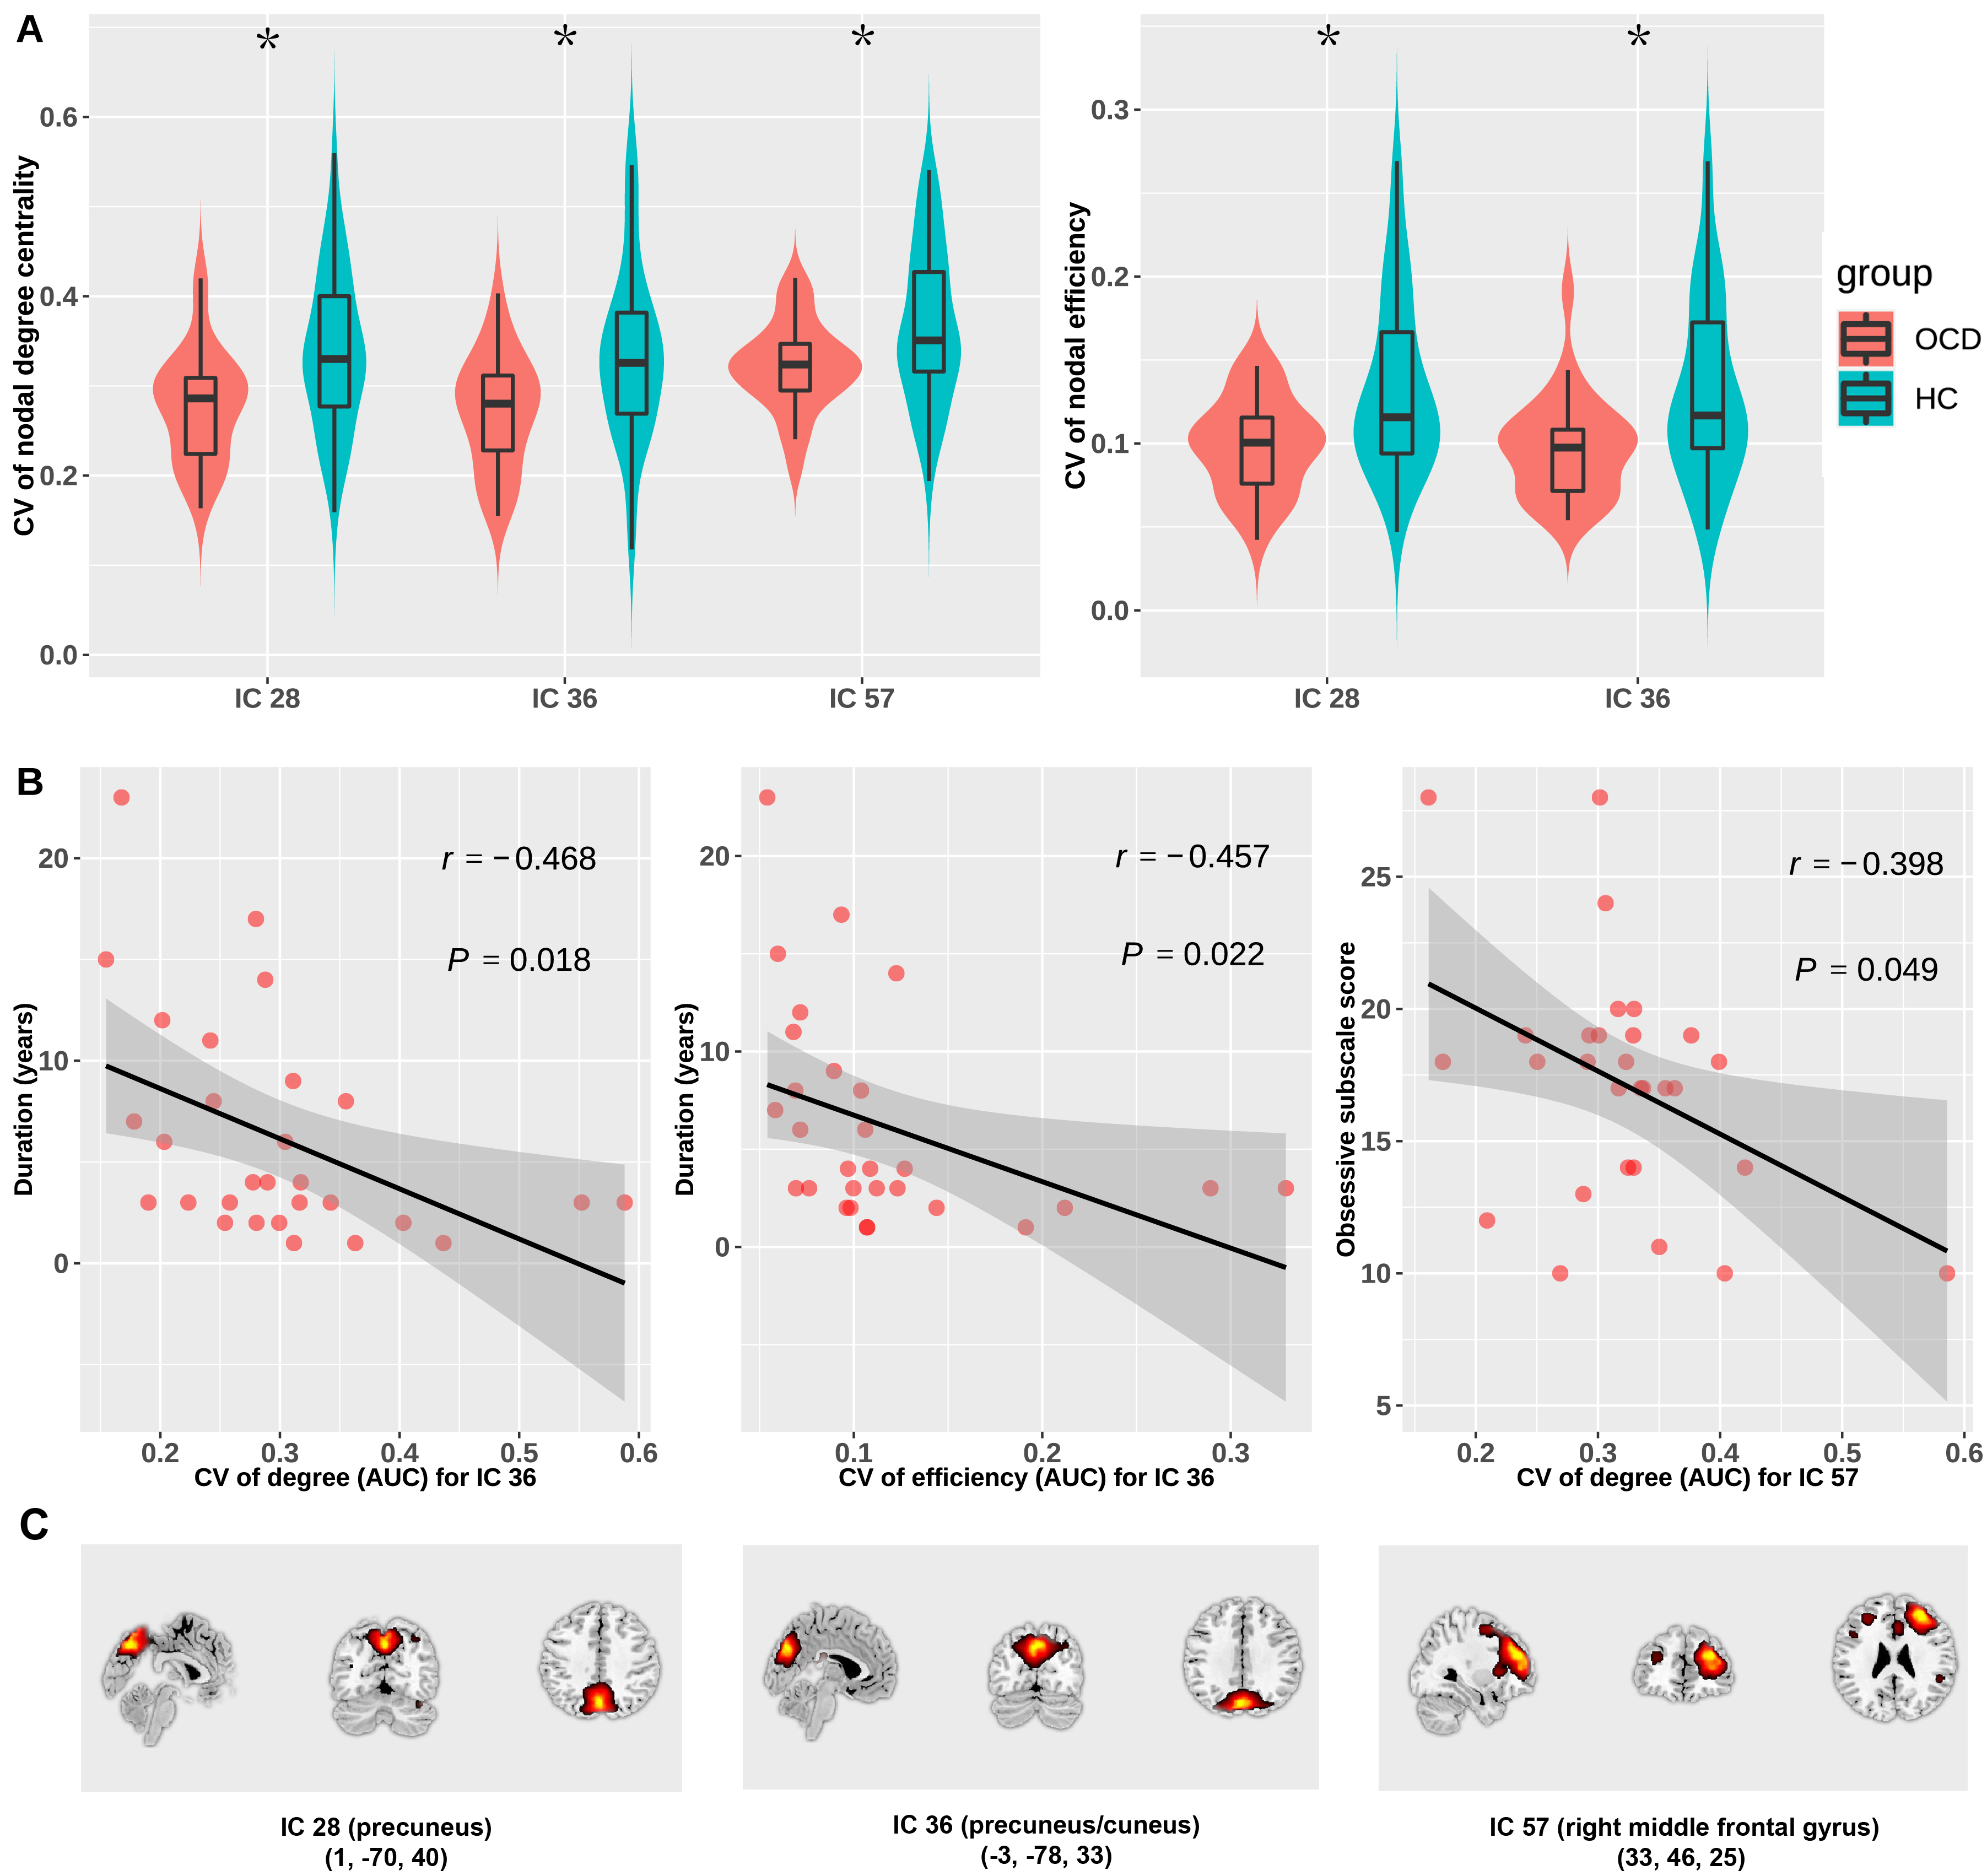
Fig. 4. Group
comparisons of dynamic topological metrics (A) and the correlations between
dynamic topological metrics and illness duration and clinical symptom ratings
in OCD patients (B and C).
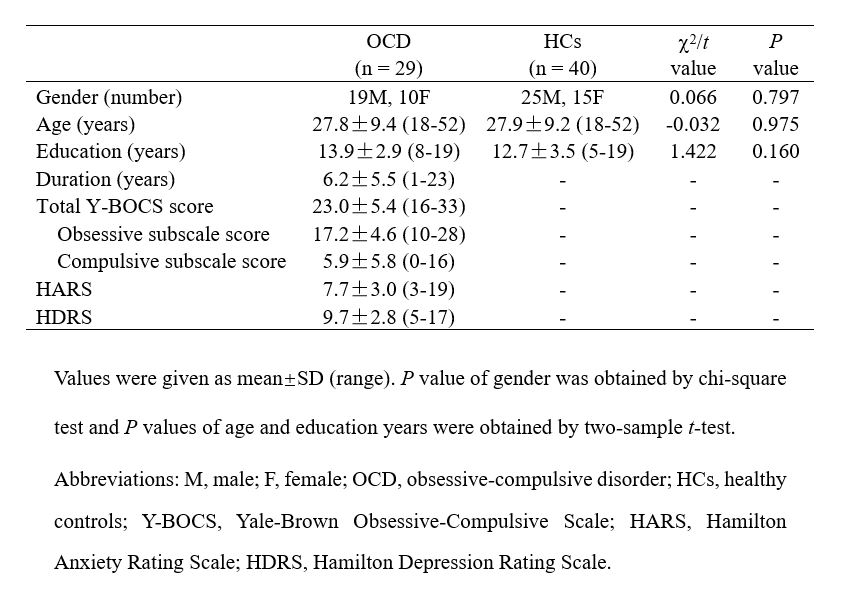
Table 1.
Demographic and clinical characteristics of study participants.