0161
Neuroimaging and obesity in adults with pre-diabetes or diabetes: results from the UK Biobank1University of Toronto, Scarborough, ON, Canada, 2Department of Medical Biophysics, University of Toronto, Toronto, ON, Canada, 3Sunnybrook Research Institute, Toronto, ON, Canada
Synopsis
Glycated haemoglobin and body mass index (BMI) are implicated in neurodegeneration and diabetes. Diabetes-related changes in T2* estimates and fractional amplitude of low frequency fluctuations (fALFFs) are less understood. We investigated these neuroimaging estimates within the thalamic nuclei, hippocampi, and caudate nuclei of the UK Biobank-derived pre-diabetes and diabetes adult groups. Multiple regression analyses elucidated BMI as the robust predictor of hippocampal T2* estimates in both subgroups. These metrics extracted from two pulse sequences were helpful in understanding the brain and BMI associations, which is important in the assessment of diabetes and pre-diabetes as a risk factor for neurodegenerative disorders.
Introduction
Diabetes is a chronic metabolic disorder that can have numerous cardiovascular and neurological health consequences. Blood and body composition markers, such as glycated haemoglobin (HbA1c) and body mass index (BMI), may be important in our understanding of diabetes-related changes in the brain.1,2 The current study investigates functional and microstructural brain metrics in relation to HbA1c and BMI. Two subgroups are studied: a) participants with a diabetes diagnosis and b) participants within a pre-diabetes HbA1c range (i.e., 42–47.9 mmol/mol). We hypothesize there will be associations between neuroimaging estimates and BMI within the thalamic nuclei, hippocampi, and caudate nuclei. These subcortical regions are implicated in neurodegeneration and/or diabetes.3–5 Benefiting from access to the UK Biobank, this study focuses on structural T2* estimates and the fractional amplitude of low frequency BOLD-fMRI signal intensity fluctuations (fALFFs).Methods
We identified 1265 UK Biobank participants that met HbA1c>42 mmol/mol eligibility and reduced the sample size to N=301 after selecting participants that underwent brain MRI. Pre-defined subgroups were n=177 pre-diabetes and n=124 diabetes. Age, risk factors, demographics, and blood biochemistry data were collected (circa: 2012–2013 visit). Participants were scanned on a 3.0 Tesla Siemens Skyra MRI system with a 32-channel head coil (circa: 2014–2018 subsequent visit). MRI pulse sequences were: T1-weighted (T1w), resting state fMRI (rs-fMRI), and susceptibility-weighted images (SWI). T1w: 3D magnetization-prepared rapid acquisition with gradient echo, 1x1x1 mm voxels (scan duration: 5 minutes). Rs-fMRI: 2D gradient‐echo echo‐planar imaging at a TR of 735 ms, TE of 39 ms, and flip angle of 52º, 2.4x2.4x2.4 mm voxels (scan duration: 6 minutes). SWI: to estimate T2* values from TE of 9.42 ms and 20 ms, 0.8x0.8x3 mm voxels (scan duration: 2.5 minutes).6,7Following data extraction, 9 participants were discarded due to missing MELODIC registrations, 18 had unusable data, and 2 were missing T2* estimates. MRI scans were preprocessed in FSL and AFNI using a 1000 Functional Connectome Project script (http://fcon_1000.projects.nitrc.org).8–11 Rs-fMRI data were motion-corrected, and spatially smoothed at a 6-mm full-width at half-maximum Gaussian filter. Despiking and time series linear detrending was implemented, followed by global normalisation of the functional intensities. The fALFF map was generated by using the square root of the signal across the 0.01–0.1 Hz frequency bands, accounting for total temporal frequencies. All fALFF voxels were then z-transformed prior to statistical analyses. Median T2* values were accessed directly from the UK Biobank. A priori regions of interest (hippocampi, thalamic nuclei, and caudate nuclei) were T1w segmented using FMRIB's Integrated Registration and Segmentation Tool (FIRST). Following fALFF construction, the anatomical overlays were visually inspected (1 participant failed QC and was removed). Statistical analyses were conducted in the R (4.0.0 GUI 1.71) software. A Shapiro-Wilk test revealed the fALFF voxel median values were more accurate indicators of resting state fluctuations than mean fALFF activation (P<.05). The two groups were compared using a Mann-Whitney-Wilcoxon test for age, days between visits, and BMI. A Chi-square test compared the sex differences between cohorts. The multiple linear regression models include BMI, age, and sex variables and unadjusted p-values are reported for BMI.
Results
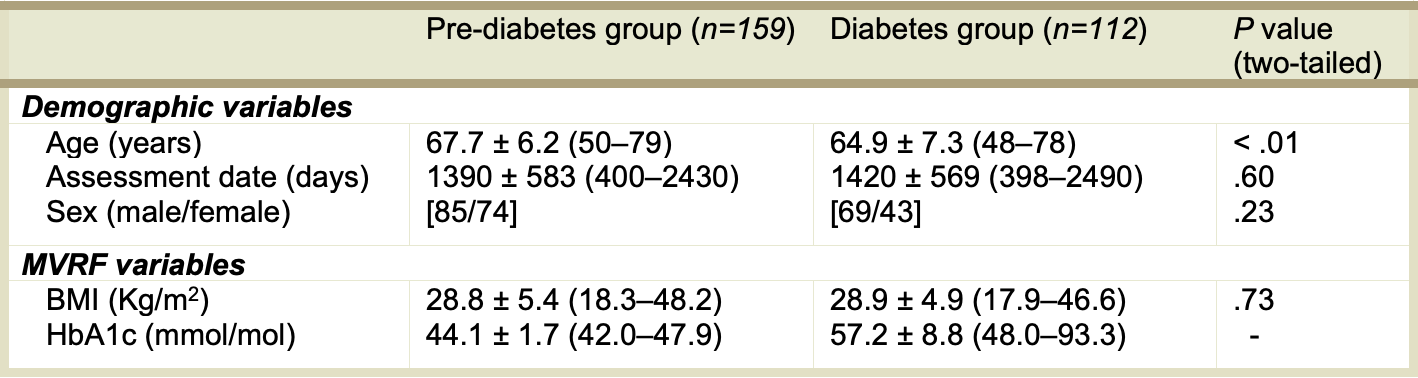
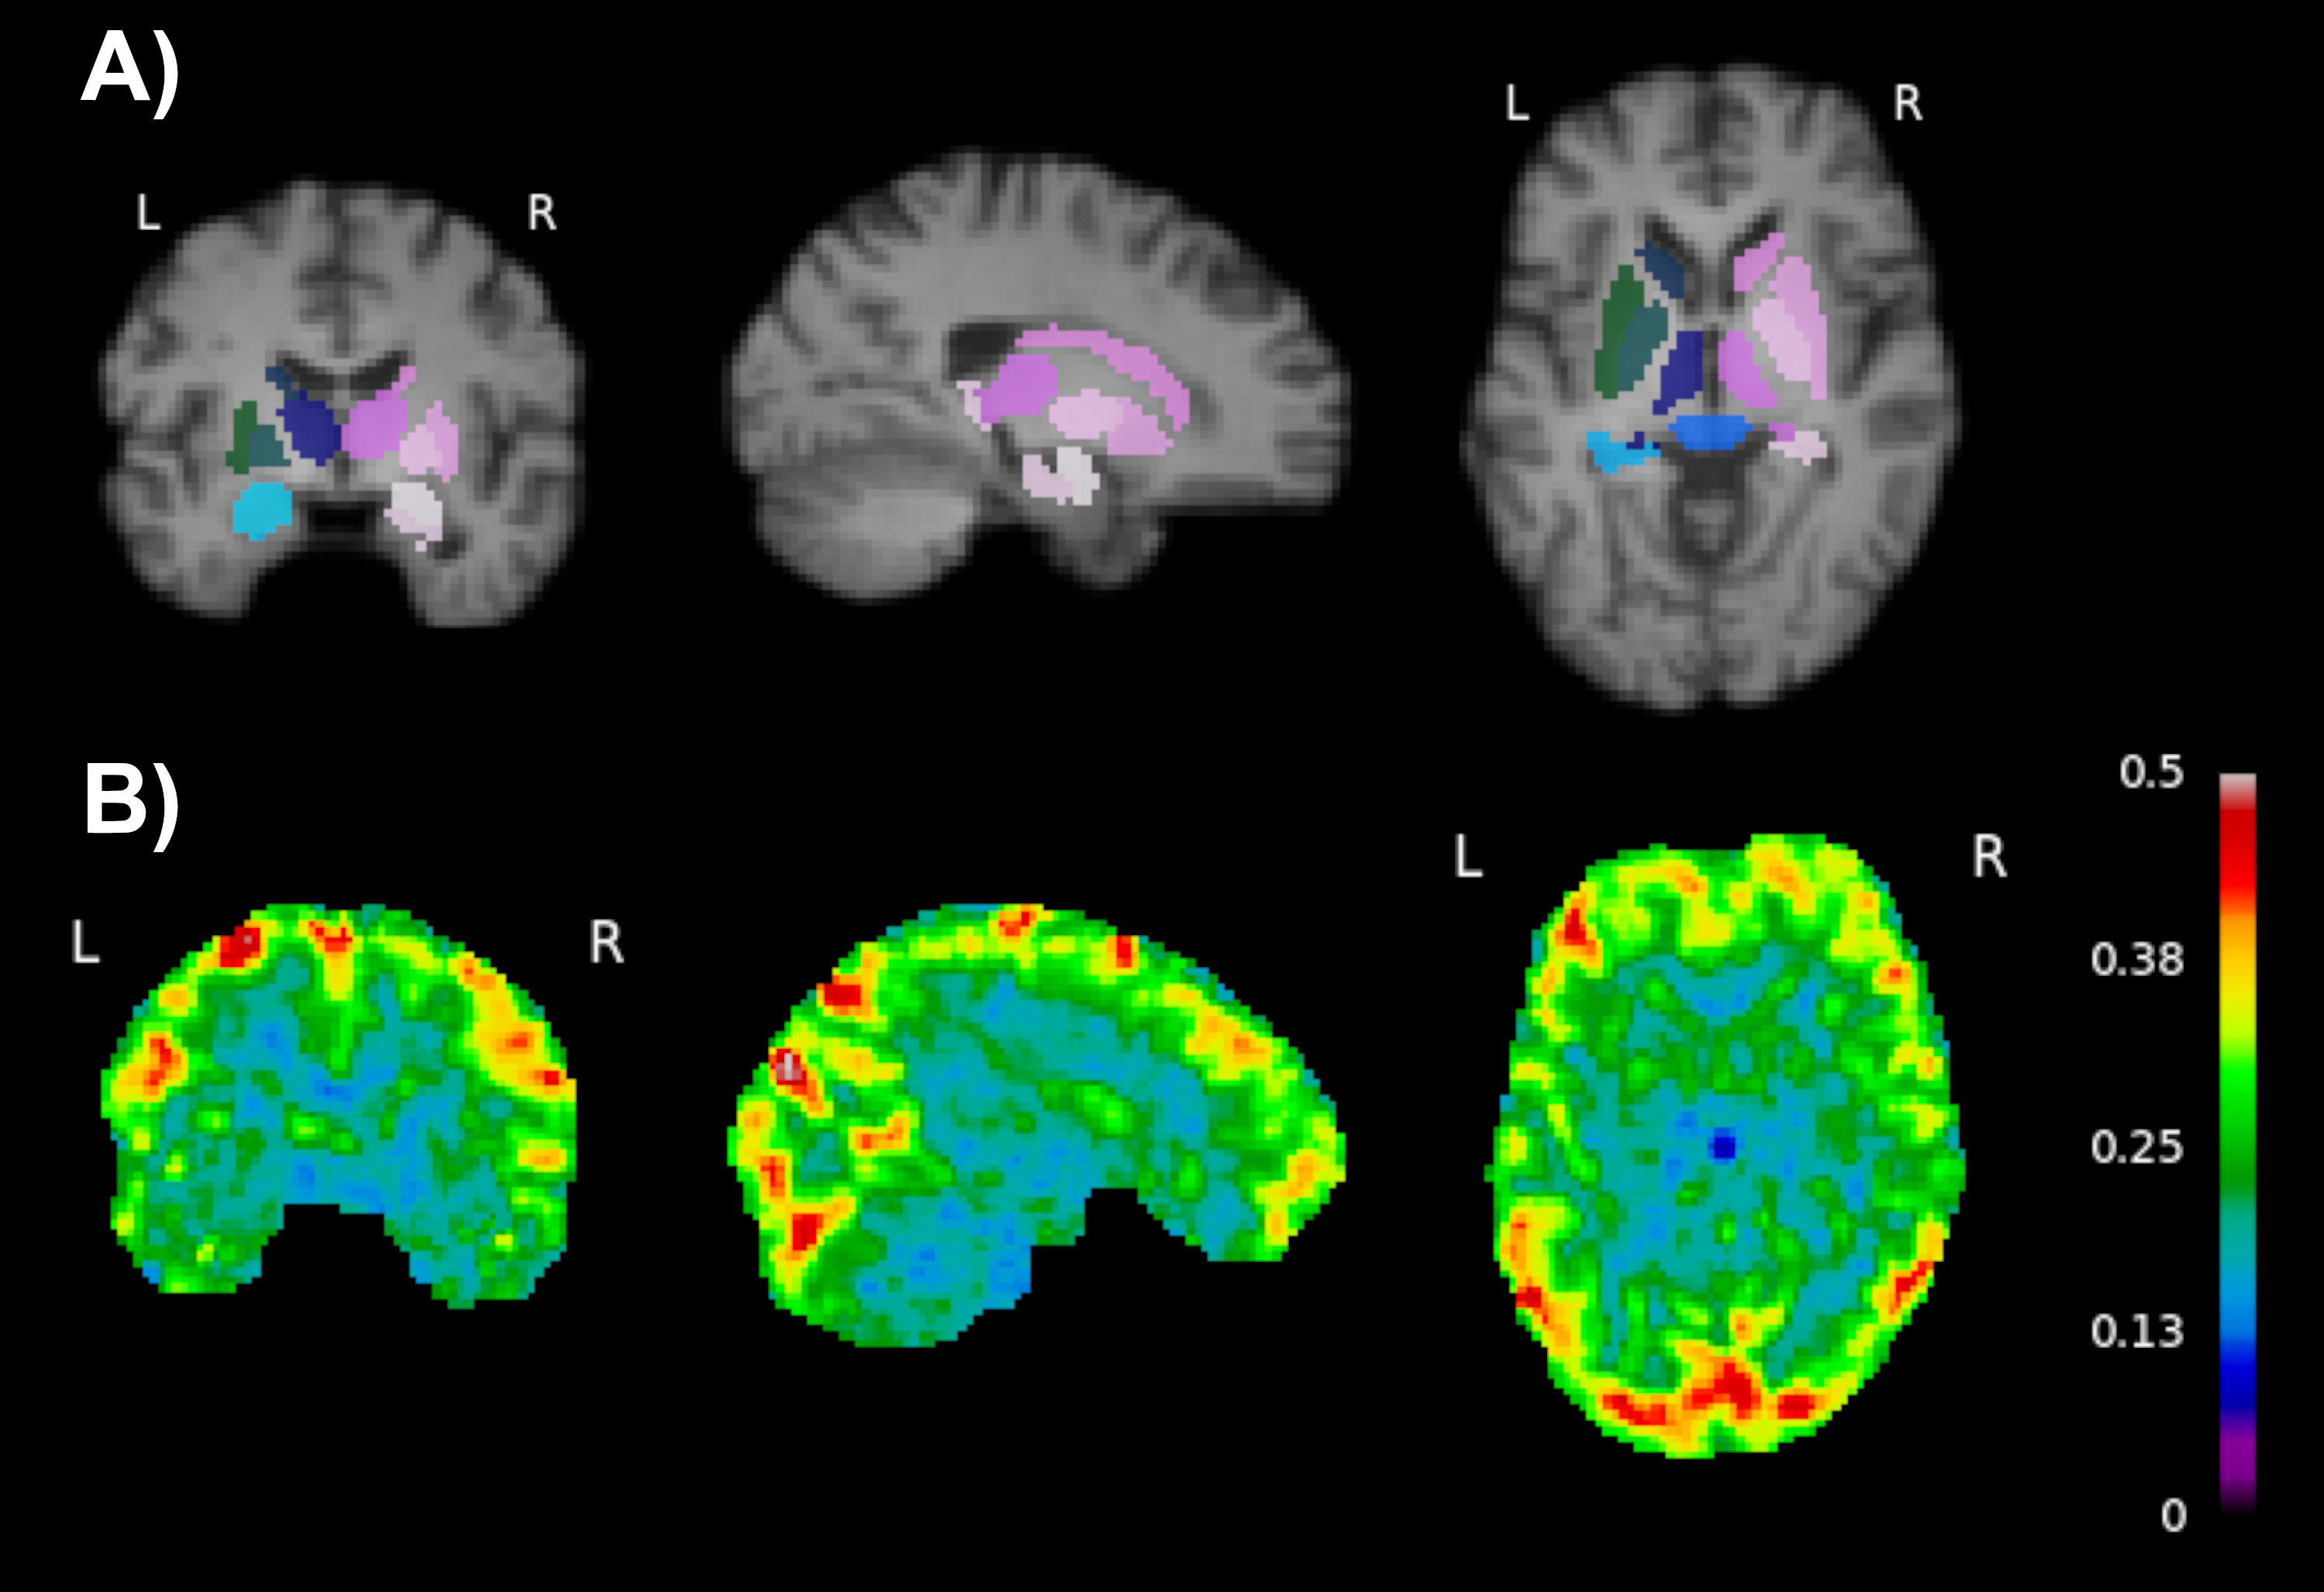
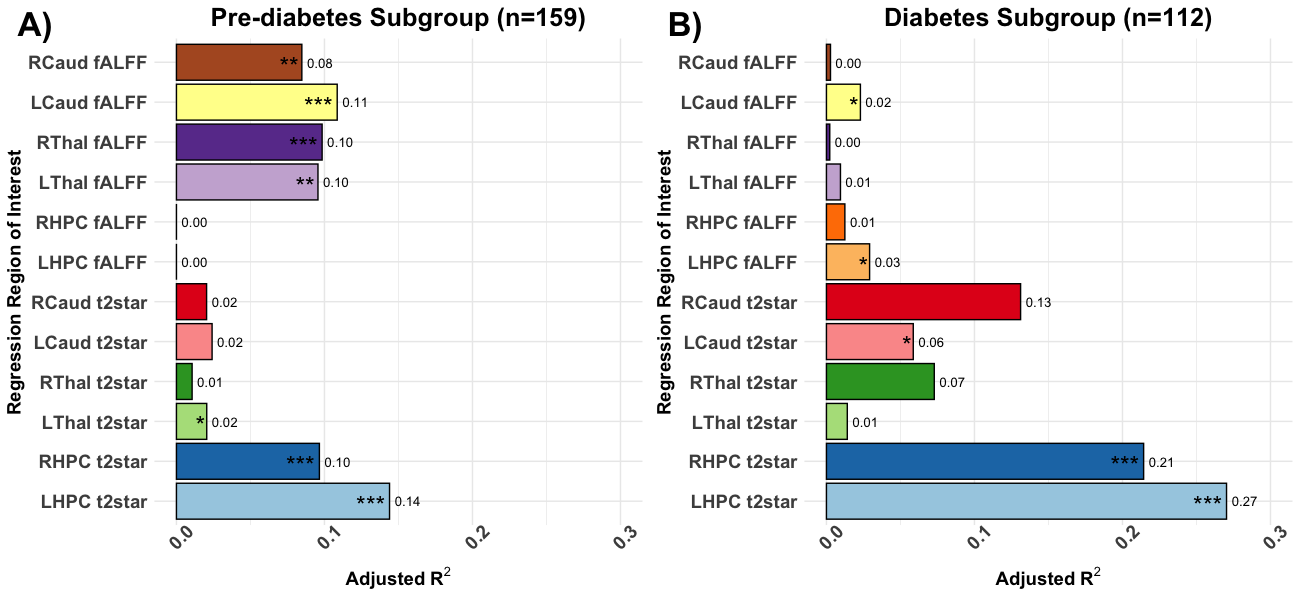
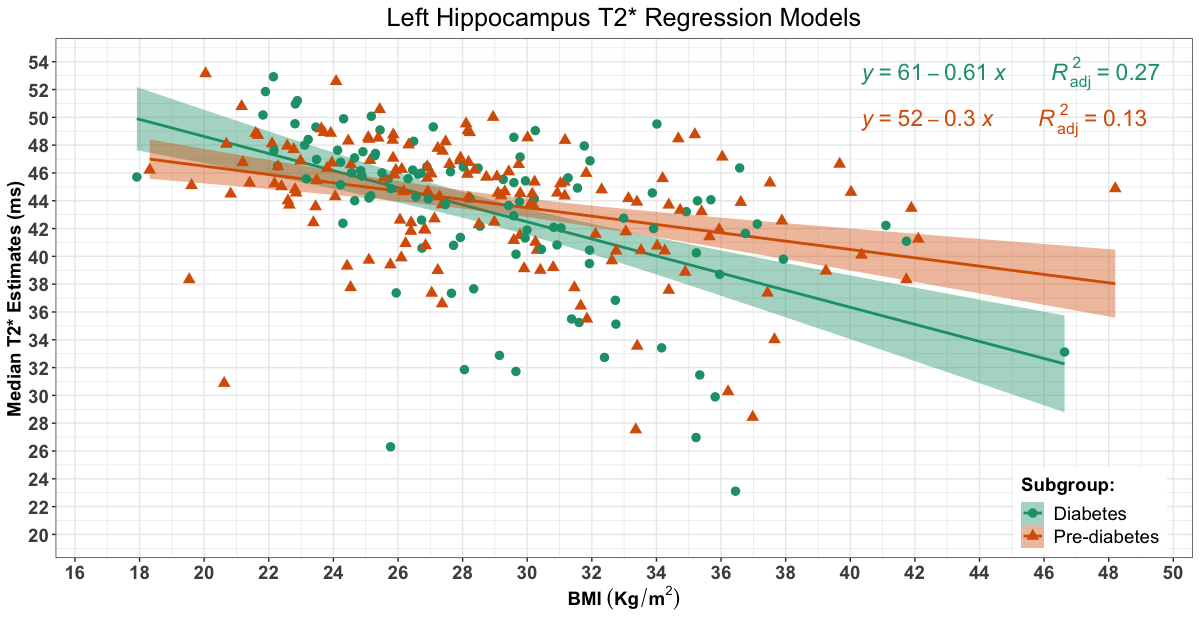
Figure 1 shows participant demographics. Figure 2 shows a brain segmentation and a fALFF map for one participant, with the colour scale denoting the degree of resting state activations. Figure 3 shows the linear regression results. The adjusted R2 values that explained regional T2* ranged from none (1.06%) to modest (27.03%). The adjusted R2 values that explained regional fALFF ranged from 0% to 10.86%. BMI explained significant T2* variance in both hippocampi for pre-diabetes and diabetes participants (P<.001). BMI was associated with left thalamic T2* in participants with pre-diabetes (P=.018) and left caudate T2* in participants with diabetes (P=.035). In pre-diabetes, BMI was associated with left and right thalamic fALFFs (P=.001 and P<.001 respectively) and left and right caudate nuclei fALFFs (P<.001 and P=.003 respectively). In diabetes, BMI was significantly correlated with left hippocampal and left caudate nucleus fALFF activity (P=.041 and P=.045 respectively). Figure 4 shows the median left hippocampal T2* versus BMI. The unadjusted hippocampal T2* regression slopes were downwardly influenced by BMI in both subgroups. The T2* versus BMI slope for the diabetes group was more negatively trended than the pre-diabetes group (-0.61 versus -0.30 respectively).Conclusion
Our findings show that the hippocampus was associated with BMI in both pre-diabetes and diabetes groups. We also show that the caudate nuclei and thalamic nuclei regional fALFF outcome variables were robustly predicted by BMI in participants with pre-diabetes. Between-participant differences in BMI were able to explain resting-state brain activity variance in the pre-diabetes, but not the diabetes, group. Contrastingly, the association between regional T2* and BMI was more consistent across the two groups. In conclusion, metrics extracted from two pulse sequences were helpful in understanding diabetes and brain associations.Acknowledgements
We acknowledge the support provided by Compute Canada.References
1. Marden JR, Mayeda ER, Tchetgen EJT, Kawachi I, Glymour MM. High hemoglobin A1c and diabetes predict memory decline in the health and retirement study. Alzheimer Dis Assoc Disord. 2017;31(1):48-54.
2. Albanese E, Launer LJ, Egger M, et al. Body mass index in midlife and dementia: Systematic review and meta-regression analysis of 589,649 men and women followed in longitudinal studies. Alzheimers Dement (Amst). 2017;8:165-178.
3. Kim AY, Shim JH, Choi HJ, Baek HM. Comparison of volumetric and shape changes of subcortical structures based on 3-dimensional image between obesity and normal-weighted subjects using 3.0 T MRI. J Clin Neurosci. 2020;73:280-287.
4. Nouwen A, Chambers A, Chechlacz M, et al. Microstructural abnormalities in white and gray matter in obese adolescents with and without type 2 diabetes. Neuroimage Clin. 2017;16:43-51.
5. Roberts RO, Knopman DS, Przybelski SA, et al. Association of type 2 diabetes with brain atrophy and cognitive impairment. Neurology. 2014;82(13):1132-1141.
6. Miller KL, Alfaro-Almagro F, Bangerter NK, et al. Multimodal population brain imaging in the UK Biobank prospective epidemiological study. Nat Neurosci. 2016;19(11):1523-1536.
7. Alfaro-Almagro F, Jenkinson M, Bangerter NK, et al. Image processing and quality control for the first 10,000 brain imaging datasets from UK Biobank. Neuroimage. 2018;166:400-424.
8. Mennes M, Biswal B, Castellanos FX, Milham MP. Making data sharing work: The FCP/INDI experience. Neuroimage. 2013;82:683-691.
9. Cox RW. AFNI: software for analysis and visualization of functional magnetic resonance neuroimages. Computers and Biomedical Research. 1996;29(3):162-173.
10. Jenkinson M, Beckmann CF, Behrens TEJ, Woolrich MW, Smith SM. FSL. Neuroimage. 2012;62(2):782-790.
11. Smith SM, Jenkinson M, Woolrich MW, et al. Advances in functional and structural MR image analysis and implementation as FSL. Neuroimage. 2004;23 Suppl 1:S208-219.
Figures