0160
Disrupted Topological Organization of Structural and Functional Brain Connectomes in Type-2 Diabetes Patients1Radiology, Tongji Hospital Tongji Medical College Huazhong University of Science and Technology, Wuhan, China, 2Neurology, Tongji Hospital Tongji Medical College Huazhong University of Science and Technology, Wuhan, China
Synopsis
The T2DM patients with cognitive impairment showed altered global efficiency(Eg), local efficiency(Eloc), clustering-coefficient(Cp), shortest-path-length(Lp) as well as nodal efficiencies in both structural and functional networks, compared to those with normal cognition and healthy controls. Some network metrics were correlated with neuropsychological assessments and disease severity. The disrupted topological organization of structural and functional connectomes (measured by Eg, Eloc, Cp and Lp) were found in T2DM with cognitive impairment, while these topological properties in T2DM with normal cognition were preserved equally to controls. The structural and functional connectomes research shows potential feasibility in characterizing intrinsic alterations of diabetic encephalopathy.
Introduction/Purpose
Patients with Type 2 diabetes mellitus (T2DM) have considerably higher risk of developing cognitive impairment.1 Graph-theory based studies have shown topological organization of both functional and structural brain networks were disrupted in patients with T2DM.2,3 However, it is not clear that what the differences of the network between normal cognition and impaired cognition are, and how the network changes at the functional level caused by the structural variances. Our study aims to explore the topological organization alterations of both the structural and functional connectomes in T2DM patients with and without cognitive impairment as well as normal controls, by combining diffusion tensor imaging (DTI) and resting-state functional MRI (rs-fMRI) with graph-theory based analysis. It also aims to characterize the relationships between the image parameters and clinical measurements.Materials and Methods
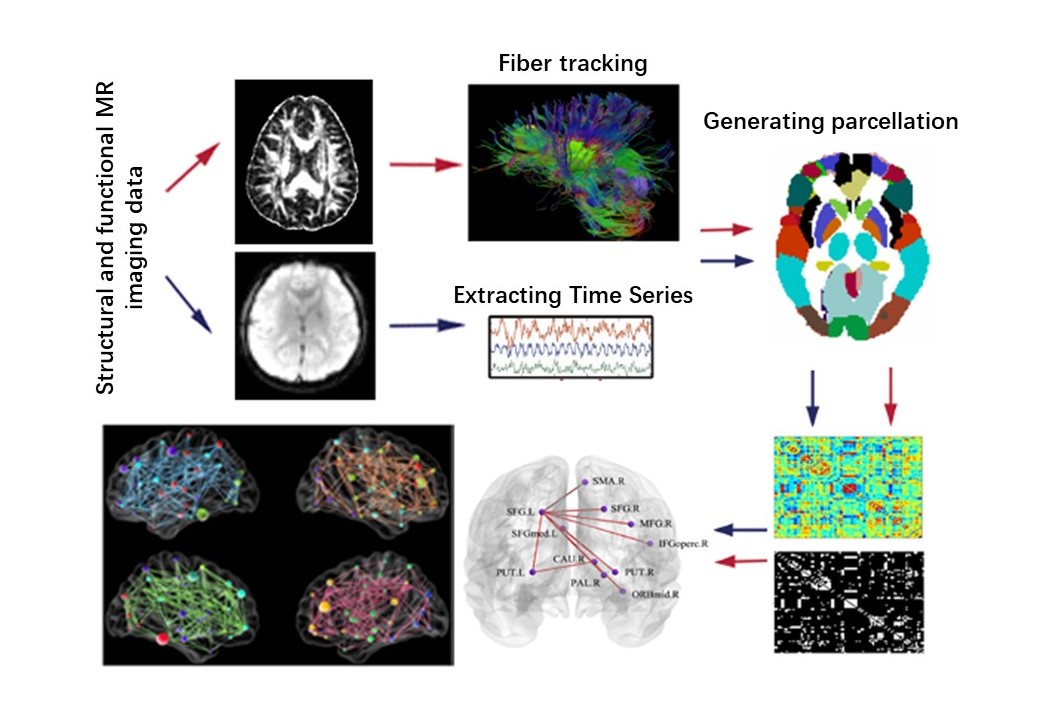
Patients Forty-four T2DM patients (based on diagnostic criteria of American Diabetes Association) were recruited and divided into two groups, one with mild cognitive impairment (DM-MCI, n=22, 62.3±5.6years) and the other with normal cognition (DM-NC, n=22, 59.5±6.4years) based on clinic symptoms and neuropsychological tests (Montreal Cognitive Assessment, Mini-Mental State Examination[MMSE], Trail Making Tests, Auditory Verbal Learning Test, Hachinski test, and Activity of Daily Living test. These tests were performed at 2-week intervals in 10 patients, and the intra-rater reliability was >90%). Twenty-five healthy controls (HCs, 50-70 years) were also enrolled in the study for comparison. Measurements of blood biochemistry, including plasma fasting/postprandial glucose and glycated hemoglobin A1c (HbA1c) levels, were recorded. Imaging On a 3T MRI scanner (Discovery MR750, GE Healthcare, Waukesha, Wisconsin, USA), axial DTI images were obtained using a single-shot diffusion-weighted echo planar imaging sequence (TR/TE=8500/66.3ms, FOV=25.6×25.6cm2, slice thickness=2mm, 70 slices, 64 diffusion-weighted directions, b-value=1000 s/mm2). Axial functional images were obtained using a gradient-echo echo planar imaging sequence (TR/TE=2000/35.0ms, FOV=24.0×24.0cm2, slice thickness=4mm without spacing, bandwidth=250kHz, and flip angle=90°). Data processing Fractional anisotropy (FA) were calculated after eddy current and motion artifact corrections of diffusion tensor images were post-processed with FSL (fsl.fmrib.ox.ac.uk/fsl/fslwiki/FDT). The rs-fMRI was analyzed with DPARSF (www.restfmri.net) by regressing out nuisance covariates after preprocessing included motion correction, brain extraction, spatial smoothing, and band-pass filtering (0.01–0.1 Hz). Network construction The 90 regions of interest (ROIs) from Automated Anatomical Labeling (AAL) template were defined as network nodes.4 Diffusion MRI tractography was performed using the Diffusion Toolkit software (http://www.trackvis.org/dtk/). All tracts in the DTI dataset were computed by seeding each voxel with the threshold of FA>0.2 and turned an angle<45°. All fiber pathways between the 90 ROIs in the brain were constructed using deterministic tractography method. The mean rs-fMRI time series were calculated by averaging over the time-series of all voxels contained within each ROI. To measure the inter-regional resting-state functional connectivity (RSFC), we calculated the Pearson correlation coefficient of the mean time-series between any pair of ROIs and estimated their corresponding significance levels. Network analysis Graph measurements, including global efficiency (Eg), local efficiency (Eloc), clustering coefficient (Cp), shortest path length (Lp), small-word parameters (λ, γ, σ), and nodal efficiency were analyzed and visualized using GRETNA and BrainNet Viewer software.5, 6 For global parameters, a 2-tailed Student’s t-test was applied with a statistical significance set at p<0.05; for nodal parameters, a false-discovery rate (FDR) correction was applied for multiple comparisons. The flowchart of structural network construction was showed in Fig.1.Results
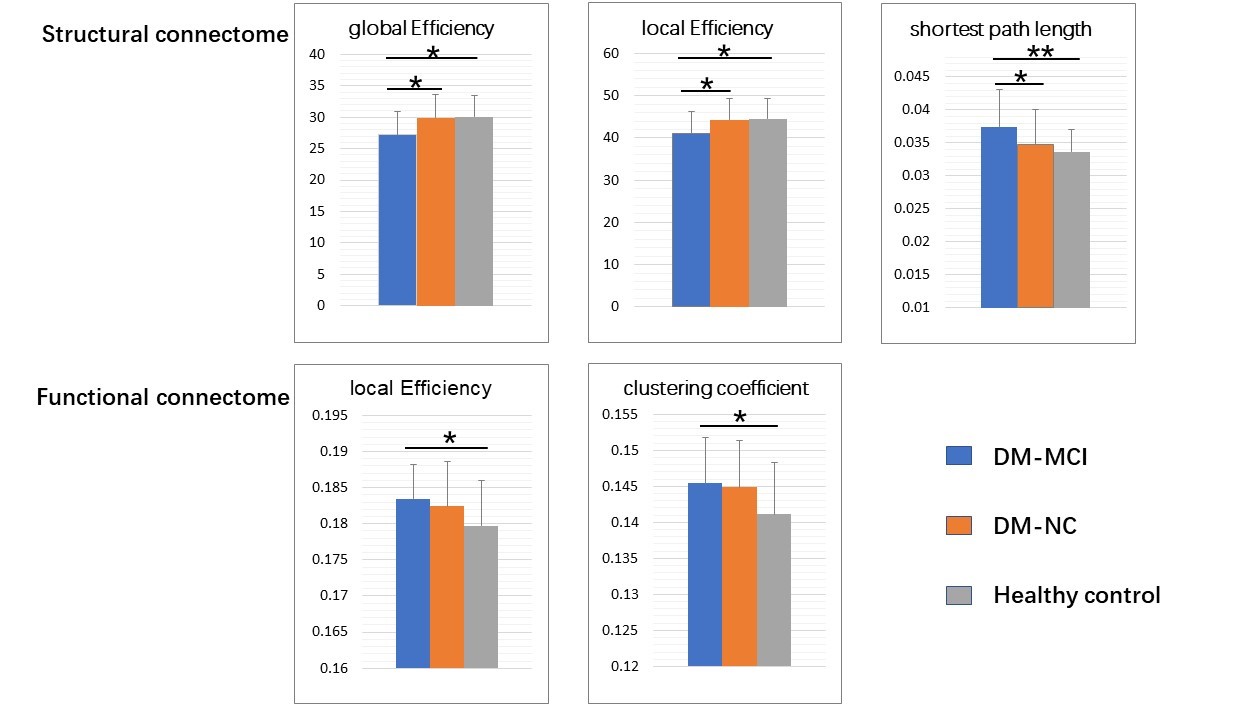
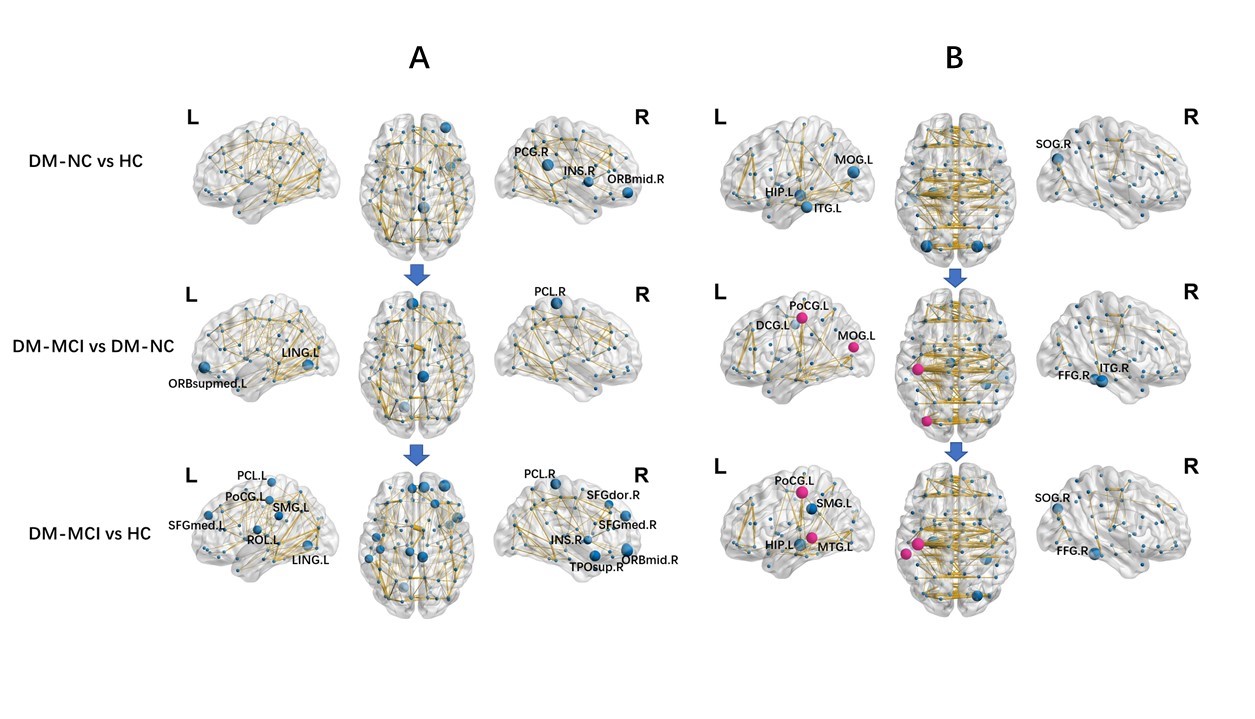
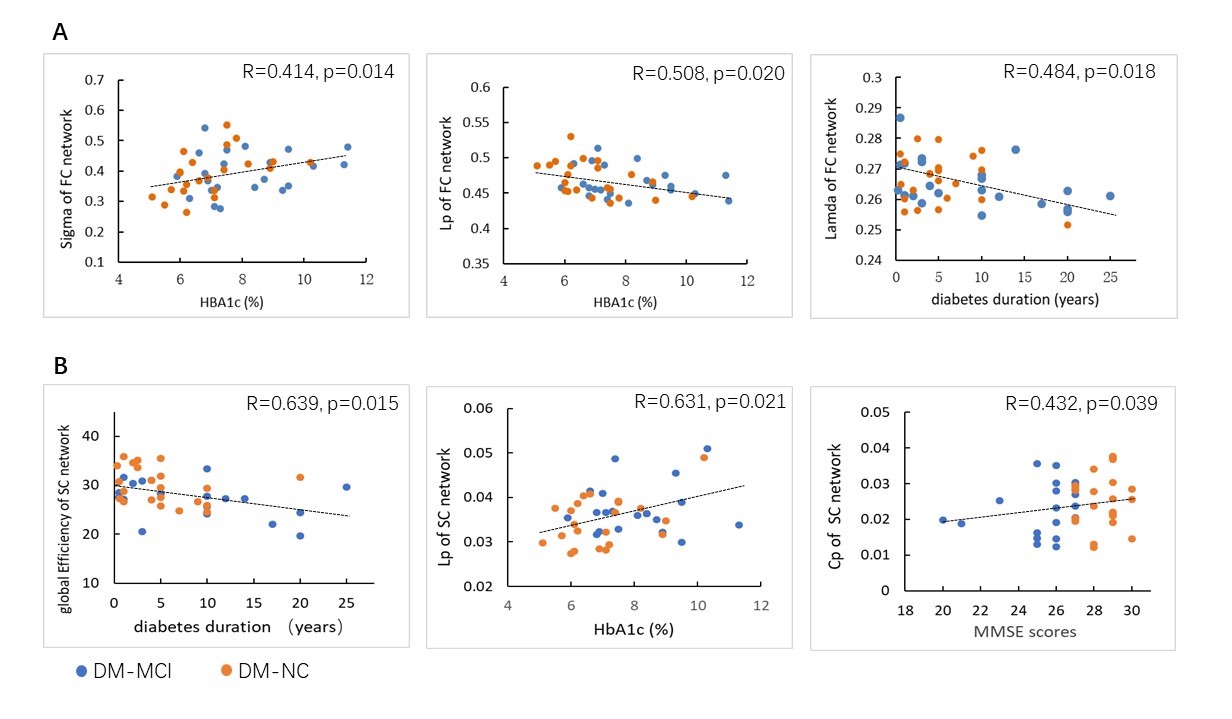
The DM-MCI group had higher level of HbA1c (8.26±1.60%) and longer duration (8.97±7.48 years) than the DM-NC group (7.16±1.36%, p=0.014 and 5.69±4.57 years, p=0.049, accordingly). Global network properties: No significant between-group difference of economical small-world organization for all groups (σ=2.73±0.20, 2.68±0.18, and 2.71±0.15, for DM-MCI, DM-NC and HC, respectively) was detected. For the structural connectome (SC), the DM-MCI group exhibited significant decreased Eg (p=0.025) and Eloc (p=0.041) as well as increased Lp (p=0.003) values, compared with the controls and DM-NC group. For the functional connectome (FC), however, the DM-MCI group exhibited significant increased Eloc (p=0.046) and Cp (p=0.033) values. No significant difference of Eg, Eloc, Cp, or Lp for both SC and FC networks was found in the DM-NC group than the controls (Fig.2). Regional efficiency: Significant group differences in reduced nodal efficiency (p<0.05, corrected) were found in 14 regions for the SC network while decreased nodal efficiency were found in 10 regions for the FC network. Meanwhile, increased nodal efficiency were found in 6 regions of the DM-MCI group compared to the controls and DM-NC group (Fig.3). Altered metrics in both SC and FC network were correlated with the HBA1c level, neuropsychological assessment and disease duration in all T2DM patients (Fig.4).Discussion and Conclusions
The disrupted topological organization of structural and functional connectomes (measured by Eg, Eloc, Cp and Lp) were found in T2DM-MCI, while these topological properties in T2DM-NC were preserved equally to controls. Moreover, decreased nodal efficiencies of both SC and FC networks were detected in the DM-MCI group compared to the DM-NC group and controls (network changes appear more severe in DM-MCI compared to DM-NC). In the functional connectome, some regions (the left PoCG, MTG and MOG) also exhibited increased nodal efficiency in DM-MCI group, which may reflect a compensation in those areas after long-term weakened neural activities. The structural and functional topological properties research can contribute to understand the intrinsic alterations of diabetic encephalopathy, including cognitive impairment.Acknowledgements
Funding: This project was supported by the National Natural Science Funds of China (Grants No. 81601480 and 81471230).References
1. McCrimmon RJ, Ryan CM, Frier BM. Diabetes and cognitive dysfunction. Lancet 2012; 379: 2291–9.
2. van Bussel FC, Backes WH, van Veenendaal TM, et al. Functional Brain Networks Are Altered in Type 2 Diabetes and Prediabetes: Signs for Compensation of Cognitive Decrements? The Maastricht Study. Diabetes 2016;65:2404–13.
3. Zhang J, Liu Z, Li Z, et al. Disrupted white matter network and cognitive decline in type 2 diabetes patients. J Alzheimers Dis. 2016; 53: 185–95.
4 Tzourio-Mazoyer N, Landeau B, Papathanassiou D, et al. Automated anatomical labeling of activations in SPM using a macroscopic anatomical parcellation of the MNI MRI single-subject brain. Neuroimage. 2002;15(1):273-89.
5. Wang J, Wang X, Xia M, et al. GRETNA: a graph theoretical network analysis toolbox for imaging connectomics. Frontiers in human neuroscience, 9, 386.
6. Xia M, Wang J, He Y. BrainNet Viewer: A Network Visualization Tool for Human Brain Connectomics. PLoS ONE 8: e68910.
Figures