0158
Resting-State fMRI Frequency Change During Brain Aging1Rotman Research Institute, Baycrest Health Sciences, Toronto, ON, Canada, 2Department of Medical Biophysics, University of Toronto, Toronto, ON, Canada
Synopsis
Frequency features of the resting-state functional magnetic resonance imaging (rs-fMRI) signal can be crucial metrics that reveal patterns of brain aging. However, how the frequency shift during brain aging is still unclear. In this study, we examined the peak frequency and standard deviation of the rs-fMRI signal in healthy aging adults, divided into (0-0.1 Hz) and (0.1-0.3 Hz) bands. We found that in older adults, rs-fMRI fluctuation amplitude is lower but fluctuation frequency is higher in older adults, and these effects depend on the fMRI frequency range.
Introduction
Determining the age-effect on resting-state fMRI could help us better understand how neurovascular interactions change during brain aging. Previous research based on empirical mode decomposition found rs-fMRI frequency increases during brain aging in a range of ~ 0.045 to 0.1 Hz. [1] However, it is unclear if such effects can be observed with more accessible Fourier methods. Moreover, although the age effect on fluctuation amplitude of rs-fMRI is well defined, the differential effect for the 0.01-0.1Hz band (dominated by neural activity) and 0.1-0.3Hz band (dominated by respiratory noise) is unknown. In this study, we aim to demonstrate how the peak frequency and amplitude of the rs-fMRI signal jointly vary with aging.Method
Subjects: The “Leipzig Study for Mind-Body-Emotion Interaction” (LEMON, publicly available at http://fcon_1000.projects.nitrc.org/indi/retro/MPI_LEMON.html) [2] dataset comprises 227 healthy subjects in two age groups. The older group is aged between 59-77 years old (N=74, 37 females) while the younger group between 20-35 years old (N=153, 45 females). No participant reported a history of cardiovascular disease, psychiatric disease, neurological disorders, malignant disease, or medication/drug use that could affect the study.Image Acquisition: Structural T1-weighted image was acquired using an MP2RAGE sequence with parameters: TR=5000 ms, TE=2.921 ms, TI1=700ms, TI2 =2500ms, FA1=4 deg, FA2=5 deg, bandwidth=240 Hz/pixel, FOV=256 mm, voxel size 1 mm isotropic, 176 slice encodes. rs-fMRI BOLD images were acquired with T2*-weighted gradient-echo EPI sequence with parameters, TR=1400 ms, TE=30 ms, flip angle=69 deg, bandwidth=1776 Hz/pixel, partial Fourier ⅞, voxel size 2.3 mm isotropic, 64 slices. Participants were informed to keep their eyes open while focusing on a low-contrast cross during the scan.
Preprocessing: The fMRI preprocessing follow the procedure: (I) 3D motion correction (II) slice-timing correction, (III) brain extraction, (IV) rigid body coregistration of functional data to the individual T1 image, (V) white-matter and CSF regression, (VI) bandpass filtering to obtain band 1 ( 0.01-0.1 Hz) and band 2 (0.1-0.3 Hz), (VII) special normalization to MNI152 (Montreal Neurological Institute) standard space with spatial resolution 2mm isotropic, (VIII) the data were spatially smoothed with 6 mm full-width half-maximum Gaussian kernel.
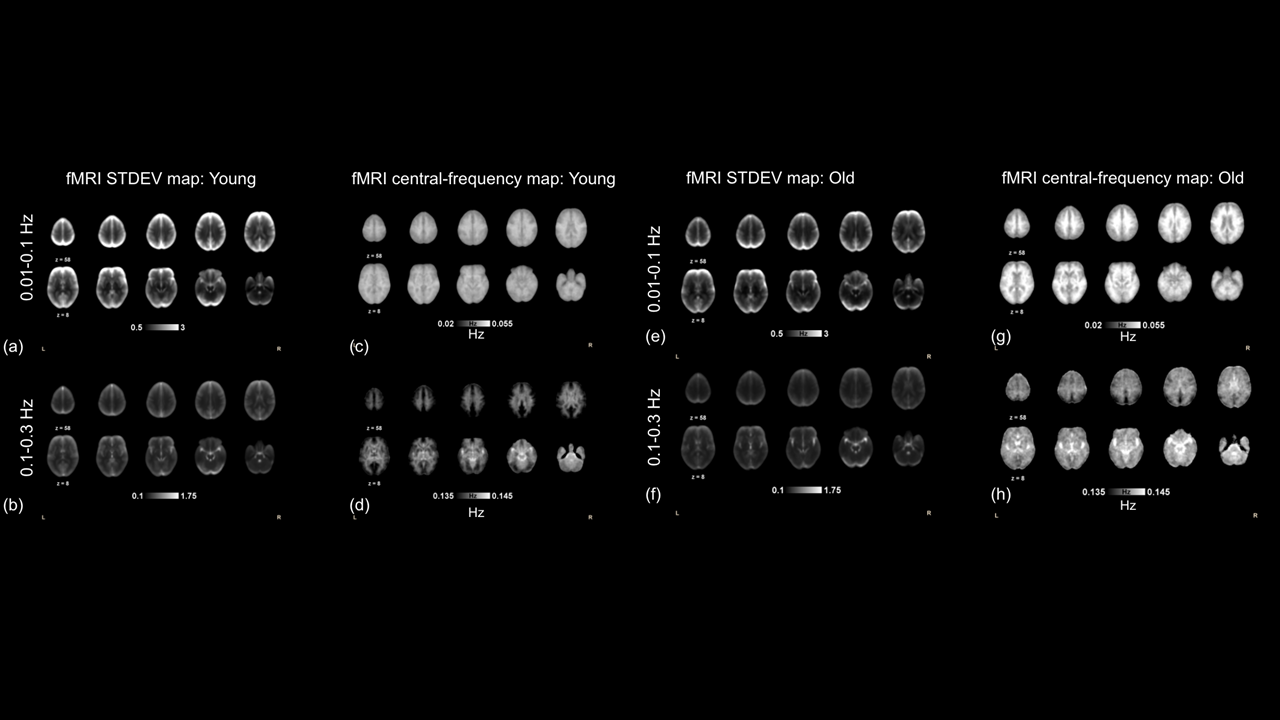
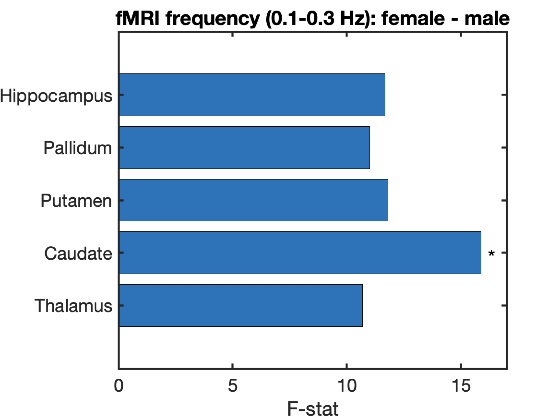
Data analysis: The standard deviation and peak frequency (central of mass approach, Eq. 1) were calculated voxel-based, and the resultant maps were tested for effects of age and sex with the randomized design generalized linear model implemented in FSL [3] with a significance threshold 0.05, corrected for multiple comparisons using randomise. Subcortical region standard deviation and peak frequency values were averaged based on Harvard-Oxford atlas [4] before becoming input for a non-parametric analyses of covariance (ANCOVAs, type III) and Tukey's HSD post-hoc comparisons to better investigate age effects in these ROIs.
$${frequency\;at\;centre\;of\;mass} = \frac{\sum{i=0}^m {P_i f_i}}{\sum{i=0}^m {P_i}}\,(Eq. 1) $$
Where P is power and f is frequency
Results
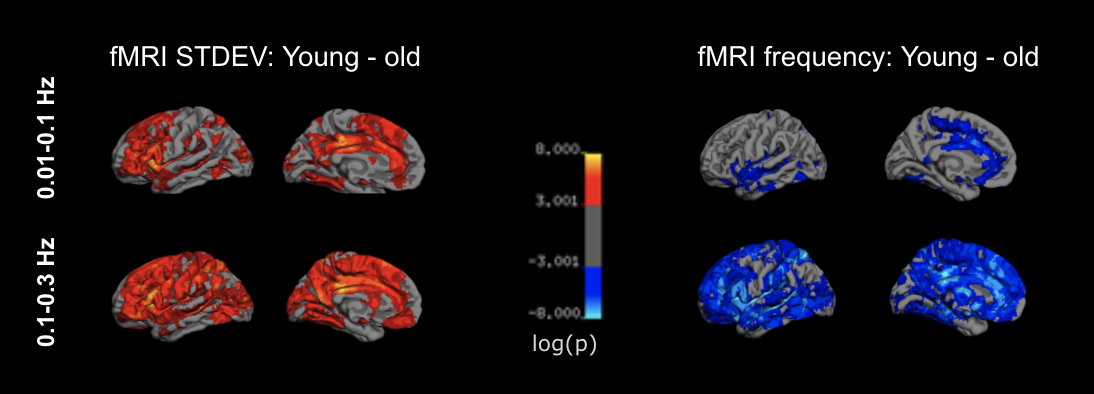
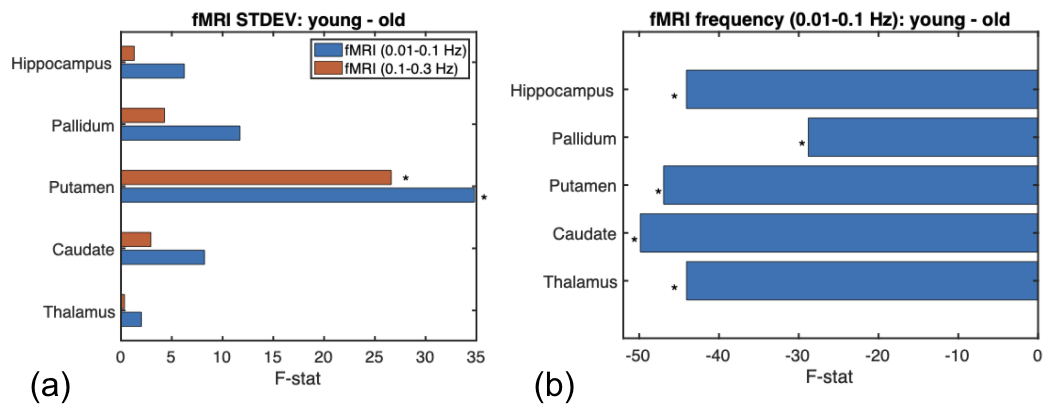
The peak frequency for the 0.01 - 0.1 Hz BOLD signal significantly increases in the insula, superior frontal gyrus, and superior temporal cortex for the cortical region, while the peak frequency for 0.1 Hz to 0.3Hz BOLD signal significantly increases in most of the cortical region (Fig. 2). Regarding the subcortical regions, the 0.1-0.3 Hz component of the BOLD signal shows older participants have higher peak frequency in the thalamus, caudate, putamen, pallidum, and hippocampus than younger participants (Fig. 3).Discussion
Our results are generally consistent with previous research done by Yangs et al [1]. However, we also found significant and widespread aging-related increases in the frequency of the 0.1-0.3 Hz band, which is typically associated with an increased contribution from physiological processes. In the 0.01-0.1 Hz band, the low-frequency contribution can result from the contributions of arterial carbon dioxide and heart-rate variability (HRV). Although in opposite directions, the most significant rs-fMRI amplitude and frequency age effects (decrease and increase, respectively) converge in the cingulate cortex. Combined with the observation that overall fMRI power decreases with age in both frequency bands, our results suggest that the apparent increase in rs-fMRI frequency with age is due to a reduced contribution of low-frequency fluctuations.Acknowledgements
The authors acknowledge funding support from the Canadian Institutes of Health Research (CIHR) and the Natural Sciences andEngineering Research Council of Canada (NSERC).References
[1] Yang, A.C., Tsai, S.-J., Lin, C.-P., Peng, C.-K., Huang, N.E., 2018. Frequency and amplitude modulation of resting-state fMRI signals and their functional relevance in normal aging. Neurobiol. Aging 70, 59–69.
[2] Babayan, A., Erbey, M., Kumral, D., Reinelt, J.D., Reiter, A.M.F., Röbbig, J., Schaare, H.L., Uhlig, M., Anwander, A., Bazin, P.-L., Horstmann, A., Lampe, L., Nikulin, V.V., Okon-Singer, H., Preusser, S., Pampel, A., Rohr, C.S., Sacher, J., Thöne-Otto, A., Trapp, S., Nierhaus, T., Altmann, D., Arelin, K., Blöchl, M., Bongartz, E., Breig, P., Cesnaite, E., Chen, S., Cozatl, R., Czerwonatis, S., Dambrauskaite, G., Dreyer, M., Enders, J., Engelhardt, M., Fischer, M.M., Forschack, N., Golchert, J., Golz, L., Guran, C.A., Hedrich, S., Hentschel, N., Hoffmann, D.I., Huntenburg, J.M., Jost, R., Kosatschek, A., Kunzendorf, S., Lammers, H., Lauckner, M.E., Mahjoory, K., Kanaan, A.S., Mendes, N., Menger, R., Morino, E., Näthe, K., Neubauer, J., Noyan, H., Oligschläger, S., Panczyszyn-Trzewik, P., Poehlchen, D., Putzke, N., Roski, S., Schaller, M.-C., Schieferbein, A., Schlaak, B., Schmidt, R., Gorgolewski, K.J., Schmidt, H.M., Schrimpf, A., Stasch, S., Voss, M., Wiedemann, A., Margulies, D.S., Gaebler, M., Villringer, A., 2019. A mind-brain-body dataset of MRI, EEG, cognition, emotion, and peripheral physiology in young and old adults. Sci Data 6, 180308.
[3] Jenkinson, M., Beckmann, C.F., Behrens, T.E.J., Woolrich, M.W., Smith, S.M., 2012. FSL.
[4] Desikan, R.S., Ségonne, F., Fischl, B., Quinn, B.T., Dickerson, B.C., Blacker, D., Buckner, R.L., Dale, A.M., Maguire, R.P., Hyman, B.T., Albert, M.S., Killiany, R.J., 2006. An automated labeling system for subdividing the human cerebral cortex on MRI scans into gyral based regions of interest. Neuroimage 31, 968–980.
Figures