0153
Formalism of the T1Ρ* relaxation pathway: Correction of quantification errors for rapid myocardial T1Ρ mapping in mice1Department of Internal Medicine I, University Hospital Würzburg, Würzburg, Germany, 2Experimental Physics 5, University of Würzburg, Würzburg, Germany, 3Comprehensive Heart Failure Center (CHFC), University Hospital Würzburg, Würzburg, Germany
Synopsis
The rapid quantification of T1ρ using fast gradient echo sequences for data acquisition leads to a contamination of the T1ρ relaxation pathway. Analogous to the T1* relaxation occurring in snapshot flash sequences, a relaxation pathway T1ρ* is effectively observed. As a consequence, quantification errors can arise depending on T1 and the sequence parameters used for imaging. In this work we introduce a formalism for the description of T1ρ* and present a method that can be applied for the subsequent correction of study results in the field of cardiac MRI.
Introduction
In the last decade, T1ρ quantification has become a popular method for improved tissue characterization. As numerous studies have shown, T1ρ contrast benefits from a high sensitivity to low-frequency processes due to its special relaxation mechanism [1]. Furthermore, T1ρ offers the possibility of dispersion measurements and does not require the administration of contrast agents. For this reason, T1ρ has already been discussed as a native fibrosis index in the field of cardiac MRI [2].A fundamental problem of T1ρ based imaging arises from the spin-lock preparation, which ideally has to be done prior to each readout. As a result, a rapid T1ρ quantification is challenging, which leads to limitations, especially in in vivo experiments. In order to reduce measurement time, only a few preparations are usually carried out and fast gradient echo sequences are used for data acquisition [3,4]. However, this procedure affects the T1ρ relaxation pathway, which, depending on the application, can lead to large quantification errors.
In this work, we present a formalism to describe a T1ρ* relaxation pathway and thus enable the correction of the T1ρ quantification. The method was validated in phantom experiments and used for myocardial T1ρ mapping in mice.
Theory
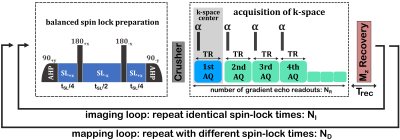
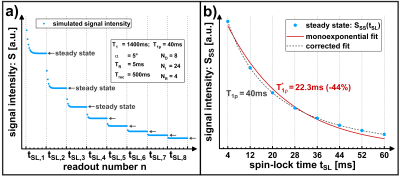
Figure 1 shows a schematic of a fast T1ρ mapping sequence using NR gradient echoes after each spin-lock preparation. The T1ρ weighting is primarily contained in the first readout, which is used for the acquisition of the k-space center (1st AQ). It can be shown by Bloch simulations that the signal of the 1st AQs does not describe a pure monoexponential function (Figure 2):$$S_{1st} \neq S_0 \cdot exp \left[ -\frac{t_{SL}}{T_{1\rho}} \right] \,\, \textbf{Equation 1} $$
Instead, the signal reaches a steady state during the imaging loop. We were able to work out a mathematical description for the final plateau value SSS, which serves as a novel signal equation in this work:
$$ S_{SS}(t_{SL},T_{1\rho}, T_1) = \lim_{N_I\to\infty} \left[S_{1st}\right] = S_0 \cdot \frac {exp\left[-\frac{t_{SL}}{T_{1\rho}}\right]} {1 - cos[\alpha]^{NR} \cdot exp\left[-\frac{T_{rec}+N_R\,TR}{T_1}\right] \cdot exp\left[-\frac{t_{SL}}{T_{1\rho}}\right]} \,\, \textbf{Equation 2} $$
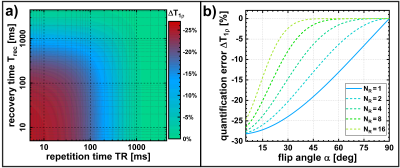
The expression shows that the relaxation pathway, which we refer to as T1ρ*, is influenced by T1 and the sequence parameters (recovery time Trec, repetition time TR, number of gradient echoes NR, flip angle α). If a simple monoexponential function is used to fit T1ρ, significant quantification errors occur and systematically underestimated values T1ρ* will be obtained (Figure 3).
Methods
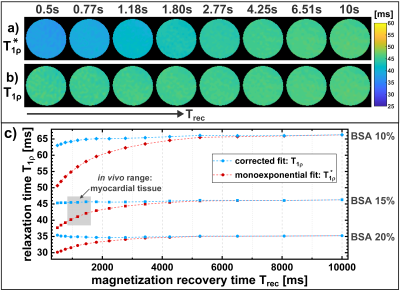
All measurements were performed on a 7.0T small animal imaging system (Bruker BioSpec 70/30, BioSpin MRI GmbH, Ettlingen, Germany). T1ρ preparation was done by balanced-spin-locking [5]. Acquisition of k-space was optimized for fast myocardial imaging using a spoiled gradient echo readout.Phantom experiments (Bovine Serum Albumin, three concentrations) were carried out to validate the correction using Equation 2. T1ρ maps were acquired using 15 different magnetization recovery times (Trec=0.5…10s, logarithmically spaced). The remaining sequence parameters were kept constant (TE=2ms, TR=5ms, NR=4, α=35°).
For the in vivo measurements, we used a Bloch simulation-optimized radial sampling pattern and a KWIC-filtered view sharing method [4]. One SL preparation was performed in one heart beat per respiratory cycle. The recovery time Trec was set by the breathing cycle of the mice and thus randomly varied. Overall, 10 T1ρ maps were measured in the range Trec=1054…1752ms.
For both phantom and in vivo measurements T1ρ* maps (monoexponential fit Eq.1) and T1ρ maps (corrected fit Eq.2) were calculated. The T1 values required for the correction were determined using an inversion-recovery-snapshot-flash [6].
Results
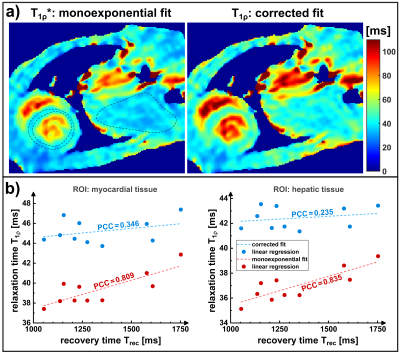
The results of the phantom experiments are shown in Figure 4. There is a clear raise in T1ρ* (monoexponential fit) with Trec, which finally leads to the approximately true T1ρ value at large Trec. The corrected T1ρ fit provides significantly more accurate results for small Trec. The mean quantification error could be reduced from -7.4% to -1.3%.The results of the in vivo measurements (Figure 5) indicate a strong impact of varying breathing cycles on the quantification results. We observed a correlation between T1ρ* and Trec both in myocardial (Pearson-Correlation-Coefficient PCC=0.81) and hepatic (PCC=0.84) tissue. The corrected fit systematically yielded larger T1ρ values, which showed less correlation (myocardial PCC=0.35, hepatic PCC=0.24) with Trec.Discussion
In this work a mathematical description of T1ρ* was presented, taking into account the influence of fast gradient echo sequences on the T1ρ relaxation pathway. A correction for T1ρ quantification was developed and successfully applied in phantom and in vivo measurements. Thus we were able to reduce the influence of the respiratory cycle rate in myocardial T1ρ mapping, which makes the results of different measurements and studies more comparable. A disadvantage of our new method is that a T1 quantification is required for the correction. Based on the current results, we investigate whether the developed formalism might enable the simultaneous measurement of T1 and T1ρ.Conclusion
The description of the T1ρ* relaxation pathway enables the subsequent correction of T1ρ mapping for measurements that were based on fast gradient echo sequences. Since T1ρ* is sensitive to T1 and the sequence design, simultaneous relaxation time measurements using a fingerprinting technique might be possible.Acknowledgements
This work was supported by the Federal Ministry for Education and Research of the Federal Republic of Germany (BMBF 01EO1504, MO6).References
[1] Wáng YX, et al. T1ρ magnetic resonance: basic physics principles and applications in knee and intervertebral disc imaging. Quant Imaging Med Surg. 2015 Dec;5(6):858-85. https://doi.org/10.3978/j.issn.2223-4292.2015.12.06.
[2] Yin Q, et al. A non-contrast CMR index for assessing myocardial fibrosis. Magn Reson Imaging. 2017 Oct;42:69-73. https://doi.org/10.1016/j.mri.2017.04.012.
[3] Musthafa HS, et al. Longitudinal rotating frame relaxation time measurements in infarcted mouse myocardium in vivo. Magn Reson Med. 2013 May;69(5):1389-95. https://doi.org/10.1002/mrm.24382.
[4] Gram, et al. Fast T1rho mapping in mice using an optimized Bloch simulation based radial sampling pattern. ISMRM Annual Meeting 2020. Sydney. #2054
[5] Gram, et al. Balanced spin‐lock preparation for B1‐insensitive and B0‐insensitive quantification of the rotating frame relaxation time T1ρ. Magn Reson Med. Early View. https://doi.org/10.1002/mrm.28585
[6] Gutjahr FT, et al. Quantification of perfusion in murine myocardium: A retrospectively triggered T1 -based ASL method using model-based reconstruction. Magn Reson Med. 2015 Dec;74(6):1705-15. https://doi.org/10.1002/mrm.25526.
Figures
