0151
Inhomogeneous Magnetization Transfer Steady State Imaging at 0.5T: Exploring SAR and B1+RMS envelope.
Andrew T Curtis1 and Chad T Harris1
1Research and Development, Synaptive Medical, Toronto, ON, Canada
1Research and Development, Synaptive Medical, Toronto, ON, Canada
Synopsis
A balanced steady state sequence with multiband saturation pulses was implemented on a 0.5T scanner to assess the potential for additional inhomogeneous magnetization transfer contrast generation from the higher SAR and B1+RMS limits. Volumes were acquired with B1+RMS saturation less than 15uT. Initial results are promising with ihMT contrast scaling nearly linearly with applied B1+ as expected, achieving contrast levels of 12-16% in white matter for B1+RMS of 15uT. This linear contrast increase could directly offset losses in polarization efficiency from mid-field as compared to high field, providing an interesting application area with competitive CNR.
Introduction
Inhomogeneous magnetization transfer (ihMT) imaging is an new contrast[1] suitable for brain imaging[3] that has recently been demonstrated to relate to myelin density[6] and orientation[5]. Originally utilizing a traditional pulsed preparation scheme followed by readout[1,3,4], work by Malik et.al.[2] proposed a multi band excitation pulse in steady state sequences to concurrently image and produce MT and/or ihMT contrast. These efforts are promising, but the RF intensive sequence employed are hampered by patient heating (SAR) limitations.RF intensive sequences like MT are particularly attractive at mid-field given its ample SAR and B1+ headroom. At 0.5T, the steady state sequences are interesting from an SNR-per-time perspective as well. The purpose of this work was to utilize the large B1+ and low SAR of a mid-field system to improve ihMT contrast in an efficient bSSFP acquisition.
Methods
All imaging experiments were implemented on a high-performance, head-only, mid-field 0.5T scanner (Evry, Synaptive Medical, Toronto, Canada) equipped with a volume transmit coil capable of 60uT peak B1+[8]. A balanced steady state sequence was modified to utilize a nonselective multiband excitation pulse based on the gaussian design by Malik [2,7].ihMT contrast is sensitive to B1+RMS of the pulse and the off-resonance frequency it is delivered at, $$$\Delta$$$[Hz]. Simulations following Malik et al [2,7] were modified with relaxation parameters for white matter at 0.5T (T1=493ms, T2=89ms[9]), and used to derive expected ihMT signal change as a function of off-resonance and B1+RMS. This guided selection of off-resonance and imaging flip angle. Each ihMT scan acquires four separate volumes, each excited with a different multiband RF pulse: a reference volume (single band excitation), a triple-band (symmetric MT at + and - ), and two dual-band pulses (with one-sided saturation at $$$+\Delta$$$ and $$$-\Delta$$$, respectively).
The bSSFP sequence was used to acquire these 3D volumes in a human volunteer, who provided informed consent in accordance with ethics policies. Imaging timings were chosen to be as close to [2] as possible for comparisons, while a low resolution was chosen for expedience in exploratory imaging. Volumes were acquired (3mm3 isotropic, TR: 5 ms, FA: 35⁰, pulse duration: 2ms, 200 steady states, total time: 18s/volume) with the 2+,2-, and 3 band pulses for a variety of B1+RMS (Table1). 15uT B1+RMS was selected as the upper limit, as the 2ms 3-band gaussian pulse had a peak B1+ of 59uT, just under the system limit of 60uT.
For processing, volumes were aligned to the non-MT reference with a simple rigid body transformation. MTR and ihMTR volumes were computed based on the reference, 2+, 2-, and 3-band acquisitions as in [2]. From these, measures of MTR and ihMTR were performed in two ROIs: one in normal appearing white matter (MNI co-ordinates -30, -9, 30), and one in the optic radiation (MNI co-ordinates -44, -41, 5) and compared to simulation, shown in figure 1.
Results
ihMT contrast was successfully observed in a human volunteer at 0.5T and, as expected, the contrast scaled with applied B1+RMS. Figure 1 demonstrates sample MTR and ihMTR maps. Table 2 summarizes simulated and measured signal change for MTR and ihMTR by B1+. ihMTR was observed to increase roughly linearly with applied B1+RMS saturation. The 5% contrast observed with 5uT saturation matches well with results in the literature[2].Discussion and Conclusion
Simulations suggest increases in contrast from improved ihMT saturation can make up for or even overcome the reduction in signal polarization as compared to 1.5T, making 0.5T quite competitive for investigations of ihMT. Preliminary imaging in the brain confirm these findings with large ihMT contrast generation, with contrast generation proportional to the B1+RMS. These levels are enabled both by the lower intrinsic SAR and an efficient head-only transmit coil design.Measured signal changes were significantly lower than predicted by simulation, but in line with similar experiments reported in the literature: Malik [2] reports 3-5% signal changes in the white matter for 4.7uT B1+RMS at 1.5T (also slightly lower than predicted by modelling). Resolution can also play a role in ihMTR results; Mchidna et al [3] report significant partial volume effects with attenuated ihMT measurements at lower imaging resolutions. The simulated signal behaviour depends strongly on the relaxation rate of the dipolar pool, T1d, which has yet to be well characterized at 0.5T. Future work should look to quantify T1d in white matter at 0.5T and re-assess optimal imaging parameters.
An important observation is that even at these large pulse powers there is still reasonable SAR headroom available. Scaling B1+RMS further until we reach the SAR limit is another extension that could further improve ihMT contrast levels and is achievable by either scaling pulse durations or the pulse shape/design. We predict 20-22uT B1+RMS achievable within SAR limits for the 72kg volunteer in this study.
With a roughly 3x contrast increase observed with 15uT saturation compared to what is reported at 1.5T, (5uT), one could envision utilizing this to directly offset losses in polarization efficiency, unlocking an interesting application area for mid-field scanners while maintaining competitive CNR.
Overall, it was demonstrated that large ihMT contrast can be generated by utilizing the high B1+RMS and SAR envelope available in a high-performance, head-only, mid field scanner.
Acknowledgements
The authors would like to thank Dr. Shaihan Malik for making his experimental code available online, greatly enabling this research.References
- Girard, O. M. et al. Magnetization transfer from inhomogeneously broadened lines (ihMT): Experimental optimization of saturation parameters for human brain imaging at 1.5 Tesla. Magn. Reson. Med. 2121, 1–11 (2014).
- Malik, S.J. et al. Steady‐state imaging with inhomogeneous magnetization transfer contrast using multiband radiofrequency pulses. Magn. Reason. Med. 83:935–949. (2020)
- Mchinda, S. et al. Whole brain inhomogeneous magnetization transfer (ihMT) imaging: Sensitivity enhancement within a steady-state gradient echo sequence. Magn. Reson. Med. 79:2607–2619 (2018).
- Varma, G. et al. In vivo measurement of a new source of contrast, the dipolar relaxation time, T1D, using a modified inhomogeneous magnetization transfer (ihMT) sequence. Magn. Reson. Med. 78, 1362–1372 (2017).
- Ercan, E. et al. Microstructural correlates of 3D steady-state inhomogeneous magnetization transfer (ihMT) in the human brain white matter assessed by myelin water imaging and diffusion tensor imaging. Magn. Reson. Med. 2402–2414. (2018)
- Prevost, V.H. et al. Validation of inhomogeneous Magnetization Transfer (ihMT) as a myelin biomarker. Proc. Intl. Soc. ISMRM #4549 (2017)
- ihMT_steadystate https://github.com/mriphysics/ihMT_steadystate, commit 0db78e5, Aug 2019
- Stainsby, J.A. et al. Imaging at 0.5 T with high-performance system components. Proc. Intl. Soc. ISMRM #1194 (2019)
- Campbell-Washburn, A.E., et al. Image contrast at 0.55T. Proc. Intl. Soc. ISMRM #1214 (2019)
Figures
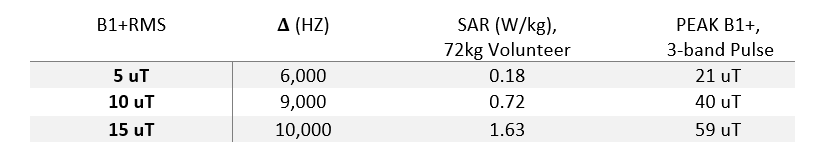
Table 1: Experimental B1+RMS parameters per scan and peak SAR and B1+.
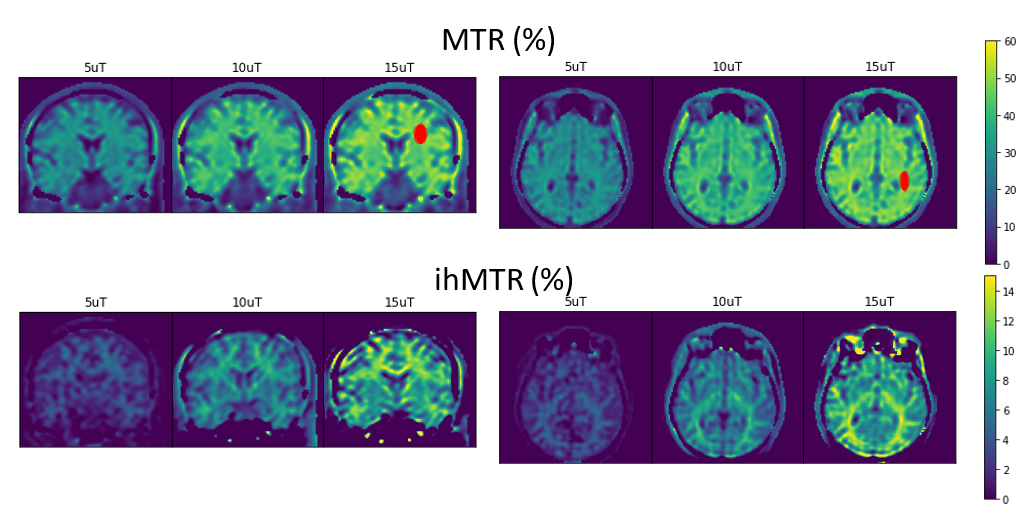
Figure 1: Coronal and Axial views of MTR and ihMTR as a
function of pulse B1+RMS. Shaded regions
indicate ROIs used for MTR and ihMTR measurements in Table 2. Larger % ihMTR is
visible in the denser white matter tracts, as compared to MTR which is relatively
more homogeneous across all white matter.
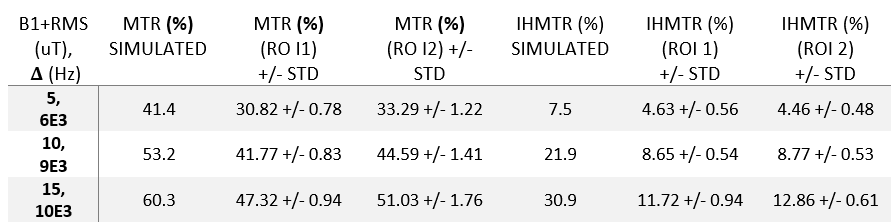
Table 2: Observed and simulated MTR and ihMTR versus applied B1+RMS in two sample ROIs.