0150
Non-invasive mapping of cerebral glucose transport and metabolism using glucoCESL MRI1Division of Neuroscience and Experimental Psychology, Faculty of Biology Medicine and Health, The University of Manchester, Manchester, United Kingdom, 2Geoffrey Jefferson Brain Research Centre, Manchester Academic Health Science Centre, Manchester, United Kingdom, 3Department of Radiology, University of Pittsburgh, Pittsburgh, PA, United States, 4Division of Informatics, Imaging, and Data Sciences, Faculty of Biology, Medicine, and Health, The University of Manchester, Manchester, United Kingdom, 5Centre for Medical Image Computing, Department of Computer Science and Department of Neuroinflammation, University College London, London, United Kingdom, 6Bioxydyn Ltd, Manchester, United Kingdom
Synopsis
Chemical-exchange spin-lock (CESL) MRI can detect uptake and clearance of intravenously administered glucose into the brain at high spatial resolution. We apply quantitative modelling to describe glucoCESL kinetics in tumour-bearing and healthy rats. Parameters relating to glucose transport (Tmax, Kt, kd), metabolism (MRglu) and blood volume (vb) were estimated and compared between tumour and cortical tissue. Kinetic modelling of glucoCESL MRI data yields meaningful estimates of glucose transport and metabolism, and our modelling approach holds great promise to probe glucose transport and metabolism at high spatial resolution.
Introduction
Chemical-exchange saturation transfer (CEST) and spin-lock (CESL) MRI can non-invasively detect uptake of intravenously administered glucose into the brain1,2. However, kinetic modelling to determine quantitative parameters relating to glucose transport and metabolic rates has not been applied to this type of data. We introduce the theoretical background for kinetic modelling of glucoCESL data, and evaluate two models to estimate transport and metabolic parameters in healthy rats and in a rat glioma model.Theory
Changes in R1,ρ are proportional to changes in glucose concentration (ΔC)1:$$\Delta R_{1,\rho} = r_{g}\Delta C$$
where $$$r_{g}$$$ is the R1,ρ relaxivity of glucose.
Two kinetic models are proposed (Figure 1). Both models assume the metabolic rate of glucose consumption, MRglu, is not dependent on local glucose availability. Model 1 assumes the influx and efflux rates of glucose across the blood-brain barrier (BBB), k1 and k2, are governed by Michelis-Menten kinetics3 and thus dependent on the arterial and tissue glucose concentrations respectively. Model 2 assumes a mixture of Michelis-Menten kinetics and passive diffusion across the BBB4. The mass transport equation for both models is:
$$\frac{dC(t)}{dt} = k_{1}C_{a}(t) - k_{2}C_{1}(t) - MR_{glu}$$
where all parameters are defined in Figure 1. The total glucose concentration in tissue is modelled as:
$$C(t) = v_{b}C_{a}(t) + (1-v_{b})C_{1}(t)$$
where $$$v_{b}$$$ is the fractional blood volume.
Methods
Animals: Animal studies were approved by the Institutional Animal Care and Use Committee at the University of Pittsburgh. Animal preparation and MRI experiments have been described previously1,5. Fischer 344 rats weighing 252-283 g (n = 4) (Charles River, Wilmington, MA) were inoculated with 9L cells and imaged 4-5 weeks later. Healthy Sprague-Dawley rats weighing 335-388g (n = 3) were also imaged.MRI: Rats were anesthetized with 2% isoflurane in a mixture of O2 and air and the right femoral artery catheterised. SE-EPI CESL images with and without R1,ρ-weighting (i.e., spin-lock pulse duration TSL = 0 and 50 ms, B1 ∼ 500 Hz) were acquired at 9.4 T in an interleaved manner and data fit using an exponential model to estimate R1,ρ time-courses. Scan parameters of CESL images are given in Table 1. A glucose bolus (1g/kg) was injected after 20 minutes (tumour bearing) and 30 minutes (healthy) of baseline data over approximately 30-60 seconds, after which R1,ρ was measured for 50 minutes.
Analysis: Voxelwise estimates of ∆R1,ρ(t) were converted to estimates of ∆C(t) using $$$r_{g}$$$ = 0.067 (s mM)−1 derived from Figure 1D of Jin et al.1. Kinetic models were fit to measured ∆C(t) time-courses using the ordinary differential equation solver ode45 and lsqcurvefit function in Matlab (Mathworks, version 5 2017a). A bi-exponential fit to a population-based input function given in Figure 4C of Nasrallah et al. was used for Ca(t)6 (Figure 2a). Datapoints for calculation of $$$r_{g}$$$ and Ca(t) were extracted from .png files of the respective figures using the GrabIt function in Matlab.
Regions of interest (ROIs) were drawn manually in tumour and cortex regions. Cortical values of kinetic parameters in healthy rats were combined with cortical values from tumour-bearing rats, and differences between cortex (n = 7) and tumour (n = 4) evaluated using t-tests for partially overlapping samples. The Akaike information criterion (AIC) and ∆AIC (∆AIC = AIC1 – AIC2) were computed to compare model fits. Statistical analysis was done in R (version 4.0.2).
Results
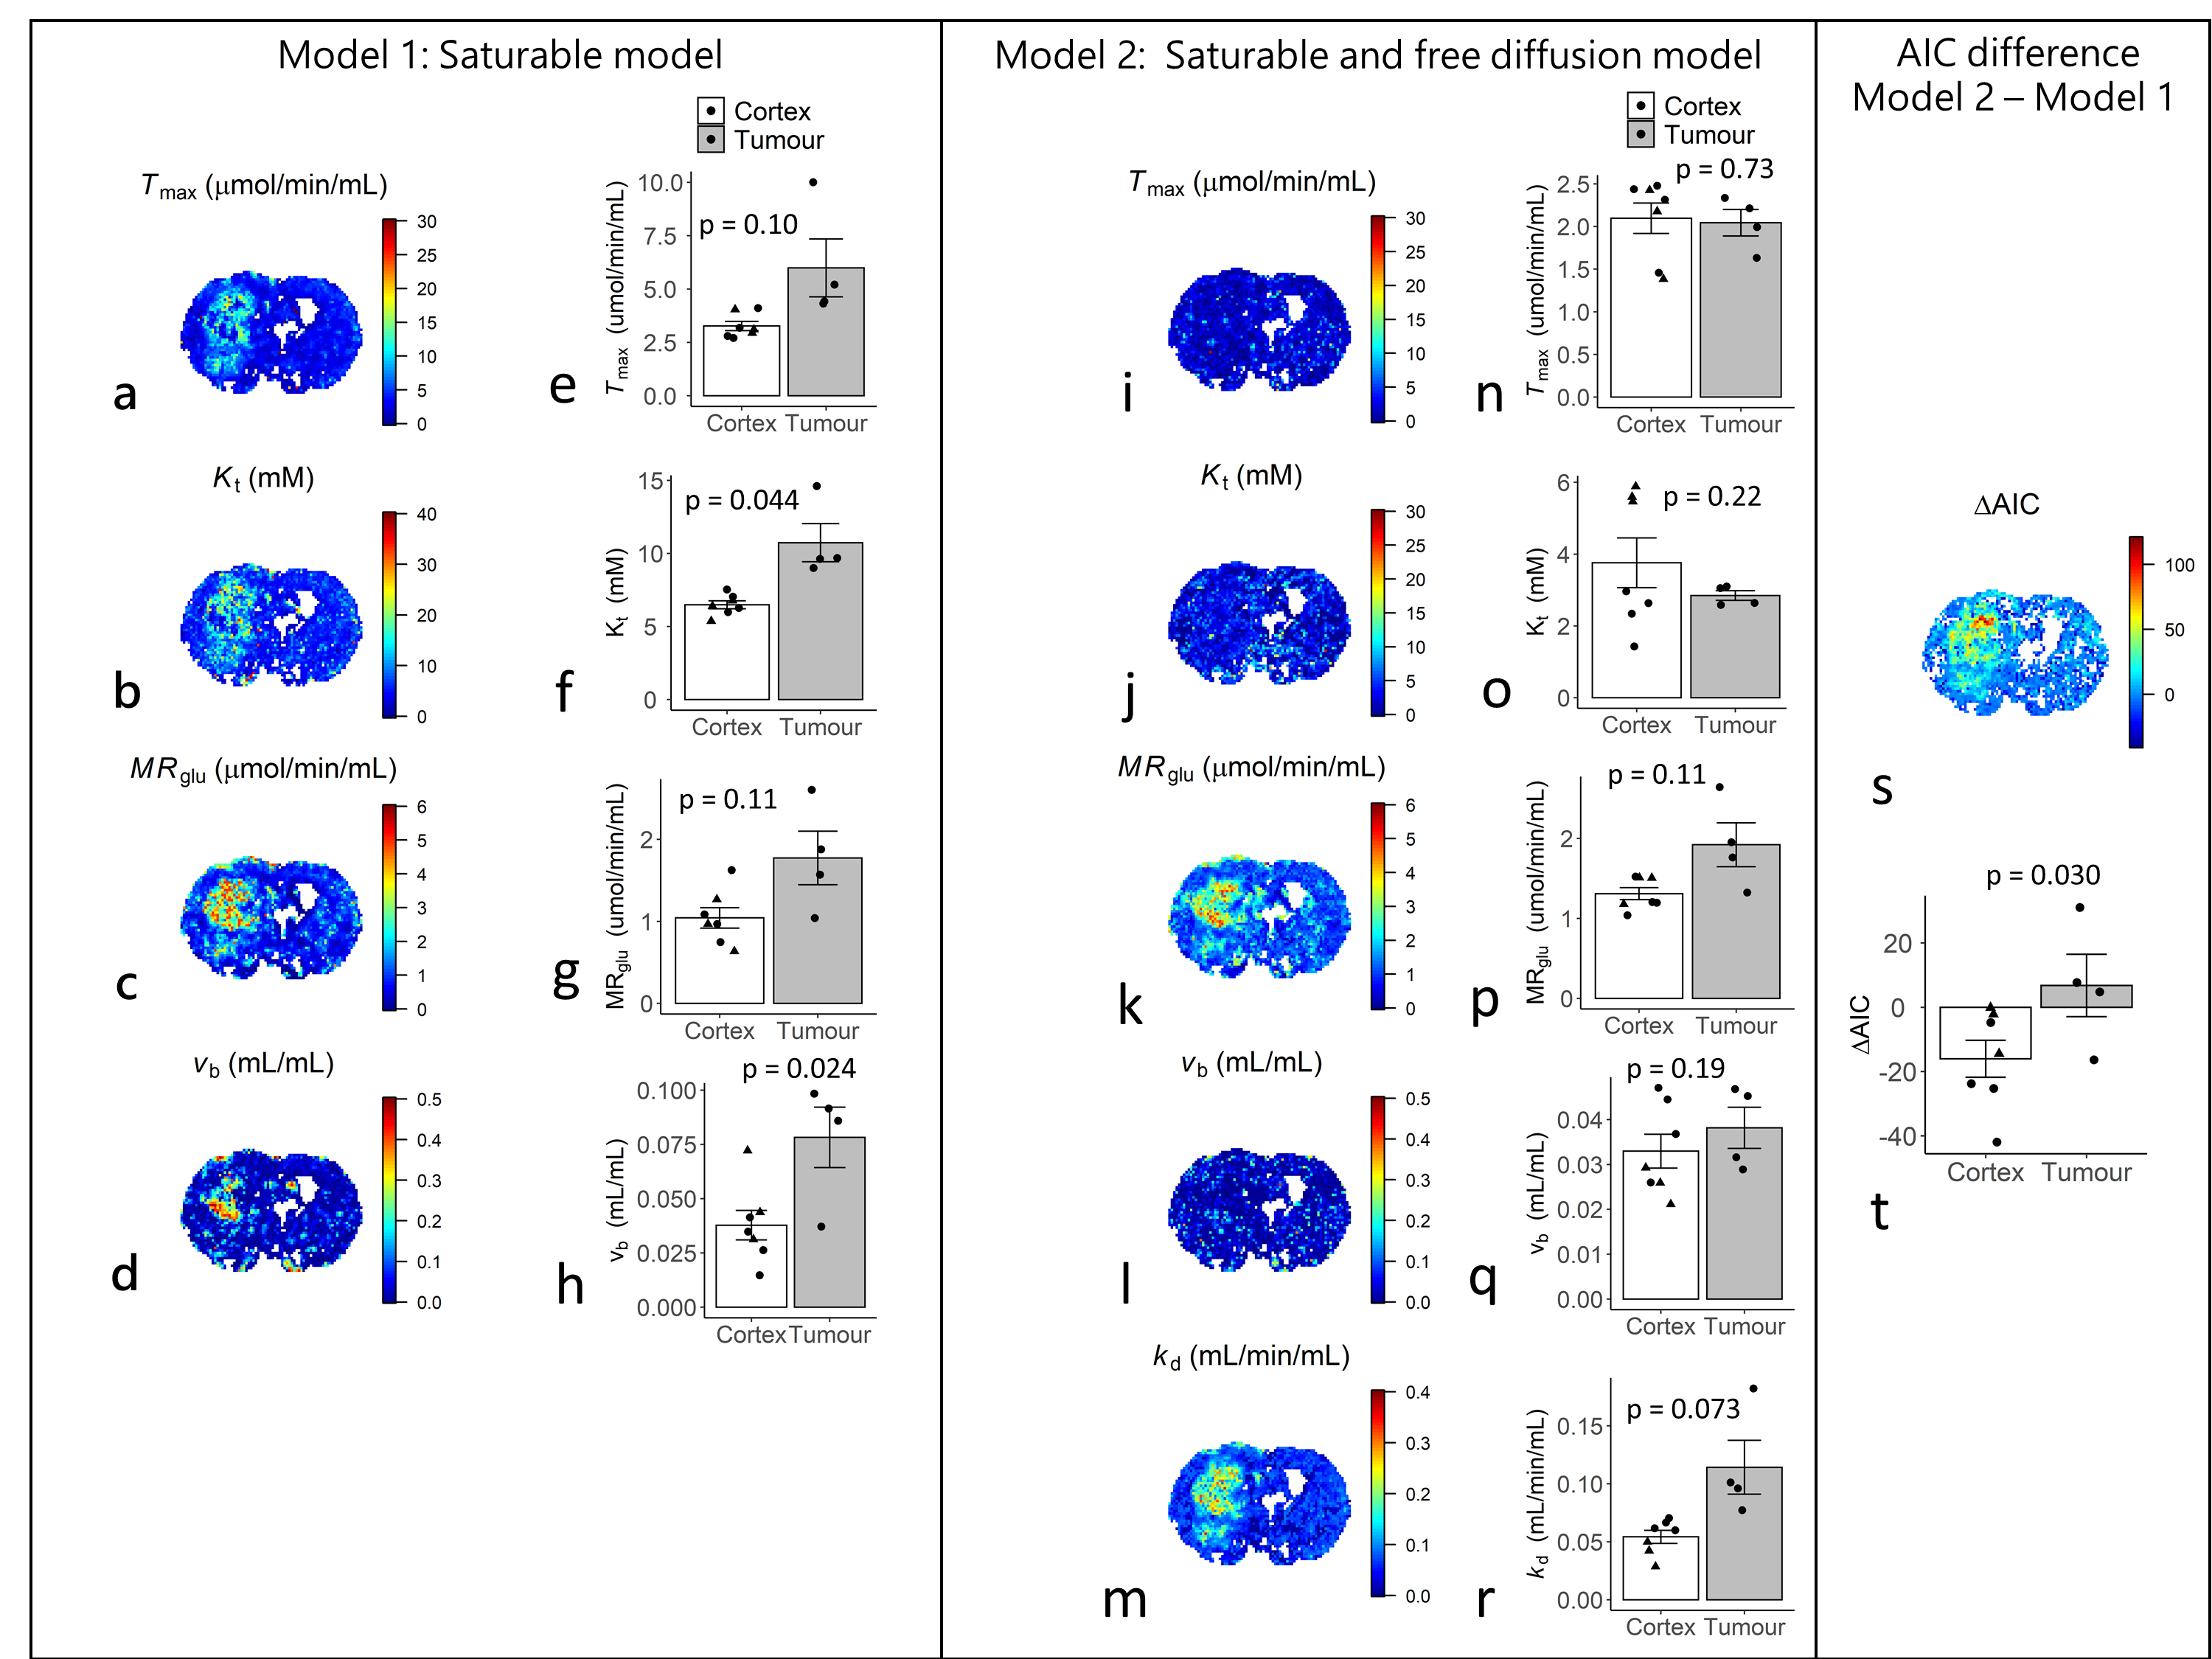
Figures 2b-c show sensitivity of ∆R1,ρ to kinetic parameters. Figure 3 shows an example of tumour and cortical ROI definition, and example ∆C(t) time-courses and model fits. Figure 4 shows parametric maps for a tumour bearing rat, and mean values of each parameter in cortex and tumour tissue. Model 1 had a lower AIC than model 2 in cortex (ΔAIC < 0, p = 0.032). In some tumours, model 2 had lower AIC than model 1 (ΔAIC > 0), indicating possible BBB disruption, however overall there was no difference (p = 0.53). Kt and vb from model 1 were significantly higher in tumour tissue compared to cortex.Discussion
Estimates of Tmax, Kt, MRglu, kd and vb were found to lie well within the range of previously published values7. Significant differences in Kt and vb were observed between tumour and cortical tissue, demonstrating the potential of the proposed approach to detect abnormal vascularity and glucose transport in-vivo. Model 2 provided no additional information above model 1 in either cortex or tumour (Figure 4t). However some tumours had positive ∆AIC (Figure 4s), possibly indicating disruption of the BBB. The half saturation constant Kt will also trade-off saturable and non-saturable kinetics – higher Kt observed in tumour tissue may also indicate increased passive diffusion8. Model 2 predicted similar vb in cortex and tumour, whereas model 1 predicted higher vb in tumour tissue, the latter agreeing with a study investigating 9L glioma blood volume9. The parameter kd was able to capture variability associated with Tmax, Kt and vb, and modelling transport via free diffusion only may provide an adequate descriptive model in tumour tissue. Validation is now needed to determine the validity of the proposed kinetic models.Conclusion
We have demonstrated the feasibility of applying kinetic models to glucoCESL MRI data and show the potential of the approach to probe glucose transport and metabolism at high spatial resolution.Acknowledgements
We would like to acknowledge the Medical Research Council for funding (MRC Confidence in Concept Round 6, MC_PC_17172).References
1. Jin, T., Mehrens, H., Hendrich, K.S. and Kim, S.G., 2014. Mapping brain glucose uptake with chemical exchange-sensitive spin-lock magnetic resonance imaging. Journal of Cerebral Blood Flow & Metabolism, 34(8), pp.1402-1410.
2. Paech, D., Schuenke, P., Koehler, C., Windschuh, J., Mundiyanapurath, S., Bickelhaupt, S., Bonekamp, D., Bäumer, P., Bachert, P., Ladd, M.E. and Bendszus, M., 2017. T1ρ-weighted dynamic glucose-enhanced MR imaging in the human brain. Radiology, 285(3), pp.914-922.
3. Lund-Andersen, H.E., 1979. Transport of glucose from blood to brain. Physiological reviews, 59(2), pp.305-352.
4. Pardridge, W.M. and Oldendorf, W.H., 1977. Transport of Metabolic substrates through the blood-brain barrier, Journal of neurochemistry, 28(1), pp.5-12.
5. Jin, T., Iordanova, B., Hitchens, T.K., Modo, M., Wang, P., Mehrens, H. and Kim, S.G., 2018. Chemical exchange–sensitive spin‐lock (CESL) MRI of glucose and analogs in brain tumors. Magnetic resonance in medicine, 80(2), pp.488-495.
6. Nasrallah, F.A., Pagès, G., Kuchel, P.W., Golay, X. and Chuang, K.H., 2013. Imaging brain deoxyglucose uptake and metabolism by glucoCEST MRI. Journal of Cerebral Blood Flow & Metabolism, 33(8), pp.1270-1278.
7. Mason, G.F., Behar, K.L., Rothman, D.L. and Shulman, R.G., 1992. NMR determination of intracerebral glucose concentration and transport kinetics in rat brain. Journal of Cerebral Blood Flow & Metabolism, 12(3), pp.448-455.
8. Fross, R.D., Warnke, P.C. and Groothuis, D.R., 1991. Blood flow and blood-to-tissue transport in 9L gliosarcomas: the role of the brain tumor model in drug delivery research. Journal of neuro-oncology, 11(3), pp.185-197.
9. Bouchet, A., Bidart, M., Miladi, I., Le Clec’h, C., Serduc, R., Coutton, C., Regnard, P., Khalil, E., Dufort, S., Lemasson, B. and Laissue, J., 2014. Characterization of the 9L gliosarcoma implanted in the Fischer rat: an orthotopic model for a grade IV brain tumor. Tumor biology, 35(7), pp.6221-6233.
Figures