0149
Quasi-steady-state (QUASS) CEST for robust quantification of tumor MT and APT effects by correction of saturation time and relaxation delay1Institute of Science and Technology for Brain-Inspired Intelligence, Fudan University, Shanghai, China, 2Yerkes National Primate Research Center, Emory University, Atlanta, GA, United States, 3Paul C. Lauterbur Research Center for Biomedical Imaging, Shenzhen Institutes of Advanced Technology, Chinese Academy of Sciences, Shenzhen, China
Synopsis
To reduce CEST measurement’s dependence on long RF saturation duration (Ts) and relaxation delay (Td), we developed a post-processing strategy to derive the quasi-steady-state (QUASS) CEST from apparent measurements. The simulation and in-vivo experiment results show that the apparent MT and APT effects and their contrast substantially depend on Ts and Td. In comparison, the QUASS MT and APT effects and their difference between contralateral normal tissue and tumor exhibit little dependence on Ts and Td. To conclude, the QUASS CEST algorithm enables robust CEST quantification and offers a straightforward approach to standardize CEST measurements.
Introduction
In chemical exchange saturation transfer (CEST) imaging, the use of insufficiently long RF saturation duration (Ts) and relaxation delay (Td) may underestimate the CEST measurement 1,2. Recently, Tanoue et al. demonstrated the impact of RF saturation duration on the CEST effect at 11.7 Tesla 3. It takes prolonged saturation and recovery time to reach the steady-state. A trade-off has to be made between the magnitudes of the CEST effect and scan time, and as a result, most CEST experiments were performed at non-steady-state to expedite the scan. Such a time dependence runs the risk of underestimating the CEST signal and makes it difficult to compare findings across studies and centers when different time-related parameters are chosen. To reduce CEST measurement’s dependence on Ts and Td, we developed a post-processing strategy to derive the quasi-steady-state (QUASS) CEST effects from experimental (apparent) measurements for robust CEST quantification.Methods and Materials
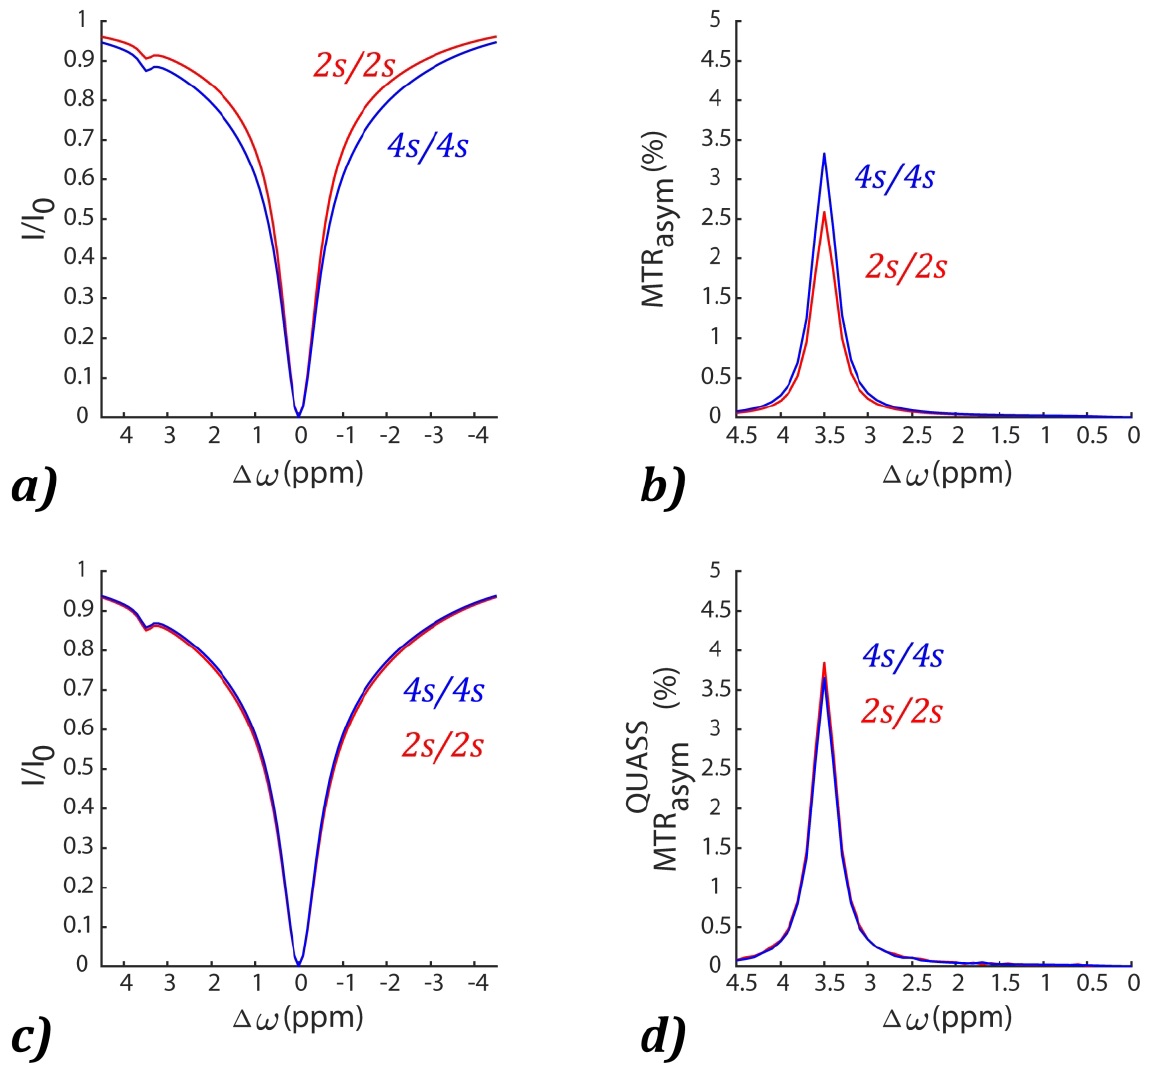
Theory: For a representative CEST sequence with a CW RF saturation, the experimentally measured control scan ($$$I_{0}^{app}$$$) is given by $$$I_{0}^{app}=I_{0} \times (1-e^{-R_{1w}\times(T_{s}+T_{d})})$$$ under the conditions of insufficient saturation time (Ts) and relaxation delay (Td). Meanwhile, the respective saturated scan ($$$I^{app}$$$) is given by $$$I^{app}=I_{0} \times (1-e^{-R_{1w}\times T_{d}})e^{-R_{1 \rho} \times T_{s} }+I_{0} \times \frac{R_{1w}}{R_{1 \rho}}cos^{2} \theta(1-e^{-R_{1 \rho} \times T_{s} })$$$. Then, we combined and rewrote the Eqs, as, $$$\frac{I^{app}(1-e^{-R_{1w}\times(T_{s}+T_{d})})}{I_{0}^{app}(1-e^{-R_{1w}\times T_{d}})}=1+(1-e^{-A})(\frac{R_{1w}T_{s}}{A} \times \frac{cos^{2}\theta }{1-e^{-R_{1w}\times T_{d}}}-1 )$$$ , where A = R1ρ∙Ts. From the normalized apparent signal, R1ρ and the QUASS CEST effect can be calculated as $$$(\frac{I}{I_{0}})^{QUASS}=\frac{R_{1w}}{R_{1\rho}}cos^{2}\theta$$$.Numerical Simulation: We simulated the CEST effect using a classical 3-pool Bloch McConnell (BM) equations in MATLAB 2019a (MathWorks, Natick, MA) with bulk water, amide protons, and semisolid macromolecules 4. The apparent and QUASS CEST results obtained under different Ts/Td of 2s/2s and 4s/4s were compared at 11.7 T.
Animal Model and MRI: Animal experiments have been approved by the University Ethics Committee. C6 glioma cells (ATCC) were stereotaxically injected into the striatum of the Sprague–Dawley (SD) rat brain to establish brain tumor model. MRI scans were performed at an 11.7 T scanner (Bruker Biospin, Ettlingen, Germany). An 89 mm volume coil was used for transmission, and a 4-channel surface rat head coil was used for receiving. T1 mapping and T2 mapping were acquired for the quantification of CEST effects. A water saturation shift referencing (WASSR) map was collected to correct B0 inhomogeneity. For CEST MRI, Z-spectra were obtained from -4.5 to 4.5 ppm with intervals of 0.1 ppm under B1 of 1 μT using a fat-suppressed RARE image readout with Ts/Td of 2s/2s and 4s/4s, in addition to an unsaturated scan.
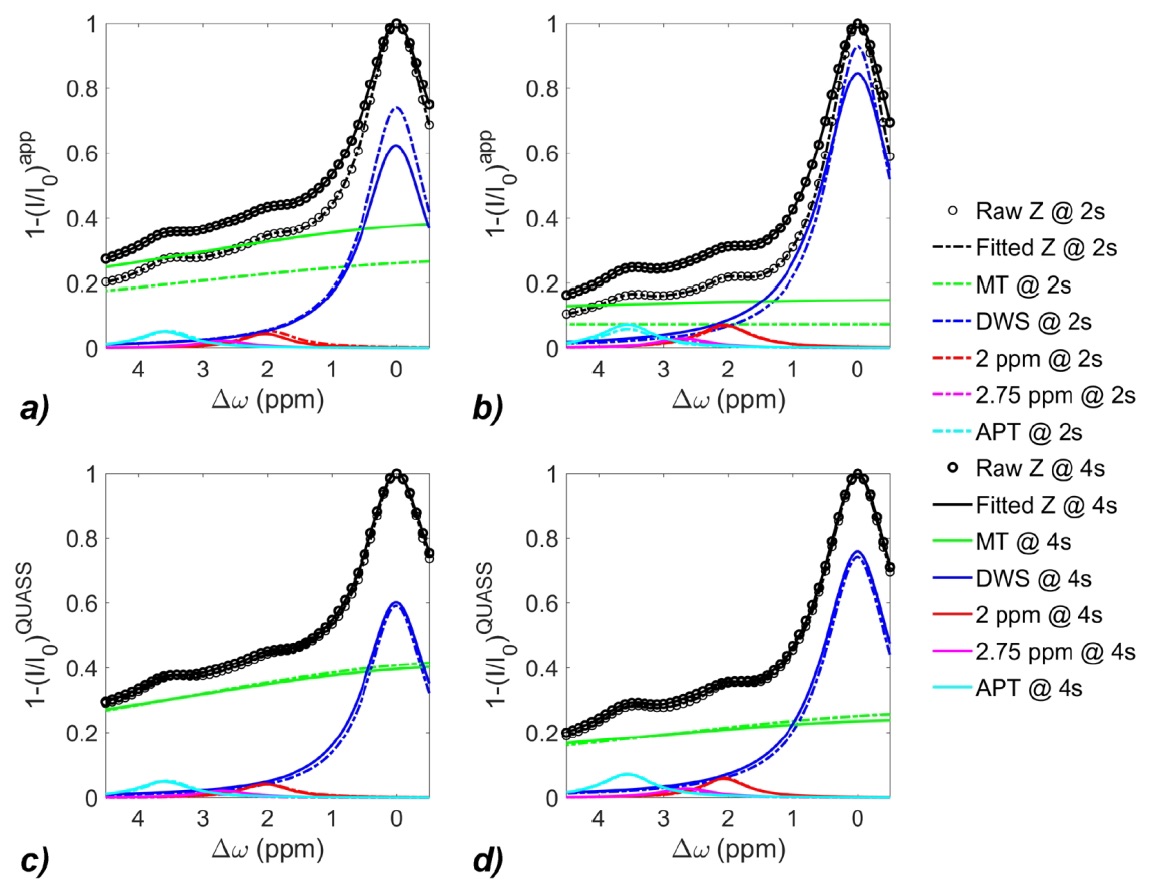
Data Analysis: The saturated scans were normalized by the controls can as $$$Z^{app}=\frac{I^{app}}{I_{0}^{app}}$$$. We interpolated Z-spectra by smoothing splines and corrected the field inhomogeneity by shifting the minimum of the Z-spectrum to the water resonance 5. The QUASS Z-spectra (ZQUASS) were calculated as in the Theory part. Both Zapp and ZQUASS were fitted using a multipool Lorentzian model, $$$Z(\omega)=1-\sum \limits_{i=1}^{5}L_{i}(\omega)$$$, where Li is the Lorentzian spectrum of the ith pool. Here, a partial Z-spectrum of frequency offsets from -0.5 to 4.5 ppm was fitted to exclude frequency offsets where NOE may confound. Apparent and QUASS MT and APT effects calculated from Zapp and ZQUASS were calculated in the tumor and contralateral normal regions, respectively. Paired Student’s t-test was used, and P values less than 0.05 were considered statistically significant.
Results and Discussion
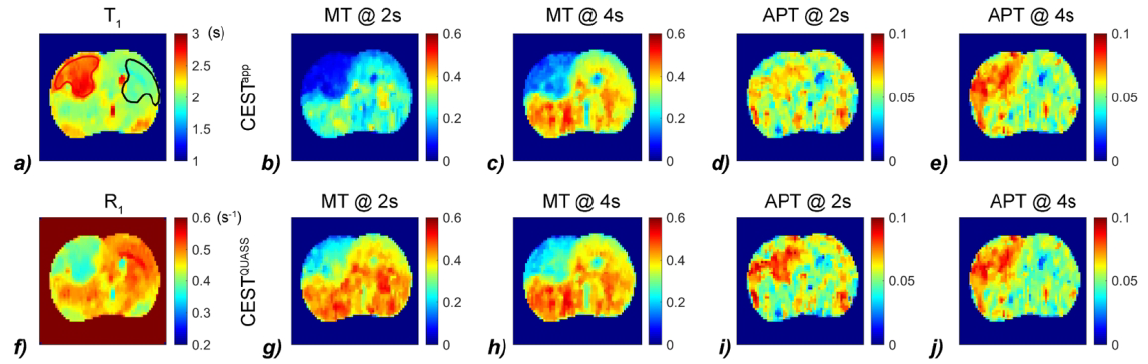
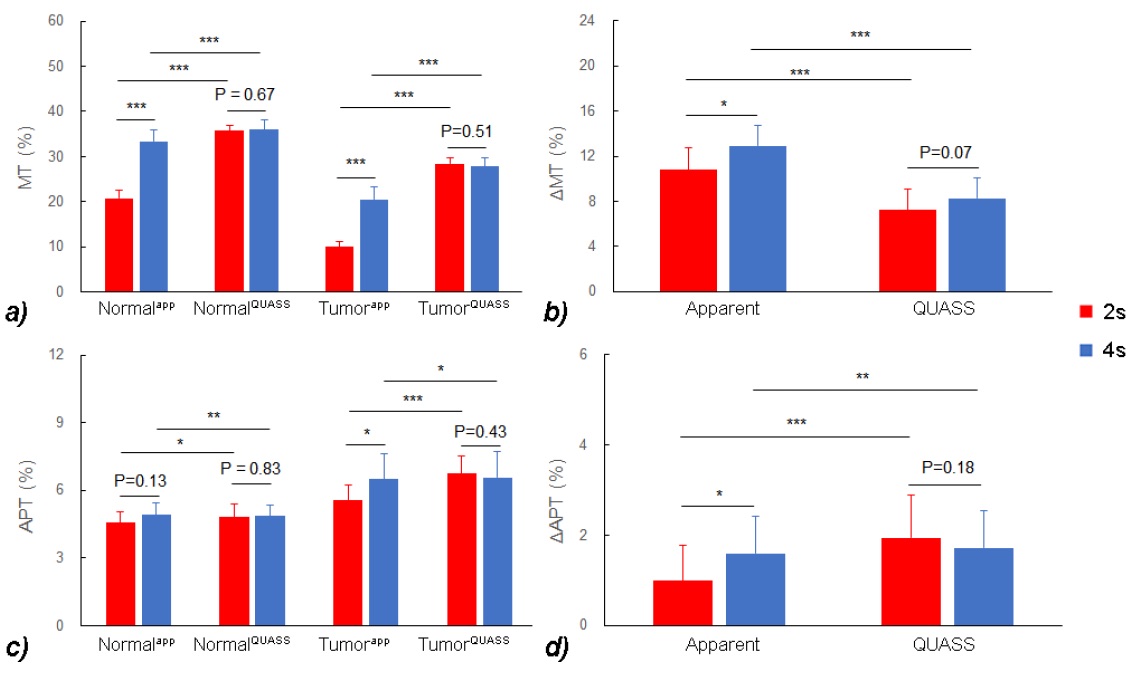
As shown in Figure 1, the simulations demonstrate the dependence of the apparent CEST effect on Ts and Td, and such reliance is mitigated with the QUASS algorithm. Figure 2 compares the multipool Lorentzian fitting of representative apparent (Fig. 2a and 2b) and QUASS (Fig. 2c and 2d) Z-spectra obtained with different Ts/Td times in contralateral normal tissue (Fig. 2a and 2c) and tumor (Fig. 2b and 2d) regions. MT and CEST effects from apparent Z-spectra show a noticeable difference between different saturation duration and relaxation delay. In comparison, MT and CEST curves determined from QUASS Z-spectra overlaps reasonably well with Ts/Td of 2s/2s and 4s/4s. Figure 3 shows the multiparametric images of a representative C6 glioma rat. Compared with the contralateral normal tissue, the tumor region exhibits hyperintensity in T1 and APT images with a signal decrease in R1 and MT maps. In particular, the magnitude of the apparent MT and APT effects increases substantially with the increase of Ts and Td times (Fig. 3b-e). In comparison, MT and APT images reconstructed from the QUASS post-processing show little Ts and Td dependence (Fig. 3g-j). In addition, as shown in Figure 4, the QUASS MT and APT signals are significantly higher than the apparent MT and APT signals, suggesting substantially difference between the apparent non-steady-state from the quasi-steady states determined from the proposed QUASS algorithm.Conclusion
The QUASS CEST algorithm may enable robust CEST quantification and offers a straightforward approach to standardize CEST experiments.Acknowledgements
This study was supported in part by grants from the National Natural Science Foundation of China (81873893, 81871348 and 91859102), the Key Areas Research and Development Program of Guangdong (2019B020235001), the Shanghai Science and Technology Committee (20ZR1407800), and the Shanghai Municipal Science and Technology Major Project (2018SHZDZX01).References
1. Sun PZ. Simplified quantification of labile proton concentration-weighted chemical exchange rate (k(ws) ) with RF saturation time dependent ratiometric analysis (QUESTRA): normalization of relaxation and RF irradiation spillover effects for improved quantitative chemical exchange saturation transfer (CEST) MRI. Magn Reson Med 2012;67(4):936-942.
2. Zaiss M, Angelovski G, Demetriou E, McMahon MT, Golay X, Scheffler K. QUESP and QUEST revisited - fast and accurate quantitative CEST experiments. Magn Reson Med 2018;79(3):1708-1721.
3. Tanoue M, Saito S, Takahashi Y, Araki R, Hashido T, Kioka H, Sakata Y, Yoshioka Y. Amide proton transfer imaging of glioblastoma, neuroblastoma, and breast cancer cells on a 11.7T magnetic resonance imaging system. Magn Reson Imaging 2019;62:181-190.
4. Woessner DE, Zhang S, Merritt ME, Sherry AD. Numerical solution of the Bloch equations provides insights into the optimum design of PARACEST agents for MRI. Magn Reson Med 2005;53(4):790-799.
5. Stancanello J, Terreno E, Castelli DD, Cabella C, Uggeri F, Aime S. Development and validation of a smoothing-splines-based correction method for improving the analysis of CEST-MR images. Contrast Media Mol Imaging 2008;3(4):136-149.
Figures