0148
Deep Learning Enables A Half Z-spectrum Sampling-based B0 Inhomogeneity Correction for CEST MRI1Department of Diagnostic Radiology and Nuclear Medicine, University of Maryland School of Medicine, Baltimore, MD, United States, 2Department of Radiology, University of Pennsylvania Perelman School of Medicine, Philadelphia, PA, United States, 3Department of Neurology, University of Pennsylvania Perelman School of Medicine, Philadelphia, PA, United States
Synopsis
This study presents a DL based framework for correcting B0 inhomogeneity for GluCEST imaging using fewer acquisitions. Based on 3 or 5 positive offset CEST images, the proposed method can save >80% of CEST imaging acquisition time as compared to current 26 pairs of double site z-spectrum irradiations based protocol. This approach can be applied to other CEST imaging as well.
Introduction
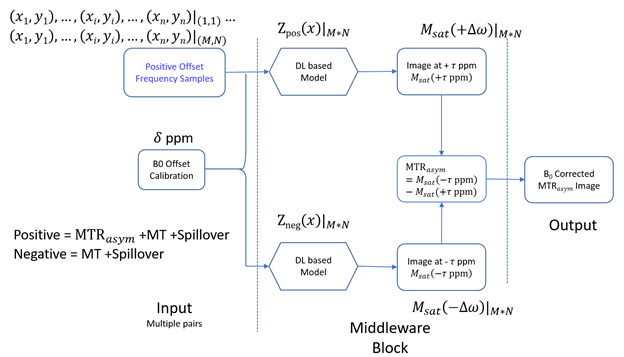
Glutamate weighted Chemical Exchange Saturation Transfer (GluCEST) MRI is a noninvasive technique for mapping parenchymal glutamate in the brain [1-4]. GluCEST signal is sensitive to magnetic field (B0) inhomogeneity. Corrections for B0 inhomogeneity often require sampling both sides of the z-spectrum at different saturation offsets, which prolongs the total acquisition time and can cause practical issues such as increased sensitive to patient motion [5][6]. Using deep learning (DL), we have recently shown the capability of correcting the B0-inhomogeneity induced confounds in GluCEST using less than half of z-spectrum samples with higher signal-to-noise-ratio (SNR) than the non-DL method. That capability is based on the smoothness of the z-spectrum, which allows a reliable data interpolation based on a few sample points. In this study, we extend that capability by predicting both the positive and negative 3ppm signal from a few downfield offset images. Our rationale is that the positive offset images contain both the background signal (B) and the CEST contrast (C), making it possible to use a DL network to learn the nonlinear transform from B+C to B. In other words, the negative offset images can be predicted from the positive offset images.Methods
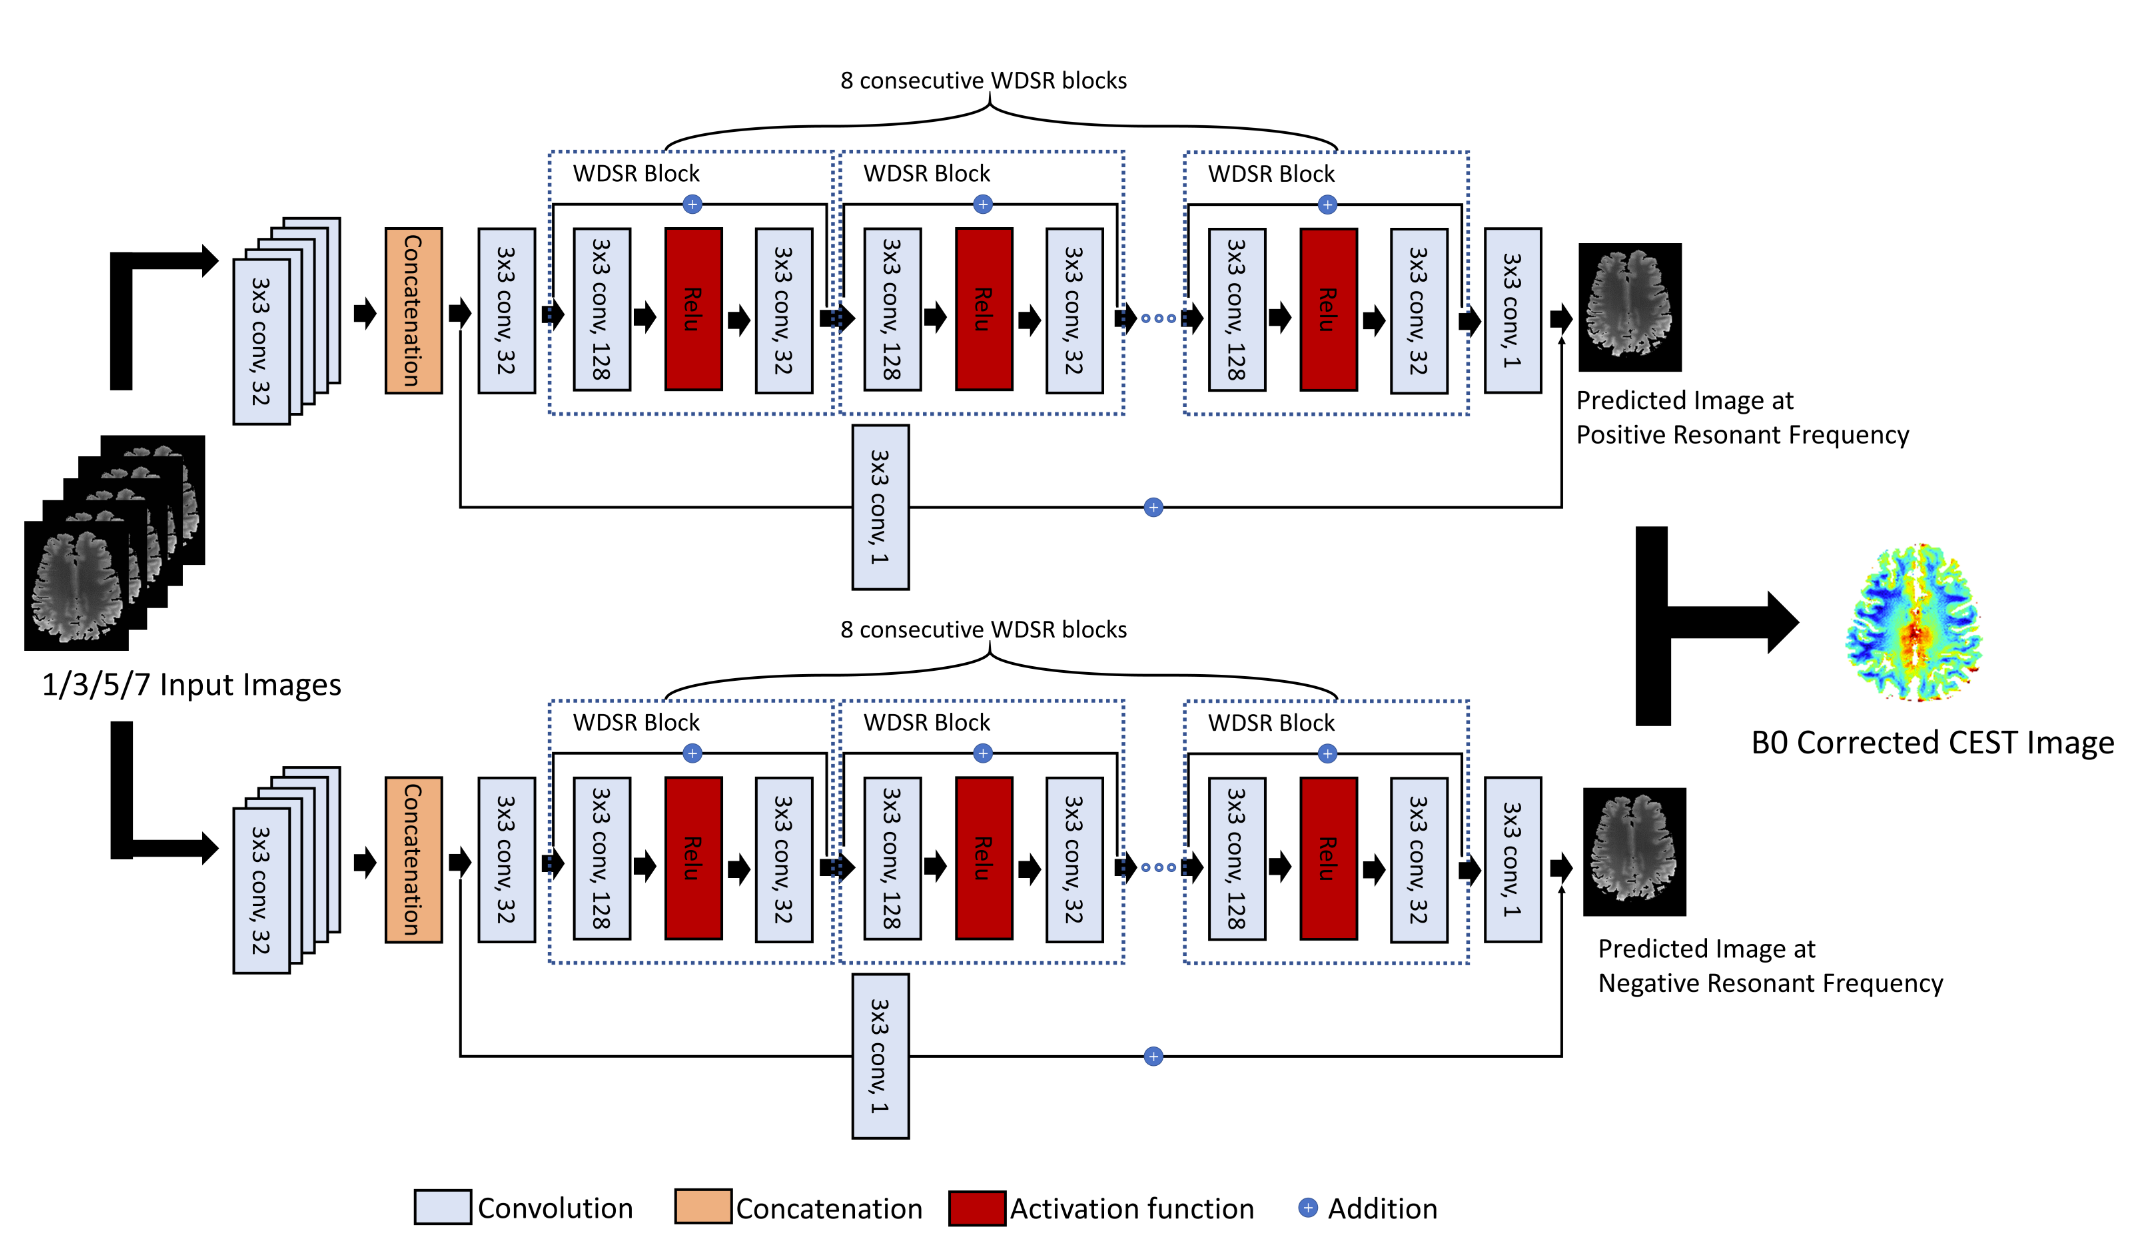
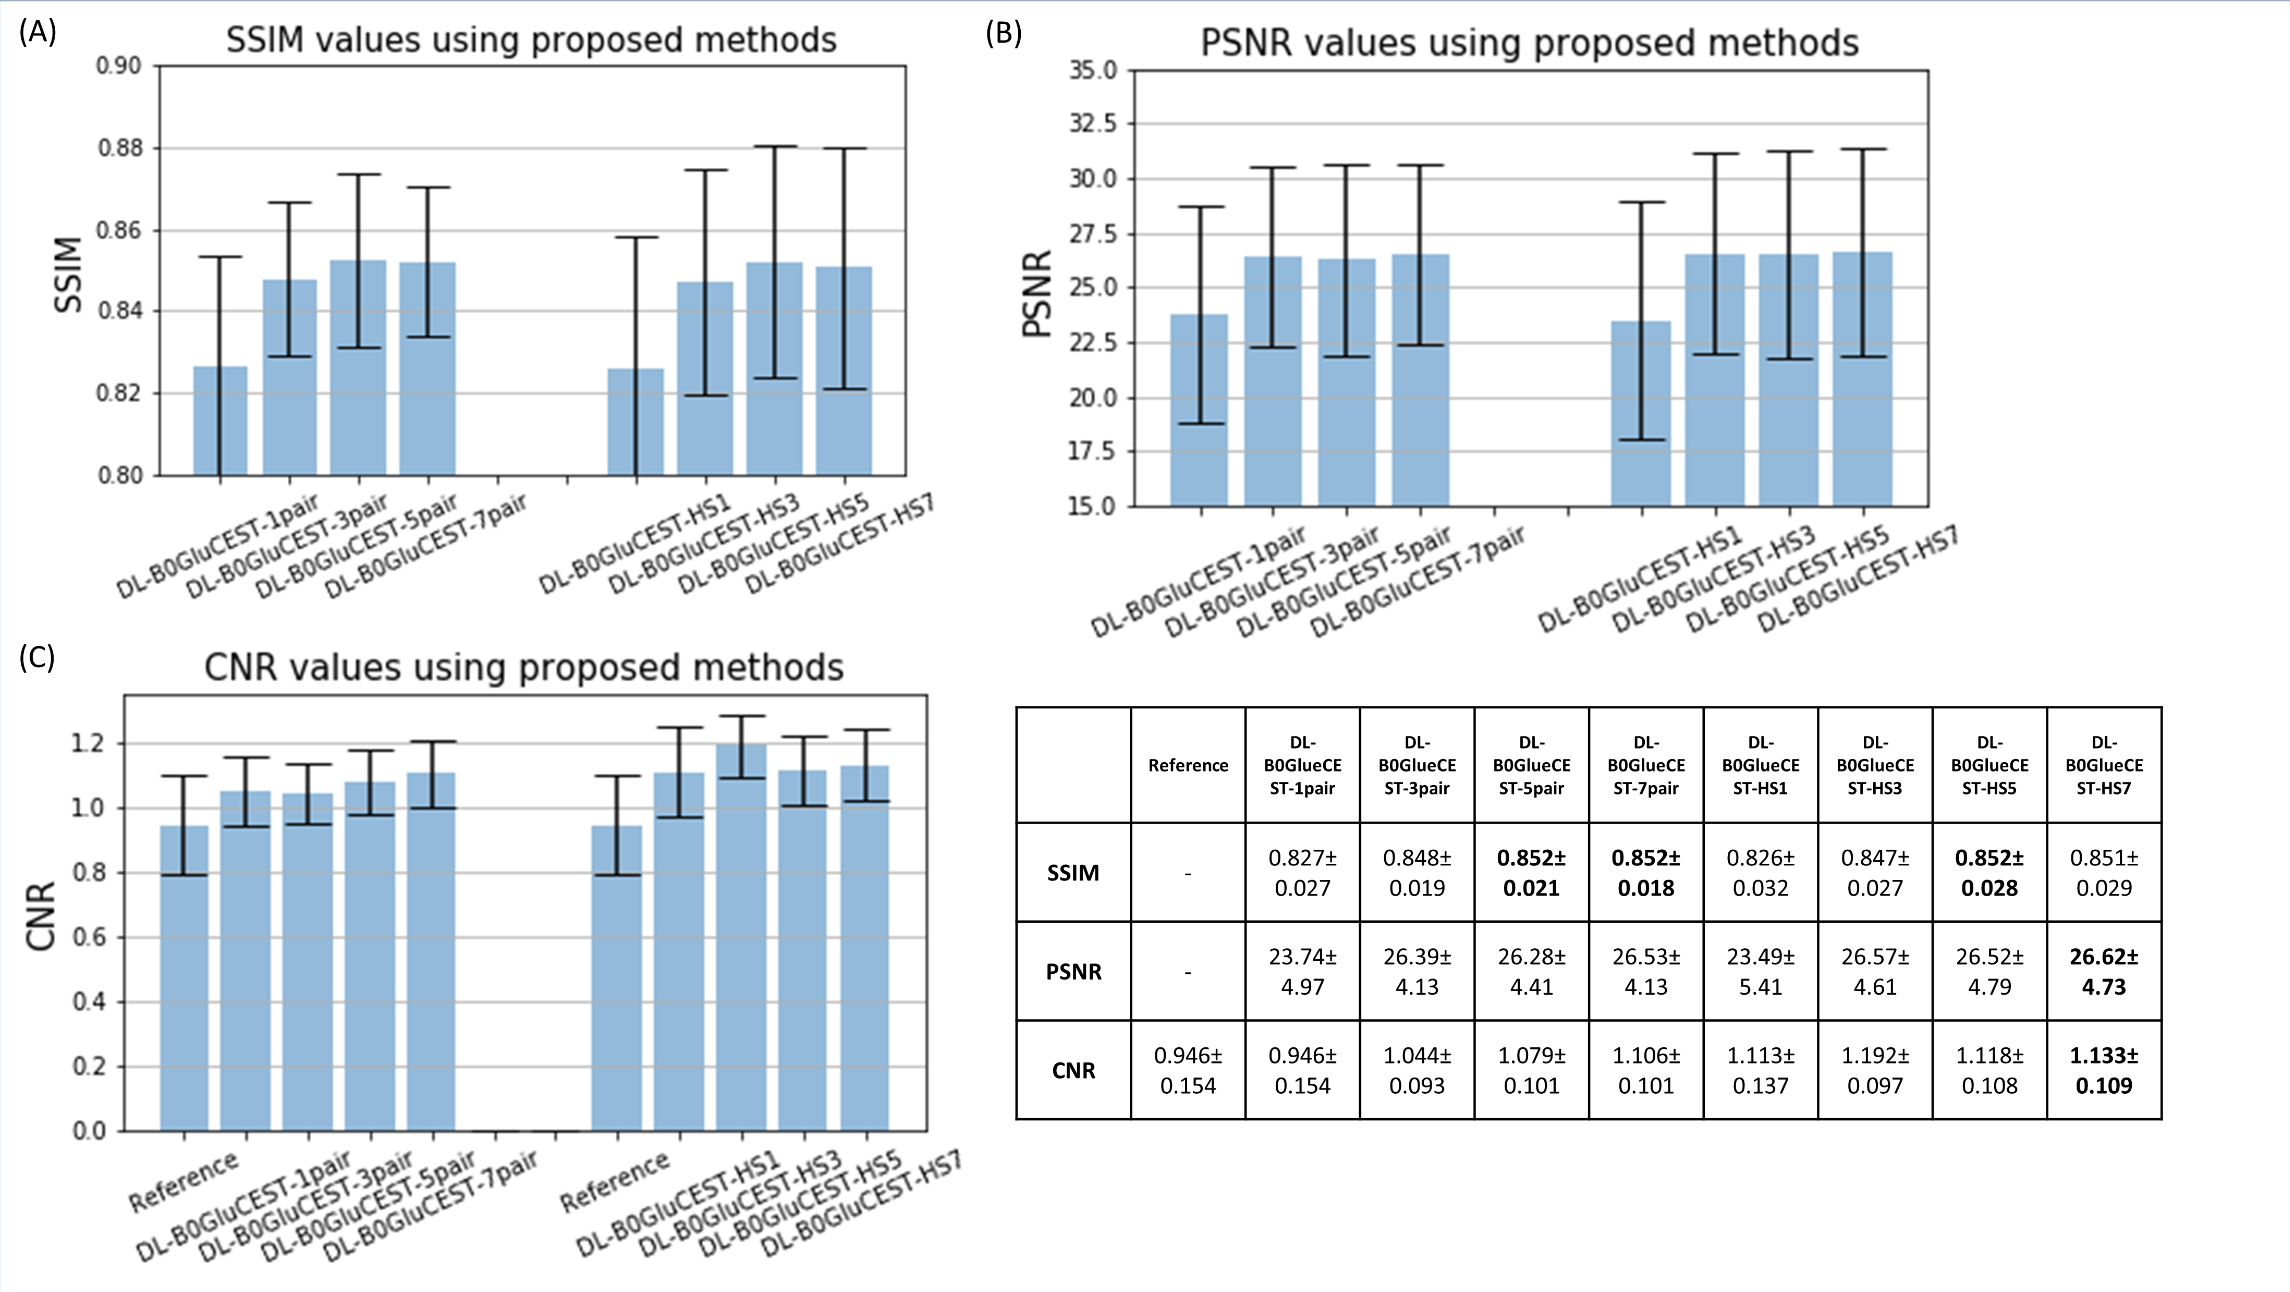
The same data published in [7] were used. 29 sets of GluCEST scans were collected from seven subjects in a 7T Siemens scanner, with twenty scans being used as training data sets and nine scans being used as the test data sets. A full z-spectrum sampling at 26 offsets along the upfield and downfield side of the z-spectrum (from ±1.8 to ±4.2 ppm with a step size of 0.2 ppm) were acquired to provide a B0 correction reference for training the DL network. The original DL based method only used 1/3/5/7 pairs of samples instead of the full set of 13 pairs [7]. However, all the samples from negative spectrum were skipped in our proposed method. Fig. 1 shows the network structure of DL-B0GlueCEST-HS (half spectrum). The input is a variable number of downfield offset images and the B0 inhomogeneity map. The same interpolation block of the original DL-B0GluCEST-pair [7] was used to get a roughly corrected saturation image to be fed into the next block for finer processing. The middleware block contains two sub-DL networks: one for predicting the z-spectrum sample at 3 ppm; the other for -3ppm. Both sub-networks used the same configuration shown in Fig. 2, which is the Wide-activation Deep Super-Resolution network (WDSR) [8]. To assess the sensitivity of DL-B0GluCEST to the number of offset acquisitions, separate experiments were performed by taking1, 3, 5, or 7 different downfield z-spectrum offset images as the input. The corresponding DL-B0GluCEST-HSs trained were named DL-B0GluCEST-HS1, 3, 5, and DL-B0GluCEST-HS7, respectively. Training reference was obtained from the full set of 26 offset images at both sides of the z-spectrum using current non-DL based B0 correction method. DL-B0GluCEST with 1, 3, 5, 7 pairs of positive and negative ppm saturation images were trained as a comparison. Method performance was measured by Structural Similarity Index Measure (SSIM), Peak Signal-to-Noise Ratio (PSNR), and Contrast-to-Noise Ratio (CNR). CNR was measured by the ratio of the subtraction between the mean value of a gray matter region-of-interest (ROI) and a white matter (WM) ROI and standard deviation of a WM ROI [9]. Higher SSIM, PSNR and CNR indicates better image reconstruction quality.Results
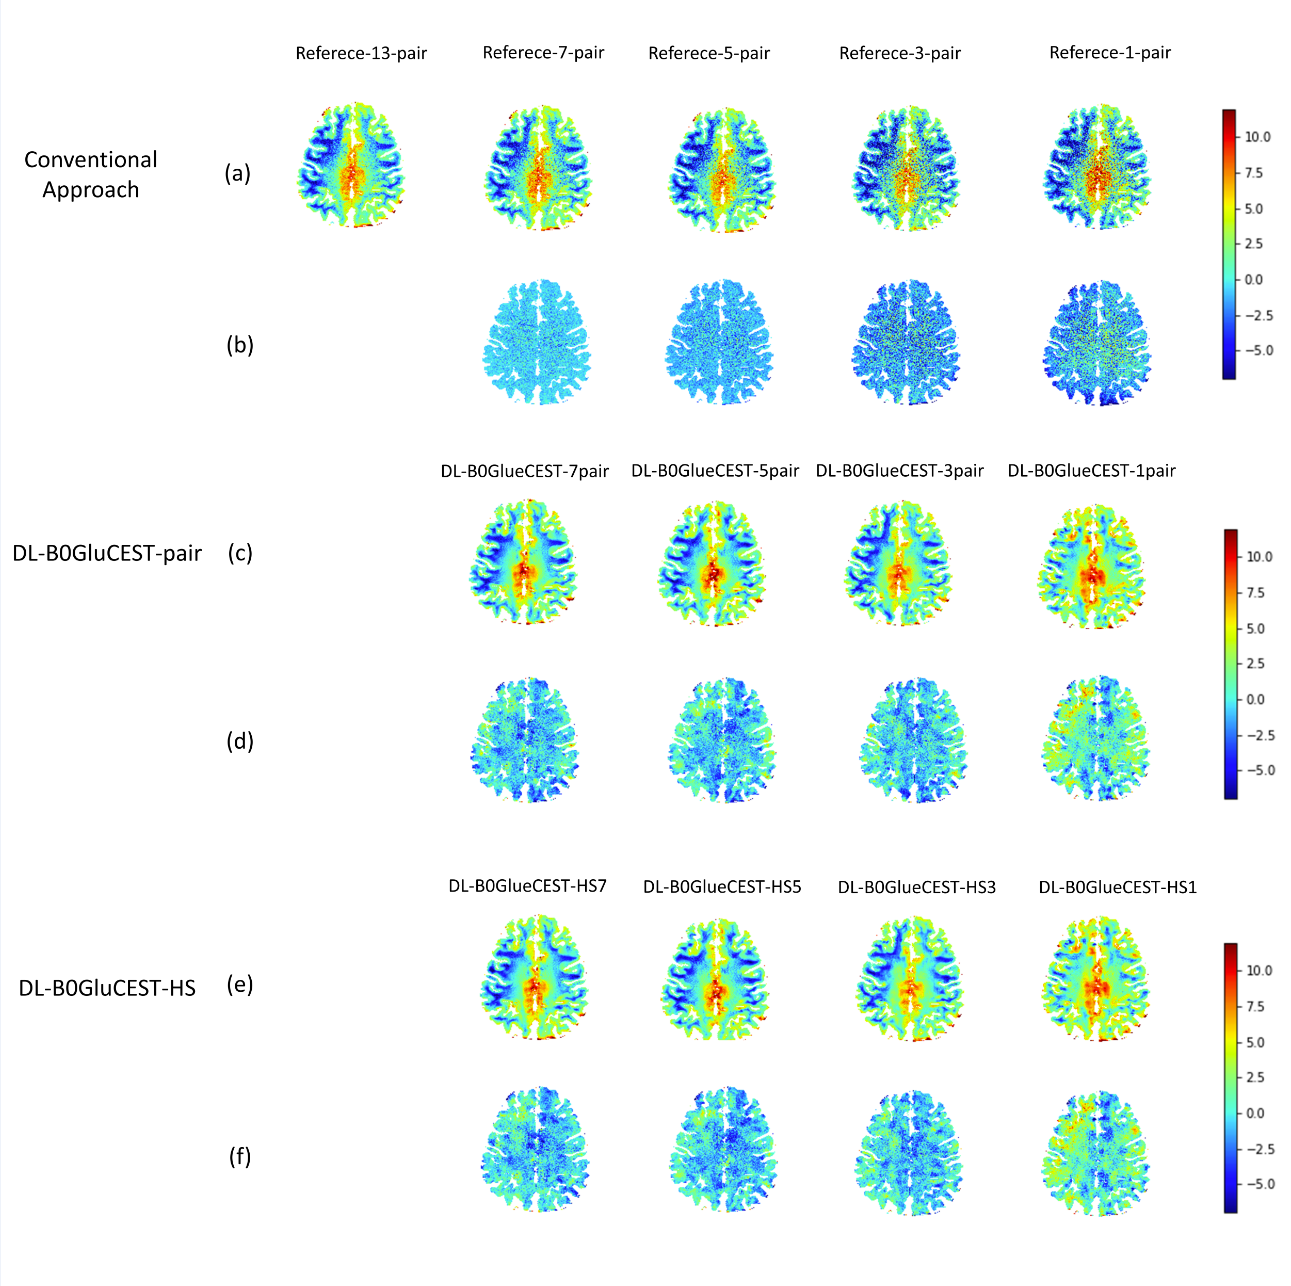
Fig 3 shows the performance indices of different methods. DL-B0GluCEST-HS1-7 performed similarly to their counterpart: DL-B0GluCEST-1-7pair (the previous B0 correction method with different pairs of positive/negative offset acquisitions), respectively. DL-B0GluCEST-HS1 showed the worst performance compared to other DL-B0GluCEST-HSs. DL-B0GluCEST-HS5 and DL-B0GluCEST-HS7 had slightly better SSIM than DL-B0GluCEST-HS3, and all DL-B0GluCEST-HSs yielded similar PSNR and CNR values. Fig 4 shows GluCEST maps from one representative subject. The results produced by traditional method [10] are used as reference. As shown in the first row, reducing z-spectrum sampling from 26 pairs to 7/5/3/1 pair positions dramatically reduced SNR of the GluCEST contrast maps generated with the traditional method. By contrast, all DL methods produced high quality results in terms of tissue structure and contrast when 3 or more offset images or 3 or more pairs of offset images were acquired.Discussion
CEST contrast is generally estimated from images acquired with opposite offset RF irradiations. Negative offset images are acquired to control the background signal due to magnetization transfer and direct water saturation; positive offset images are supposed to modulate the positive image by additional signal originated from protons of interest. Using DL, our data showed that it is possible to predict the negative offset (3ppm here for glutamate) images from the B0 inhomogeneity map and positive offset (downfield RF irradiations) images. As it is impossible to estimate an analytical model for this complex and nonlinear transform, a supervised machine learning provides an ideal solution. The use of spatial correlations among neighboring voxels during the convolutional learning in the DL network contributed to improved quantification quality.Conclusion
Based on 3 or 5 positive offset CEST images, DL-B0GluCEST-HS can save >80% of CEST imaging acquisition time as compared to current 26 pairs of double site z-spectrum irradiations based protocol. This approach can be applied to other CEST imaging as well.Acknowledgements
This project was supported by the National Institute of Biomedical Imaging and Bioengineering of the National Institute of Health under award number p41EB015893 and the National Institute of Drug Abuse of the National Institutes of Health under award number R01DA037289, and by NIH/HIA R01AG060054-01.References
1. Forsén, S., Hoffman, R.A.: Study of moderately rapid chemical exchange reactions by means of nuclear magnetic double resonance. J. Chem. Phys. 39, 2892–2901 (1963).
2. Ward, K.M., Aletras, A.H., Balaban, R.S.: A new class of contrast agents for MRI based on proton chemical exchange dependent saturation transfer (CEST). J. Magn. Reson. 143, 79–87 (2000).
3. Zhou, J., Van Zijl, P.C.: Chemical exchange saturation transfer imaging and spectroscopy. Prog. Nucl. Magn. Reson. Spectrosc. 48, 109–136 (2006).
4. Cai, K., Haris, M., Singh, A., Kogan, F., Greenberg, J.H., Hariharan, H., Detre, J.A., Reddy, R.: Magnetic resonance imaging of glutamate. Nat. Med. 18, 302–306 (2012). https://doi.org/10.1038/nm.2615.
5. Kim, M., Gillen, J., Landman, B.A., Zhou, J., Van Zijl, P.C.M.: Water saturation shift referencing (WASSR) for chemical exchange saturation transfer (CEST) experiments. Magn. Reson. Med. An Off. J. Int. Soc. Magn.Reson. Med. 61, 1441–1450 (2009).
6. Sun, P.Z., Farrar, C.T., Sorensen, A.G.: Correction for artifacts induced by B0 and B1 field inhomogeneities in pH-sensitive chemical exchange saturation transfer (CEST) imaging. Magn. Reson. Med. An Off. J. Int. Soc. Magn. Reson. Med. 58, 1207–1215 (2007).
7. Li, Yiran, Danfeng Xie, Abigail Cember, Ravi Prakash Reddy Nanga, Hanlu Yang, Dushyant Kumar, Hari Hariharan et al. "Accelerating GluCEST imaging using deep learning for B0 correction." Magnetic Resonance in Medicine (2020).
8. Yu, J., Fan, Y., Yang, J., Xu, N., Wang, Z., Wang, X., Huang, T.: Wide activation for efficient and accurate image super-resolution. arXiv Prepr.arXiv1808.08718. (2018).
9. Welvaert, Marijke, and Yves Rosseel. "On the definition of signal-to-noise ratio and contrast-to-noise ratio for fMRI data." PloS one 8, no. 11 (2013): e77089.
10. Nanga, R.P.R., DeBrosse, C., Kumar, D., Roalf, D., McGeehan, B., D’Aquilla, K., Borthakur, A., Hariharan, H., Reddy, D., Elliott, M., Detre, J.A., Epperson, C.N., Reddy, R.: Reproducibility of 2D GluCEST in healthy human volunteers at 7 T. Magn. Reson. Med. (2018).
Figures