0147
Diffusion-weighted Chemical Exchange Saturation Transfer Imaging at 7T Human MRI1Department of Bio and Brain engineering, Korea Advanced Institute of Science and Technology, Daejeon, Korea, Republic of, 2Department of Global Biomedical Engineering, Sungkyunkwan University, Suwon, Korea, Republic of
Synopsis
CEST is a useful method to diagnose tumor or stroke, but lacks physical information such as compartments with different diffusivities. In this study, we developed a new diffusion-weighted steady-state CEST sequence using 3D EPI at 7T. The technique was tested in phantom and human brain, and the preliminary CEST-weighted apparent diffusion coefficient maps provided both CEST and diffusion information. Further study is required to clearly understand the signal source and the potential as a new biomarker.
Introduction
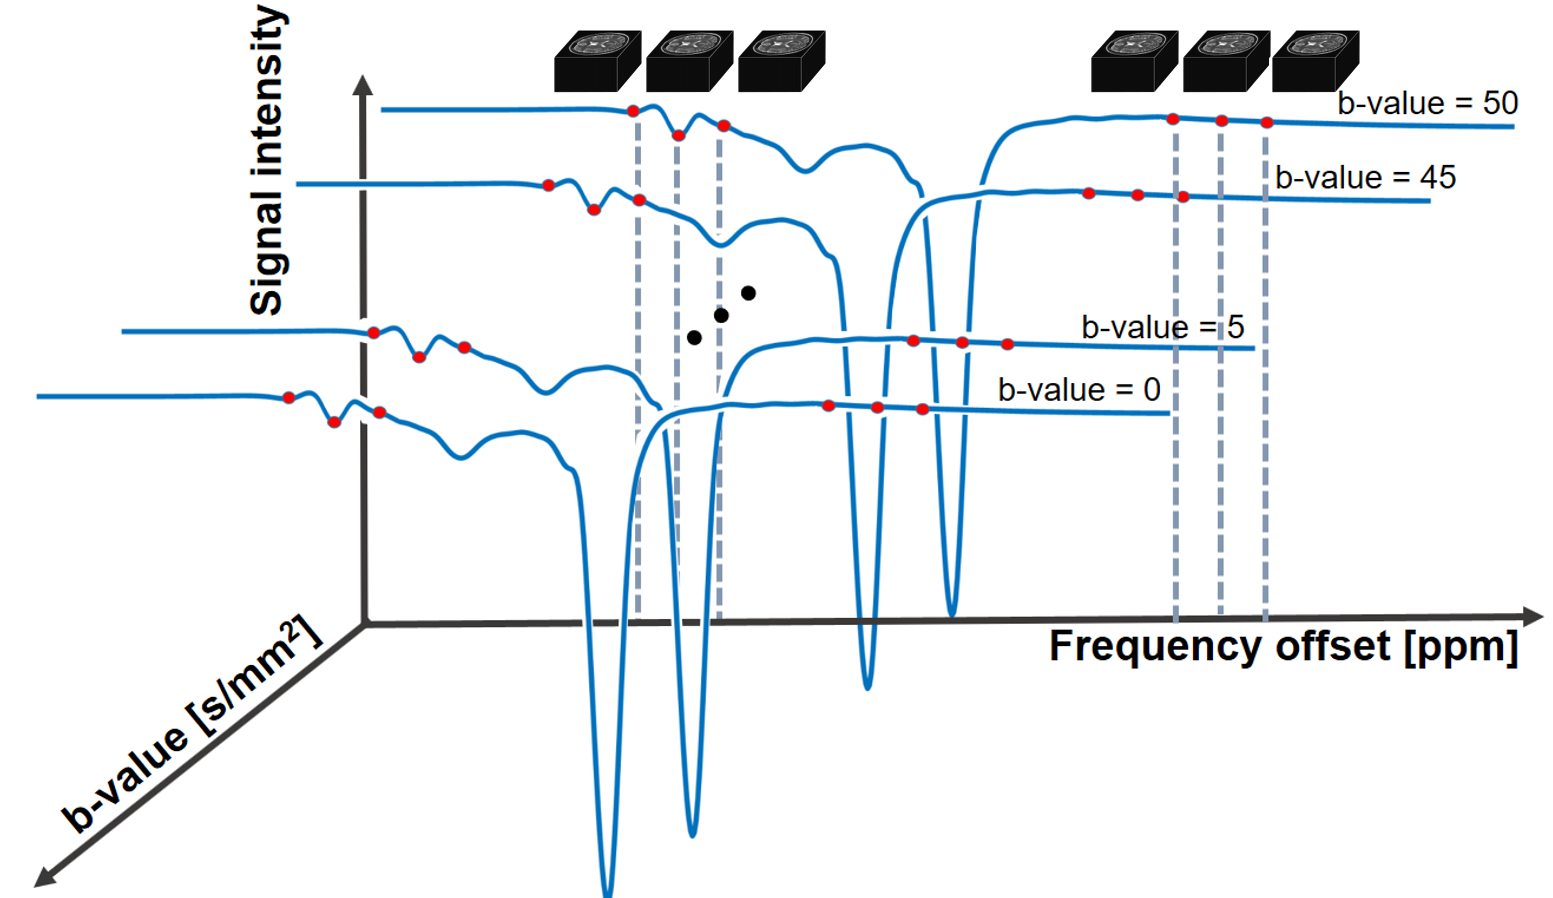
Chemical exchange saturation transfer (CEST) MRI is a molecular imaging technique proven to be useful for diagnosis of tumor or stroke. It has high sensitivity, but lacks physical information such as compartments with different diffusivity. In this study, we propose a new diffusion-weighted CEST technique at 7T to obtain a map that contains both CEST and diffusion information (Fig.1). We expect this could provide us with more information on proton exchange between freely moving proteins and free water in different physical compartments. The preliminary phantom and in vivo results show CEST-weighted apparent diffusion coefficient (ADC) maps for the first time to our knowledge.Methods
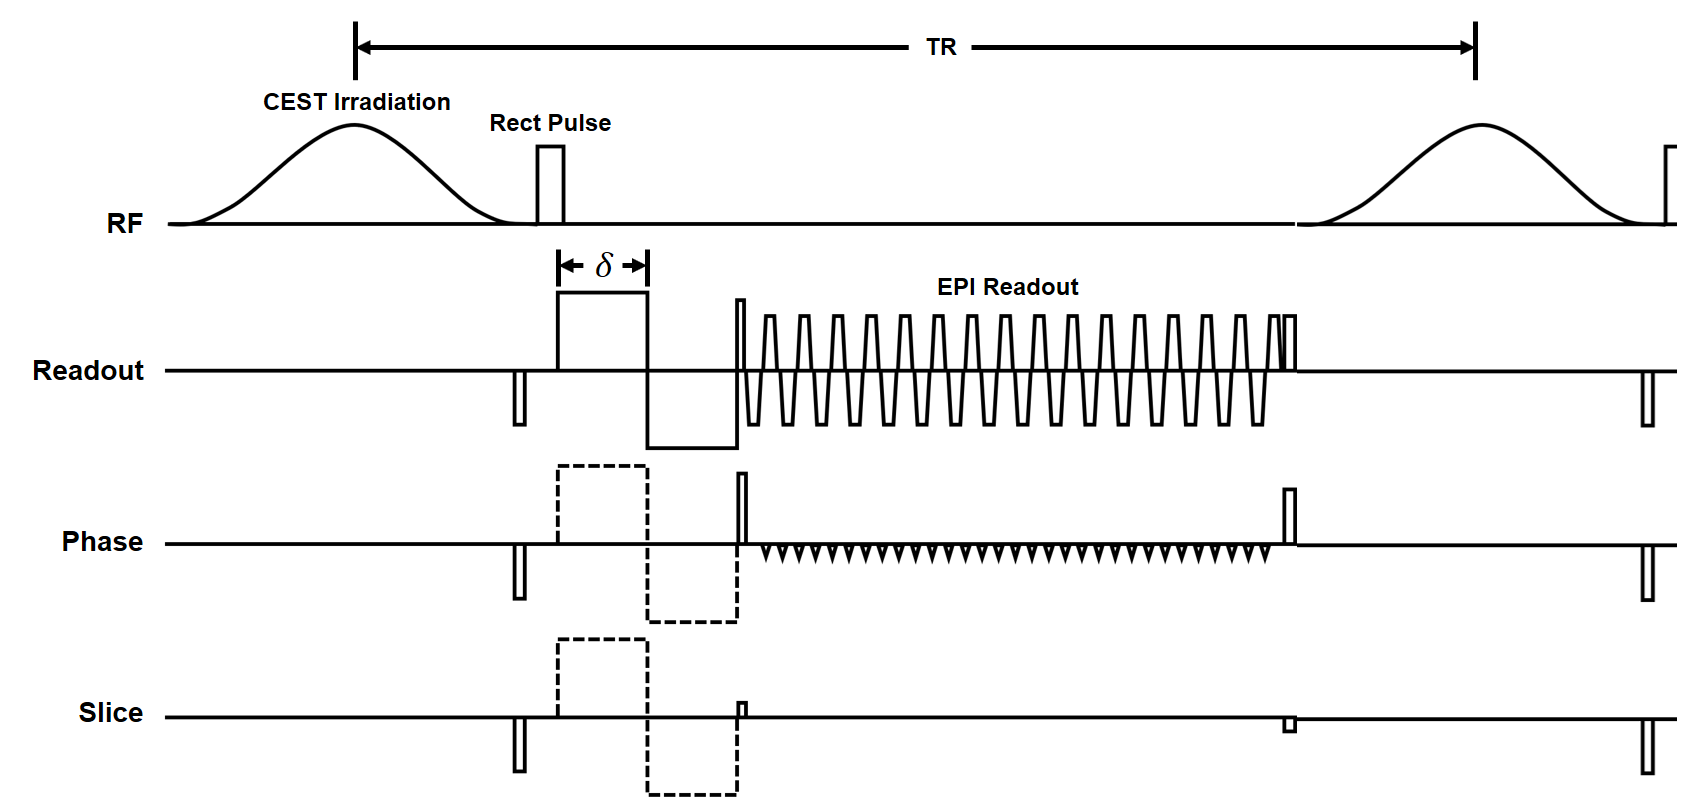
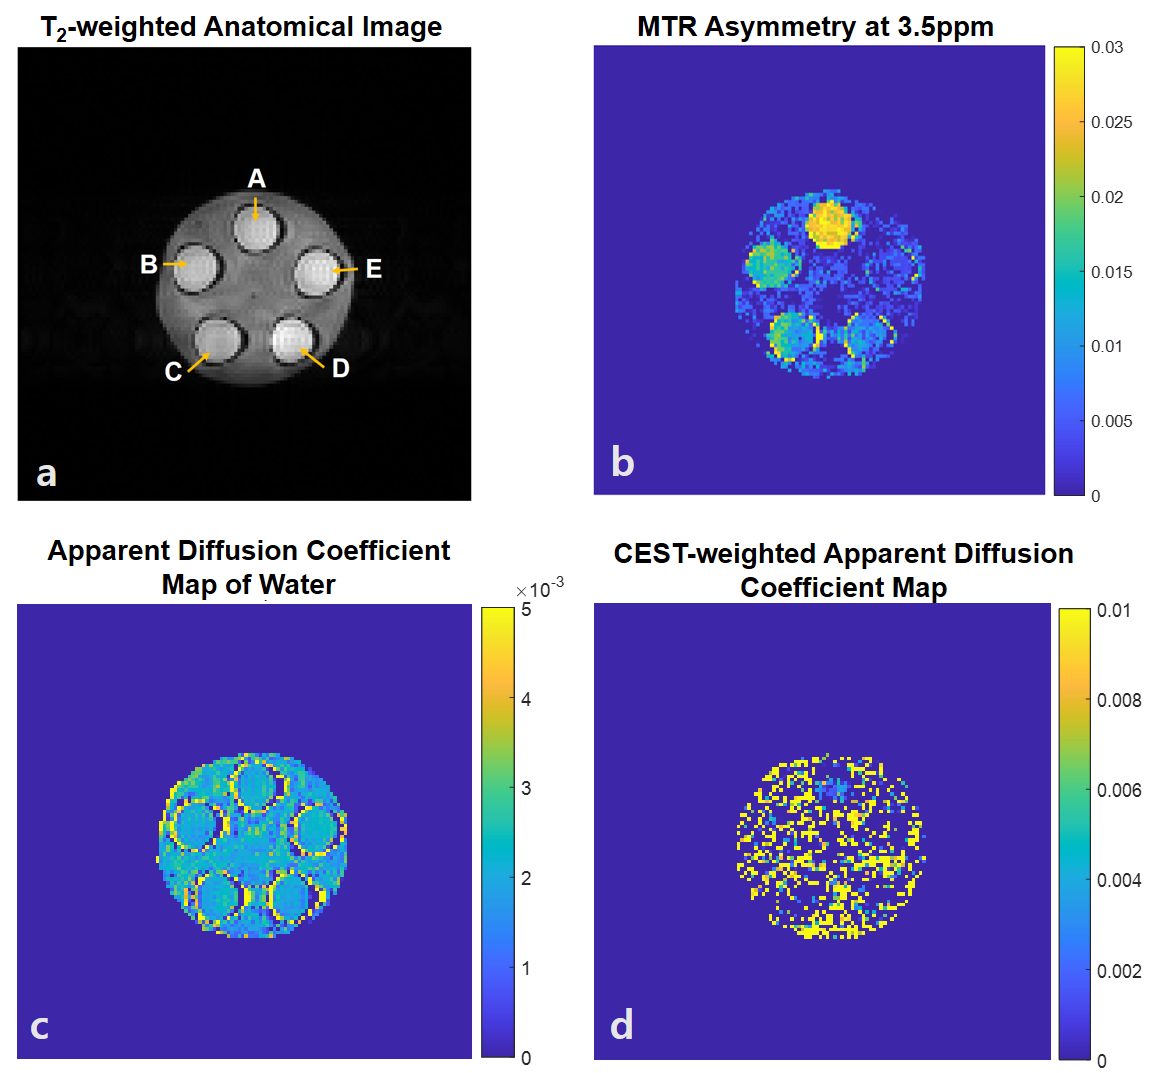
(Pulse sequence) The whole-brain 3D steady-state diffusion-weighted CEST MRI was used with a fat-suppressed excitation pulse, bipolar diffusion gradients in three orthogonal directions and rapid 3D multi-shot EPI imaging (Fig.2).1(Data Acquisition) All experiments were performed on a 7T MRI (Magnetom, Siemens, Erlangen) with a 32-ch head coil. The data were acquired on a phantom containing agarose and five tubes with amides and creatine in different concentrations (Fig.3a) and on one human subject. APT images were acquired at six frequency offsets of ±3, ±3.5, and ±4ppm with 11 b-values of 0, 5, ... 45, 50 s/mm2.2 Acquisition parameters for the phantom are TR/TE = 95/33ms , flip angle = 18º , matrix size = 128x128 , filed of view = 230x230mm2, slice thickness = 5mm, number of slices = 22 , CEST RF = 0.6uT, EPI segments = 4, diffusion gradient duration (δ) = 8.15ms , diffusion gradients = 0-40mT/m in three orthogonal directions, and number of averages = 2. In vivo imaging parameters involve less number of b-values (0, 10, 25 and 50) and the diffusion gradients were applied on readout direction only.
(CEST Processing) B0 correction was performed using WASSR technique.3 MTR asymmetry was used to calculate CEST signals.
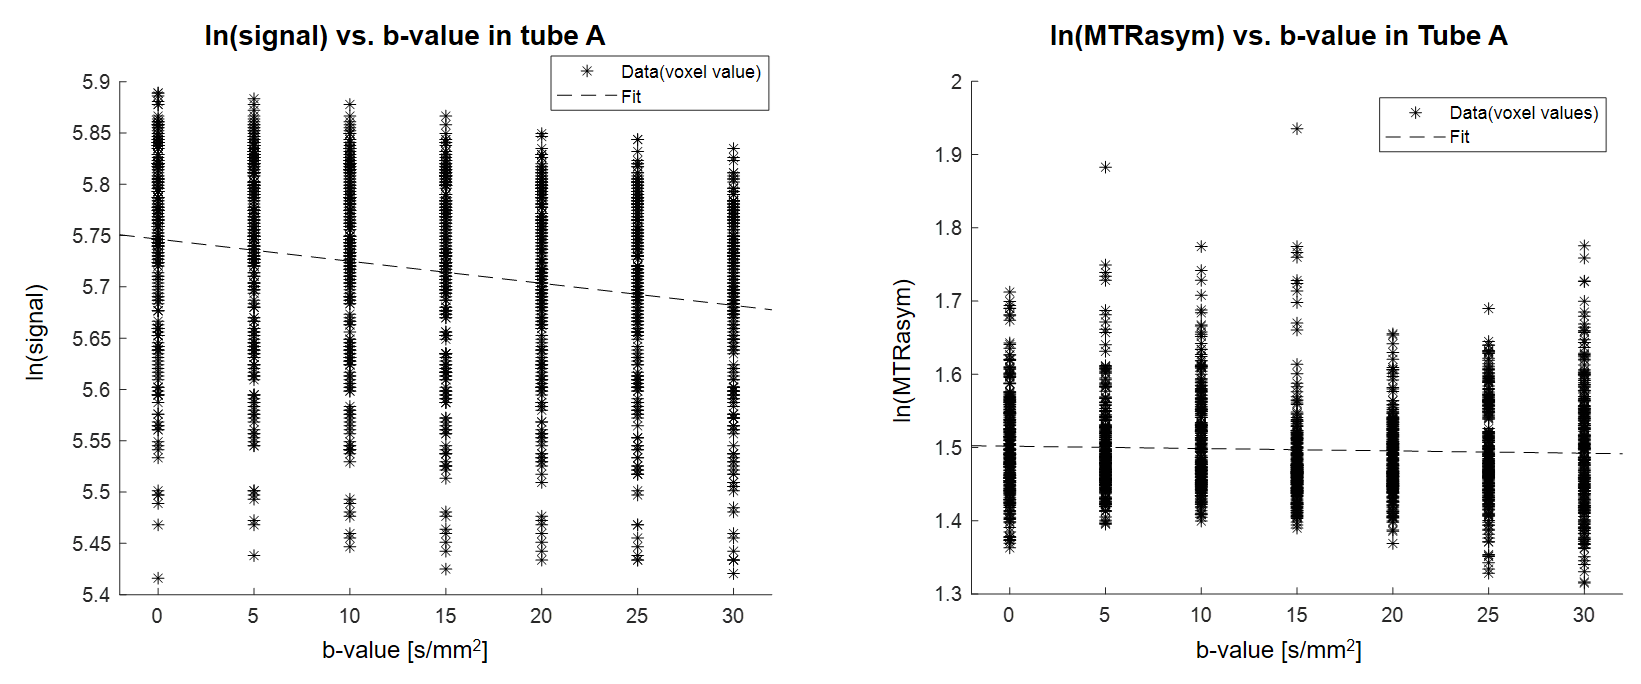
(Statistical Diffusion Analysis) The conventional ADC method was not applied due to intrinsically low CEST signal with diffusion. Rather diffusion coefficients were estimated using a linear regression method, under the assumption that the CEST signal exponentially decreases as b-value increases. The acquired data were log scaled and plotted as regressors where the b-value was the independent variable (eq(2)). The corresponding slope was inversed in sign to obtain ADC values (eq(2) & (3)). Both water and CEST-weighted diffusion coefficients were calculated using the linear regression results to validate the method based on the following equations.
\[S_{b}=S_{0}e^{-bD} \cdot\cdot\cdot\ Eq. (1)\]
\[lnS_{b}=lnS_{0}{-bD} \cdot\cdot\cdot\ Eq. (2)\]
\[Y=\beta_{0}+\beta_{1}X \cdot\cdot\cdot\ Eq. (3)\]
where Sb= signal at a specific b-value, S0= signal at b-value=0, D = diffusion coefficient, Y = dependent variable of linear regression, X = independent variable, β0 = intercept and β1 = slope.
Results
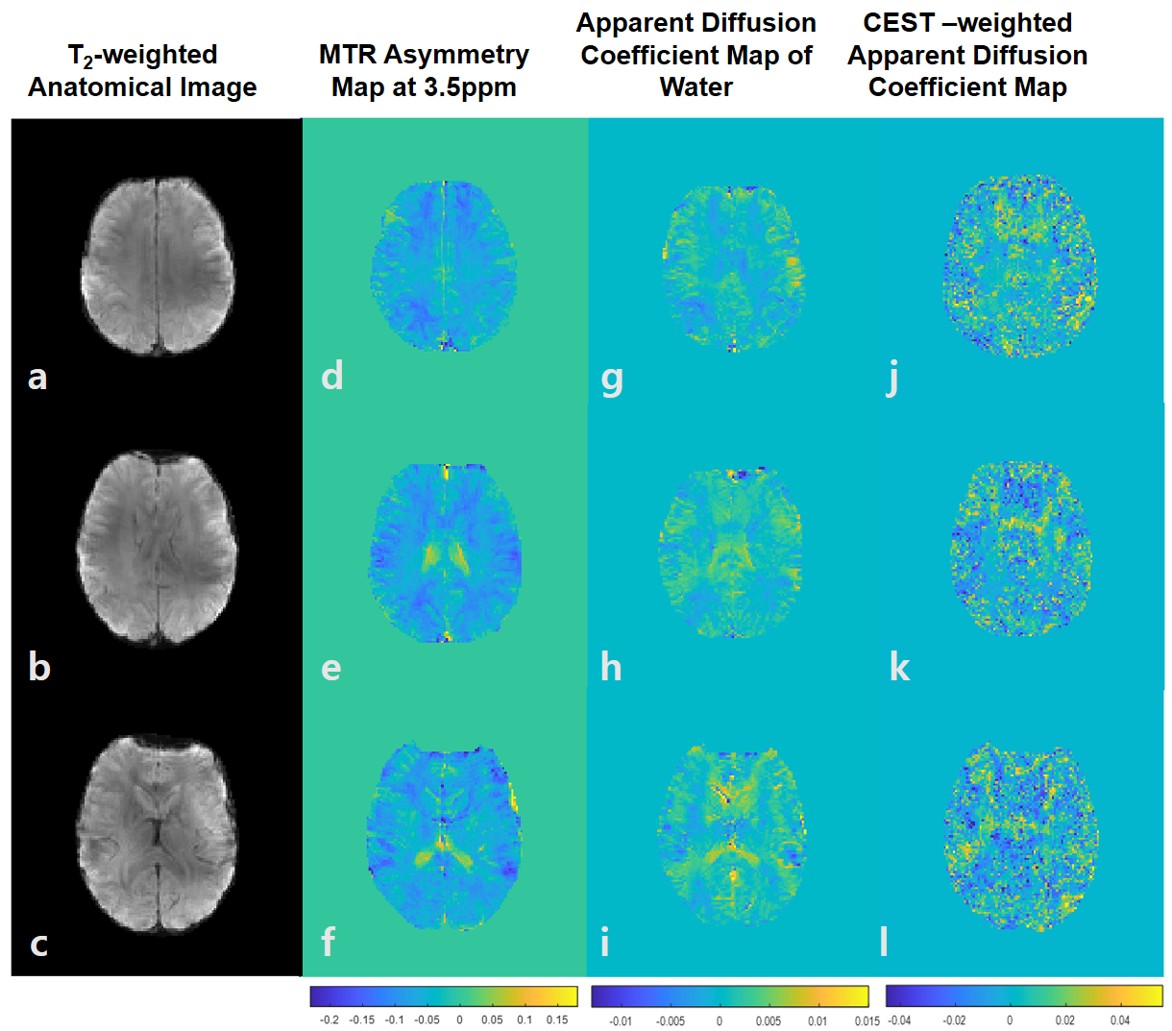
(Phantom) The MTR asymmetry map at 3.5ppm demonstrated the amide proton transfer (APT) CEST signals, which were proportional to the concentration of amides (Fig.3b). In contrast to the homogeneous diffusion coefficients of free water across the phantom (Fig.3c), APT-weighted ADC was higher in tubes with higher amide concentration. Agarose has CEST values close to zero and could be considered as noise in this map (Fig.3d), due to its high p-value and variance and low R2 compared to those of tube A. Moreover, linear regression was done across voxels in a region of interest in tube A (Fig.4). The slope was negative since the water exponentially decays as b-value increased. The diffusion coefficient calculated as the inverse of slope, was around 0.002 mm2/s (Fig.4a). The CEST-weighted diffusion coefficient was around 0.0003 mm2/s (Fig.4b).(In vivo) The ADC maps were shown in three axial slices (Fig.5a, b, c). The MTR asymmetry maps at 3.5ppm showed amide proton exchange distribution in a human brain with higher signals in gray matter than in white matter (Fig.5d, e, f). ADC of water was 0.001 mm2/s on average across the slices (Fig.5g, h, i). The CEST-weighted ADC maps distinguished the white matter tracks from gray matter tissues with higher ADC values in white matter than in gray matter in general (Fig.5j, k, l), opposite to the CEST maps with no diffusion weighting and different from ADC maps from the free water signals.
Discussion & Conclusion
In this study, we demonstrate feasibility of diffusion-weighted CEST imaging at 7T human MRI for the first time to our knowlege. This technique produced ADC maps based on CEST signals as well as free water signals in a relatively high sensitivity and high spatial resolutions. This study is different than diffusion weighted spectroscopy4, in that the proposed diffusion-weighted CEST merely measures diffusion coefficient of water, instead of diffusivity of metabolites.This preliminary human brain results may be expanded with a higher maximum b-value (>300) to account for intravoxel incoherent motion (IVIM) effect and with a full z-spectrum to reduce NOE artifacts in brain. The proposed technique may be assessed using the IVIM approach to distinguish the CEST signals inside and outside blood microcirculation. Further studies are necessary to understand the source of the diffusion-weighted CEST signals in general, which may allow us to understand human brain metabolites in a new perspective.
Acknowledgements
No acknowledgement found.References
1. Lee, H, Choi, SH, Sohn, C‐H, Kim, S‐G, Lee, J, Park, J. Rapid three‐dimensional steady‐state chemical exchange saturation transfer magnetic resonance imaging. Magn Reson Med. 2020; 00: 1– 13. https://doi.org/10.1002/mrm.28487
2. Zhou, J., Blakeley, J.O., Hua, J., Kim, M., Laterra, J., Pomper, M.G. and van Zijl, P.C. (2008), Practical data acquisition method for human brain tumor amide proton transfer (APT) imaging. Magn. Reson. Med., 60: 842-849. https://doi.org/10.1002/mrm.21712
3. Kim, M., Gillen, J., Landman, B.A., Zhou, J. and van Zijl, P.C. (2009), Water saturation shift referencing (WASSR) for chemical exchange saturation transfer (CEST) experiments. Magn. Reson. Med., 61: 1441-1450. https://doi.org/10.1002/mrm.21873
4. Najac, C., Branzoli, F., Ronen, I., & Valette, J. (2016). Brain intracellular metabolites are freely diffusing along cell fibers in grey and white matter, as measured by diffusion-weighted MR spectroscopy in the human brain at 7 T. Brain structure & function, 221(3), 1245–1254. https://doi.org/10.1007/s00429-014-0968-5
Figures