0145
Elucidating the compartmental origin of glucoCEST signal using glucose analogues1Université Paris-Saclay, Commissariat à l’Energie Atomique et aux Energies Alternatives (CEA), Centre National de la Recherche Scientifique (CNRS), Molecular Imaging Research Center (MIRCen), Laboratoire des Maladies Neurodégénératives, Fontenay-aux-Roses, France
Synopsis
The compartmental origin of glucoCEST signal is still an ongoing debate. To address this crucial question, we proposed in this study to intravenously inject natural D-glucose and several metabolizable and non-metabolizable glucose analogues to compare their relative glucoCEST signal kinetics. The accurate measurements of glucoCEST signal kinetics provided deeper insights into the origin of glucoCEST signal and constitute a major step toward quantitative measurement of glucose metabolism using CEST imaging method. This could provide a new non-invasive tool to study brain energy metabolism defects observed in numerous neurodegenerative disorders.
Purpose
CEST detection of glucose, which is tightly coupled to energy metabolism, could offer a good alternative to 18F-FDG PET1,2, with possibly higher spatial resolution. However, contrary to PET where signal arises from intracellular accumulation of radioactive tracer, the compartmental origin of glucoCEST signal remains an open debate, which must be urgently addressed. Indeed, glucoCEST signal may potentially arise from 3 different compartments i.e. vascular, extravascular/extracellular and intracellular (Fig.1). Even if several results argue in favor of the intracellular origin of CEST contrast, some other works primarily concluded on its extracellular origin3 or both1,4,5, as well as non-negligible contribution from the vascular compartment6. To answer this question, we used four different molecules (Fig.1); i) natural D-glucose (D-Glc); ii) L-glucose (L-Glc), which does not cross the blood-brain barrier (BBB); iii) 3-O-methyl-D-glucose (3OMG), transported by the GLUTs but not phosphorylated by the hexokinase; iv) 2-deoxy-D-glucose (2DG), taken up by cells through GLUTs transporter and phosphorylated into 2DG-6-phospate (2DG6P) by hexokinase but not further metabolized. We reported for the first time kinetics of glucoCEST signal with a high temporal resolution for four different glucose analogues, providing unprecedented insights into the origin of glucoCEST signal.Materials & Methods
GlucoCEST sequence: a spectroscopic approach based on fully adiabatic LASER localization preceded by a CEST module consisting in a frequency-selective continuous wave pulse (Tsat=4 s, B1=2 µT) was used to maximize detection sensitivity. Acquisitions were performed on a horizontal 11.7 T Bruker magnet using volume coil in transmission and a quadrature surface coil in reception.Phantom acquisition: Solutions of 50 mM of D-Glc, 3OMG and 2DG were used to assess the resonances arising from their different hydroxyl groups and to compare their relative intensities.
Animal acquisition: Healthy rats under isoflurane anaesthesia (1.5 %) were injected intravenously (1 g/kg in 8 min) with a 20 % w/w solution of either D-Glc (n=5), L-Glc (n=3), 3OMG (n=9) or 2DG (n=7). GlucoCEST Z-spectra were acquired in the left striatum (2.5x2.5x2.5 mm3) in 1.5 min with saturation offsets applied at δsat=-20, ± 2.9, ± 2.1, ± 1.2 and ± 0.8 ppm.
Results
MTRasym curves acquired in phantoms exhibited 4 peaks of interest centered at 0.8, 1.2, 2.1 and 2.9 ppm (Fig.2A). Interestingly, all analogues exhibited almost the same CEST effect at 2.9 ppm (Fig.2B), corresponding to the α-configuration of the anomeric form of the molecule. Except with L-Glc where no variation was observed (Fig.3B), increases of glucoCEST signal were measured at 1.2, 2.1 and 2.9 ppm with all other glucose analogues. No variation, or just a very small one with 2DG, was observed at 0.8 ppm, probably due to the poor sensitivity of the method close to water resonance frequency (Fig.3D). While glucoCEST signal increase following D-Glc injection was relatively slow (Fig.3A), increases after 3OMG and 2DG injections were sharper, right after the beginning of injection (Fig.3C and D respectively). Interestingly, 3OMG glucoCEST signal was plateauing 20 min after injection (ΔMTRasym ≈ 1 %) whereas 2DG injection led to stronger glucoCEST signal increase (ΔMTRasym ≈ 2 %) before returning to baseline.Discussion and conclusion
No variation of glucoCEST signal was observed after L-Glc injection contrarily to D-Glc. As L-Glc is not transported through the BBB, this showed that the vascular compartment does not contribute to the glucoCEST signal. A marked difference was observed after D-Glc and 3OMG injection. While 3OMG is transported with the same GLUTs transporters as D-Glc with a comparable affinity7 , glucoCEST signal uptake after 3OMG was sharper and remained stable 1.5 h after injection. 3OMG is a non-metabolizable analogue, therefore accumulating in the intracellular compartment. However, the signal is plateauing probably because intracellular concentration cannot increase indefinitely because of the osmotic pressure. Interestingly, we would have expected a decrease of glucoCEST signal after D-Glc injection, assuming that it would be quickly metabolized by cells. However, recent studies unambiguously demonstrated uptake and clearance of D-Glc in both brain parenchyma and cerebrospinal fluid through glymphatic system8, which may be why we observe steady glucoCEST signal for D-Glc. Thus, glucoCEST signal after D-Glc injection may arise from both extracellular/extravascular and intracellular spaces. Finally, the highest uptake of glucoCEST signal following 2DG injection argues in favour of an intracellular origin. While CEST effects measured in phantoms exhibited similar intensities among all glucose analogues at 2.9 ppm (Fig.2B), increase after 2DG injection was twice as large as with the other analogues, probably because 2DG was converted by hexokinase into 2DG6P. Surprisingly, decrease of glucoCEST contrast observed ~60 min after 2DG injection would suggest 2DG and 2DG6P degradation or washout. Even if we cannot unambiguously explain such decrease, similar effect has already been reported and could correspond to degradation of 2DG6P through pentose phosphate pathway2, glycogen conversion9,10, further metabolism in 2DG-1-P and 2DG-1,6-P11 or passive washout due to osmotic pressure.The use of glucose analogues helped clarifying which compartments mostly contributed to the glucoCEST signal. This work illustrates the potential of glucoCEST MRI to study brain energy metabolism and how this approach could allow distinguishing between transport and use of glucose or its analogues. This information is crucial to study metabolism and especially to study energy metabolism defects in neurodegenerative diseases.
Acknowledgements
This work was supported by a grant from Agence Nationale pour la Recherche (“nrjCEST” project, ANR-18-CE19-0014-01). The 11.7 T scanner was funded by a grant from NeurATRIS: A Translational Research Infrastructure for Biotherapies in Neurosciences (“Investissements d'Avenir”, ANR-11-INBS-0011).References
1. Walker-Samuel, S., et al., In vivo imaging of glucose uptake and metabolism in tumors. Nat Med, 2013. 19(8): p. 1067-72.2. Nasrallah, F.A., et al., Imaging brain deoxyglucose uptake and metabolism by glucoCEST MRI. J Cereb Blood Flow Metab, 2013. 33(8): p. 1270-8.
3. Chan, K.W., et al., Natural D-glucose as a biodegradable MRI contrast agent for detecting cancer. Magn Reson Med, 2012. 68(6): p. 1764-73.
4. Jin, T., et al., Mapping brain glucose uptake with chemical exchange-sensitive spin-lock magnetic resonance imaging. J Cereb Blood Flow Metab, 2014. 34(8): p. 1402-10.
5. Knutsson, Linda et al. Arterial Input Functions and Tissue Response Curves in Dynamic Glucose-Enhanced (DGE) Imaging: Comparison Between glucoCEST and Blood Glucose Sampling in Humans. Tomography (Ann Arbor, Mich.) vol. 4,4 (2018): 164-171.
6. Xu, Xiang et al., GlucoCEST imaging with on-resonance variable delay multiple pulse (onVDMP) MRI. Magnetic resonance in medicine vol. 81,1 (2019): 47-56.
7. Jay TM et al, Metabolic stability of 3-O-methyl-D-glucose in brain and other tissues. Journal of neurochemistry. 1990 Sep;55(3):989-1000.
8. Huang et al., Altered d-glucose in brain parenchyma and cerebrospinal fluid of early Alzheimer’s disease detected by dynamic glucose-enhanced MRI. Science Advances 13 May 2020:Vol. 6, no. 20
9. Southworth R et al., Tissue-specific differences in2-fluoro-2-deoxyglucose metabolism beyond FDG-6-P: a 19F NMR spectroscopy study in the rat. NMR Biomed 2003; 16: 494–502.
10. Nelson et al., 2‐Deoxyglucose incorporation into rat brain glycogen during measurement of local cerebral glucose utilization by the 2‐deoxyglucose method. Journal of neurochemistry 1984.43(4):949-956.
11. Dienel G et al., Metabolites of 2-deoxy-[14C]glucose in plasma and brain: influence on rate of glucose utilization determined with deoxyglucose method in rat brain. J Cereb Blood Flow Metab 1993; 13: 315–327
Figures
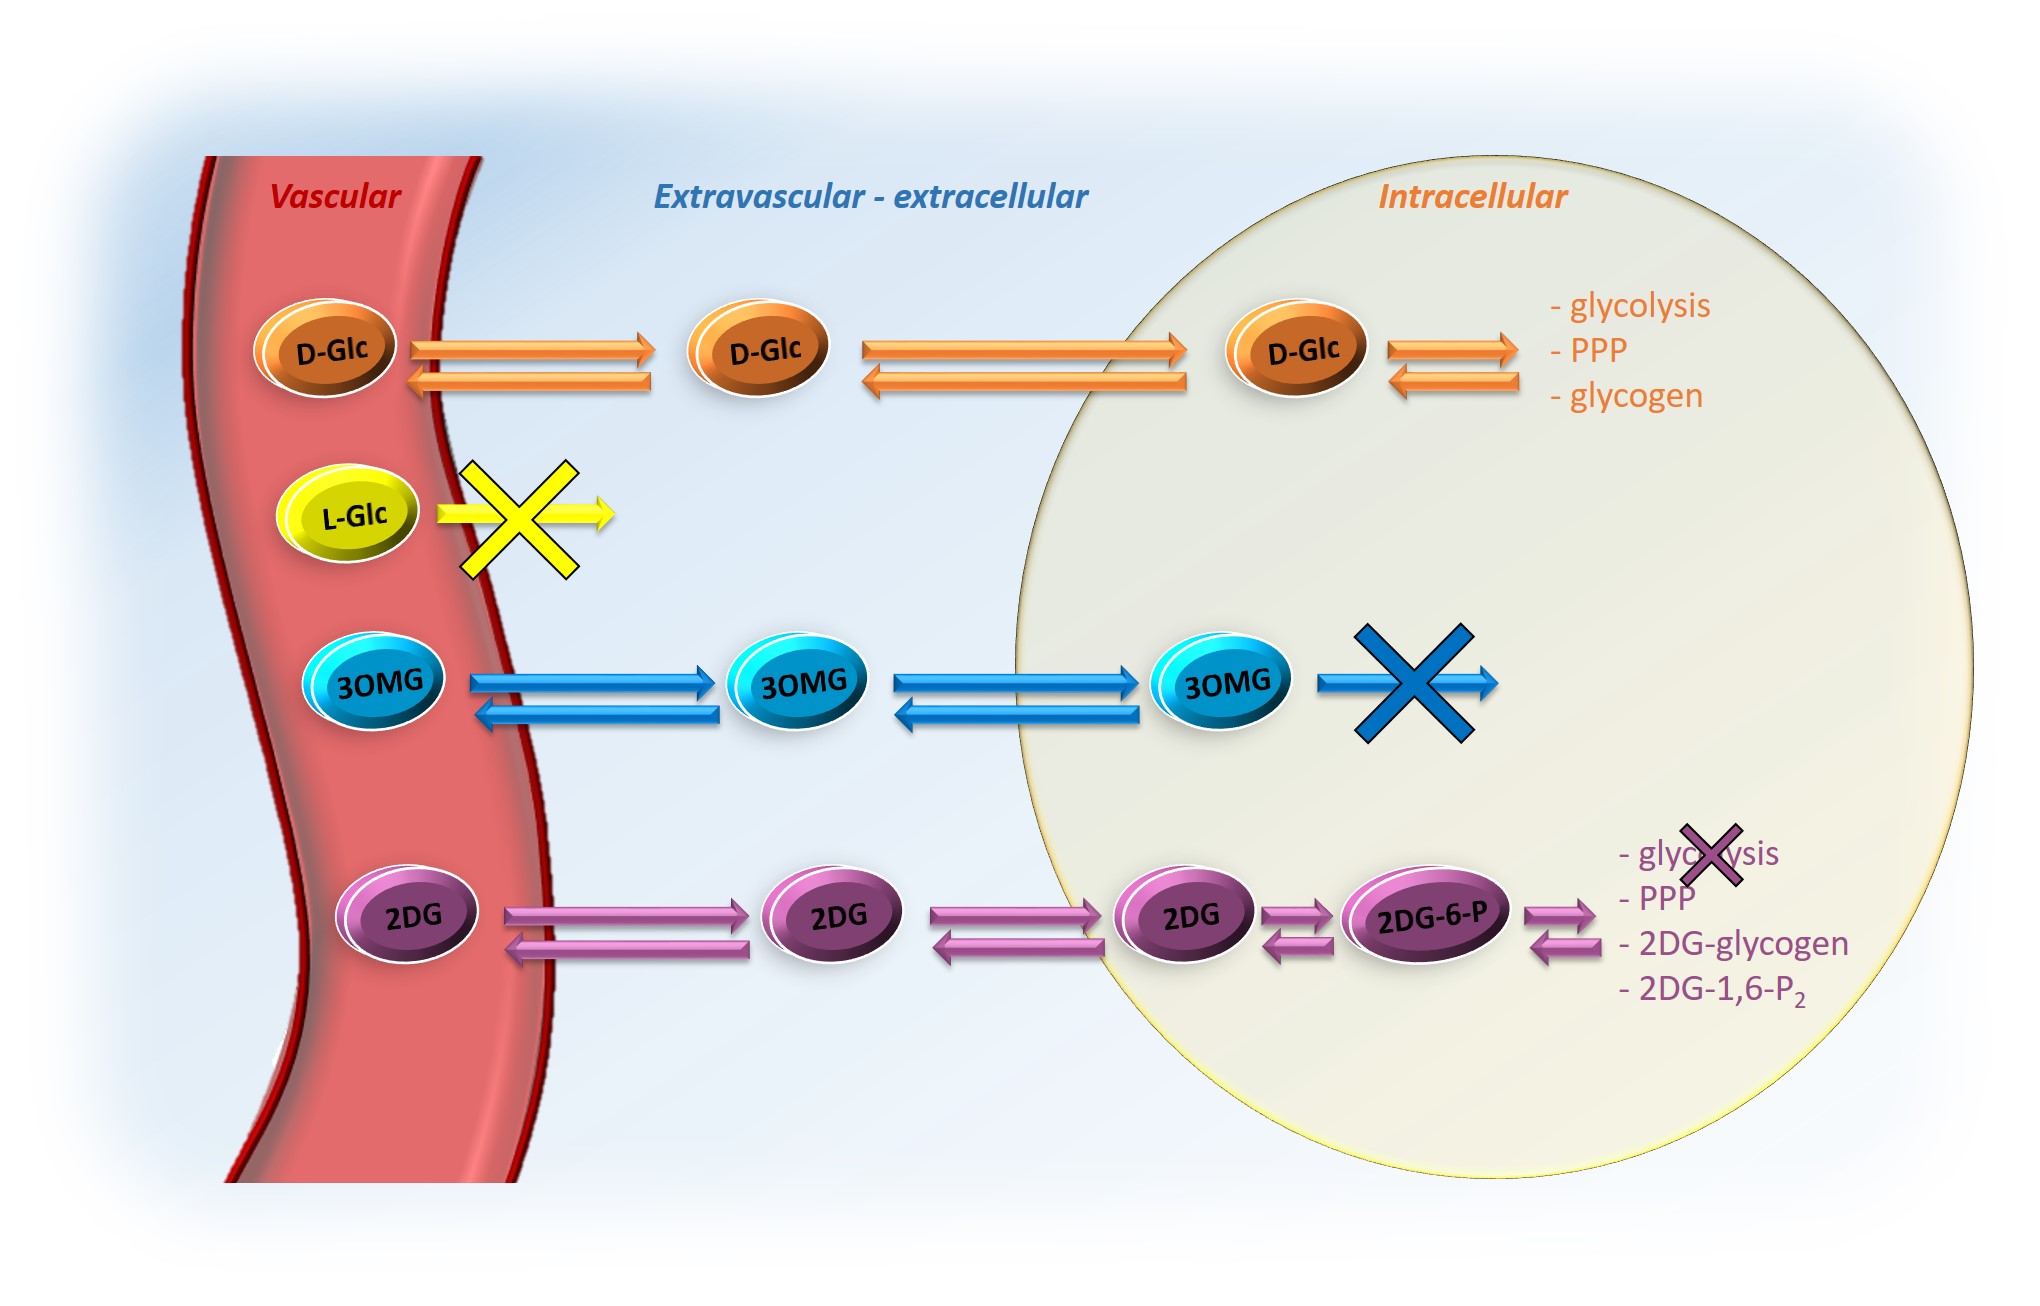
After injection into the vascular space, molecules of interest (except L-Glc) are transported into the extravascular/extracellular space, then into the intracellular space by GLUTs transporters. D-Glc is transported in cells where it can be metabolized through glycolysis, penthose phosphate pathway (PPP) or into glycogen. 3OMG is transported in cells but does not undergo further metabolism. 2DG is transported in cells where it metabolized into 2DG6P by hexokinase but it does not undergo glycolysis.
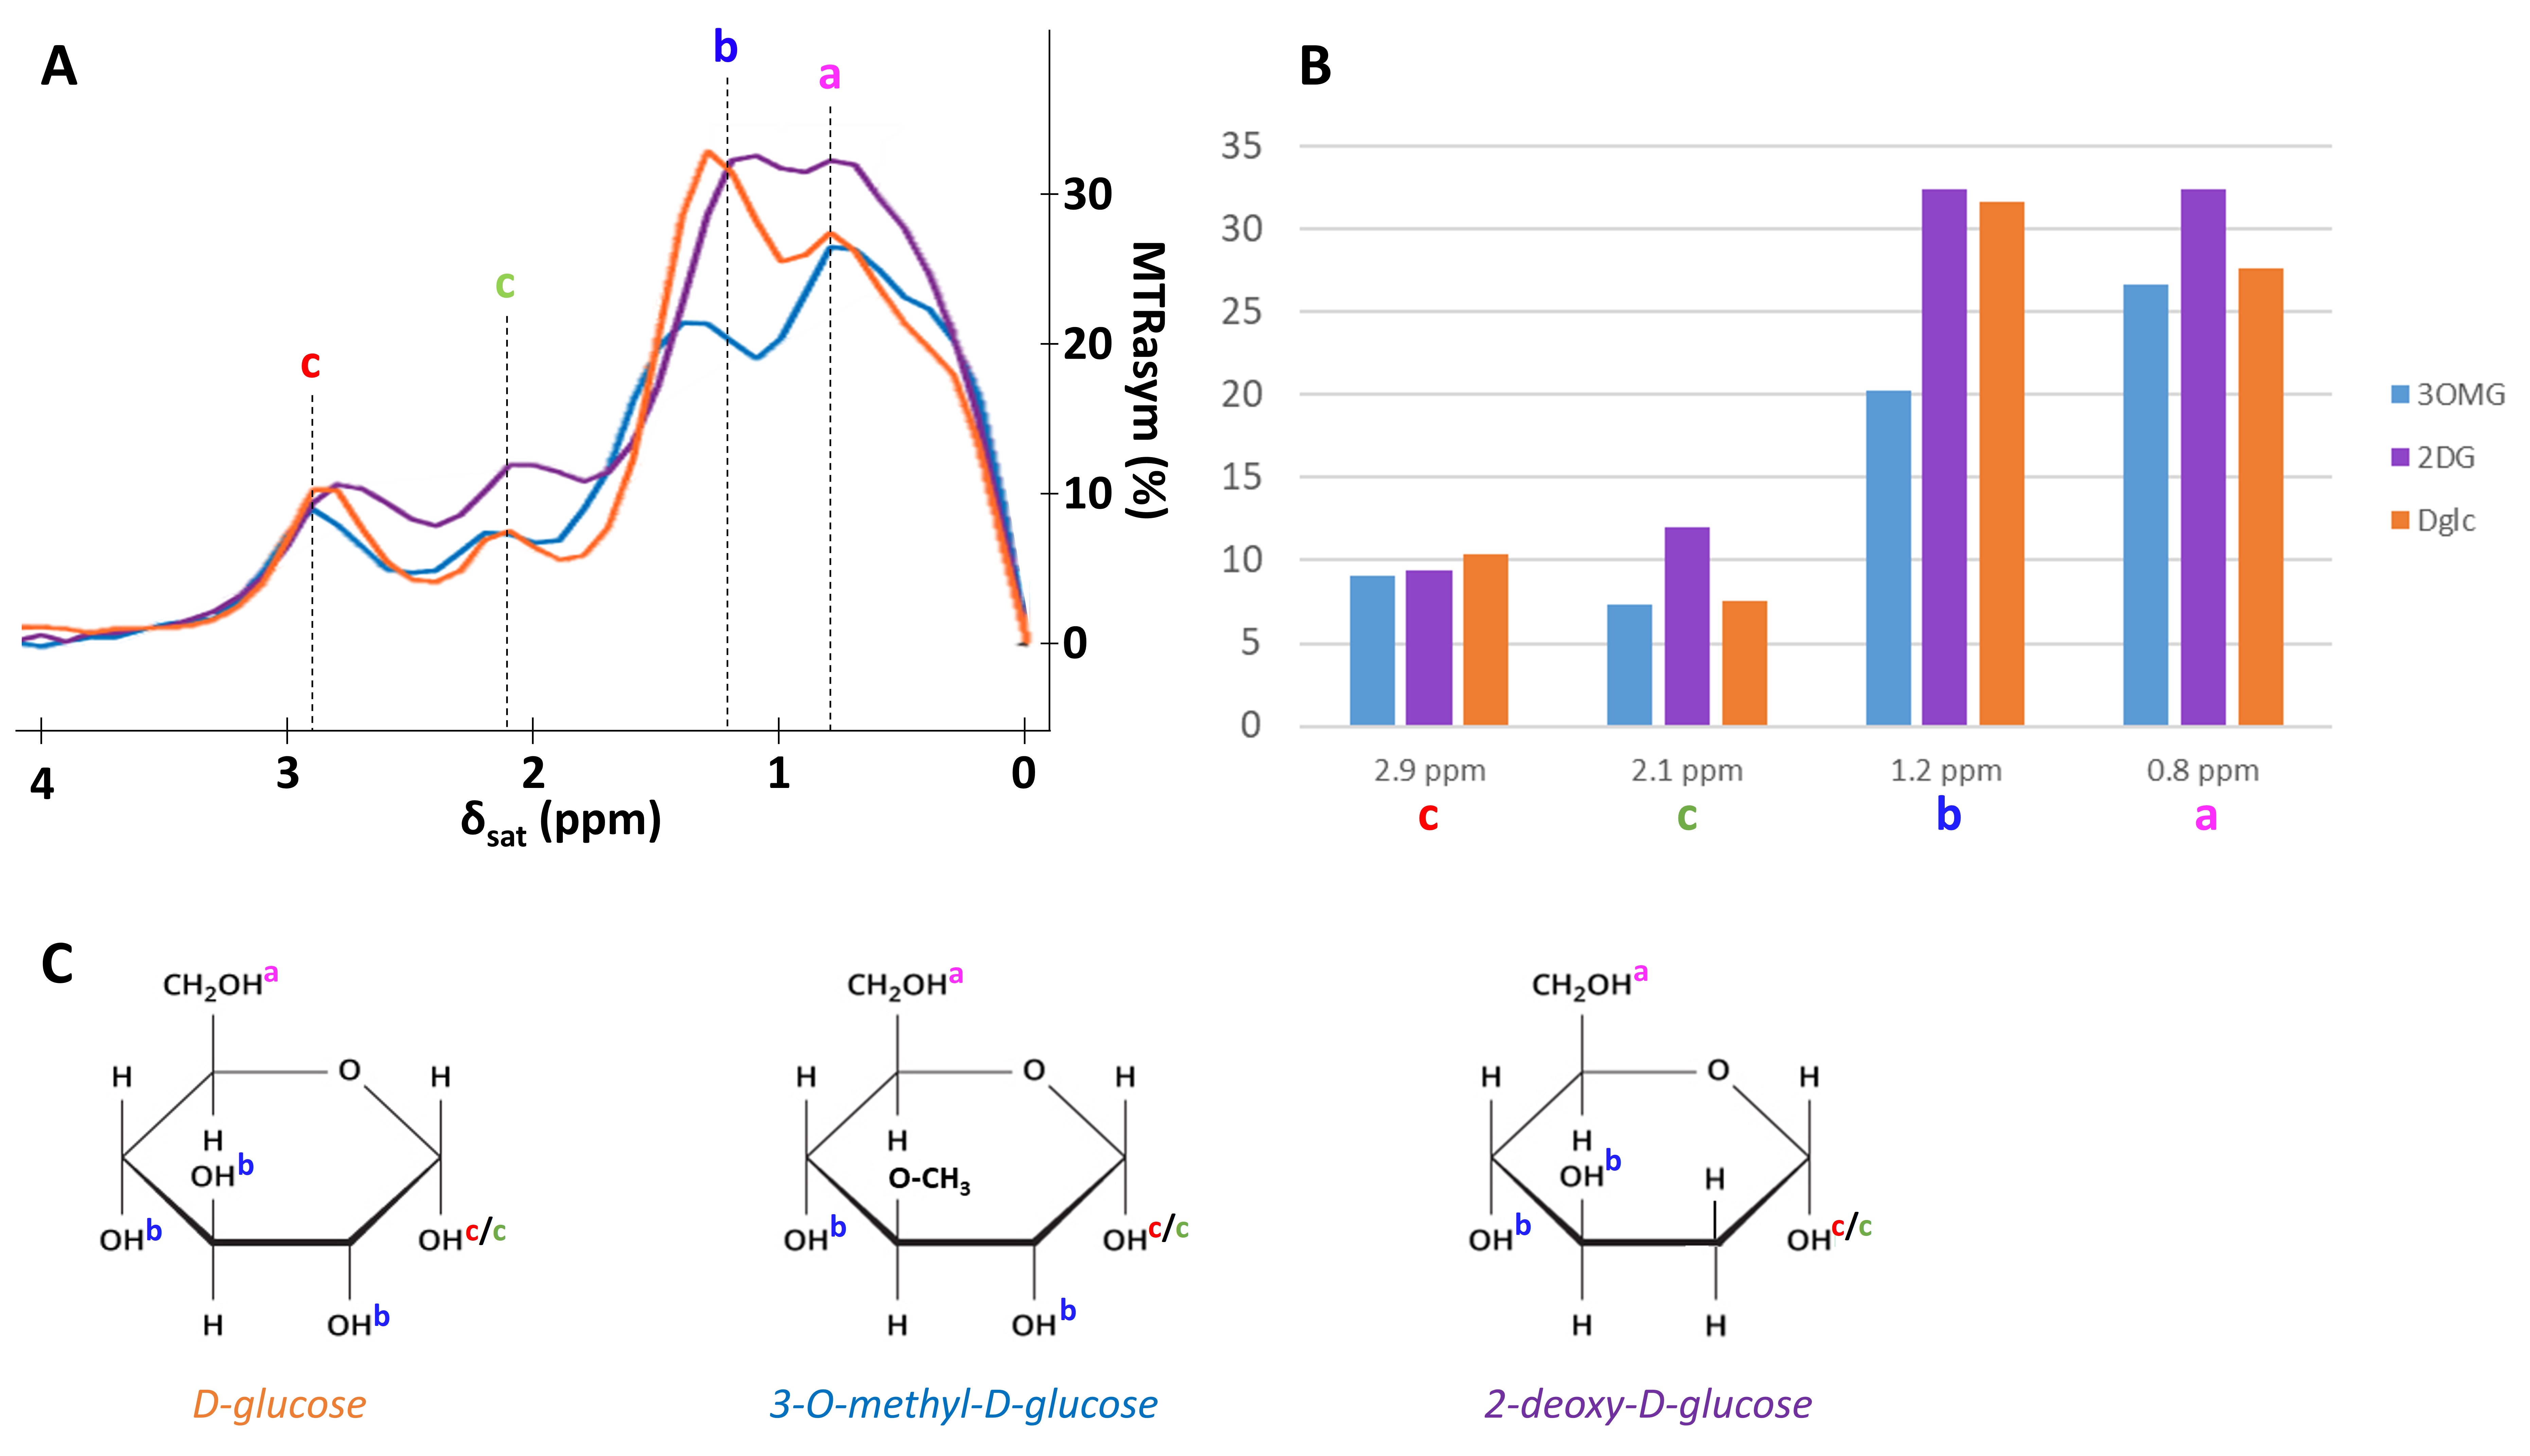
Figure 2:
in vitro characterization of D-Glc, 3OMG and 2DG
MTRasym were acquired with B1 = 2 µT in 50mM solution of D-Glc, 3OMG and 2DG with peaks attributed to each hydroxyl groups.
A: MTRasym of phantoms of D-Glc (orange), 3OMG (blue) and 2DG (purple).
B: Representation of signal sensitivity for each resonance and each molecule of interest.
C: Molecules of D-Glc, 3OMG and 2DG with hydroxyls groups attributed to each MTRasym peak.
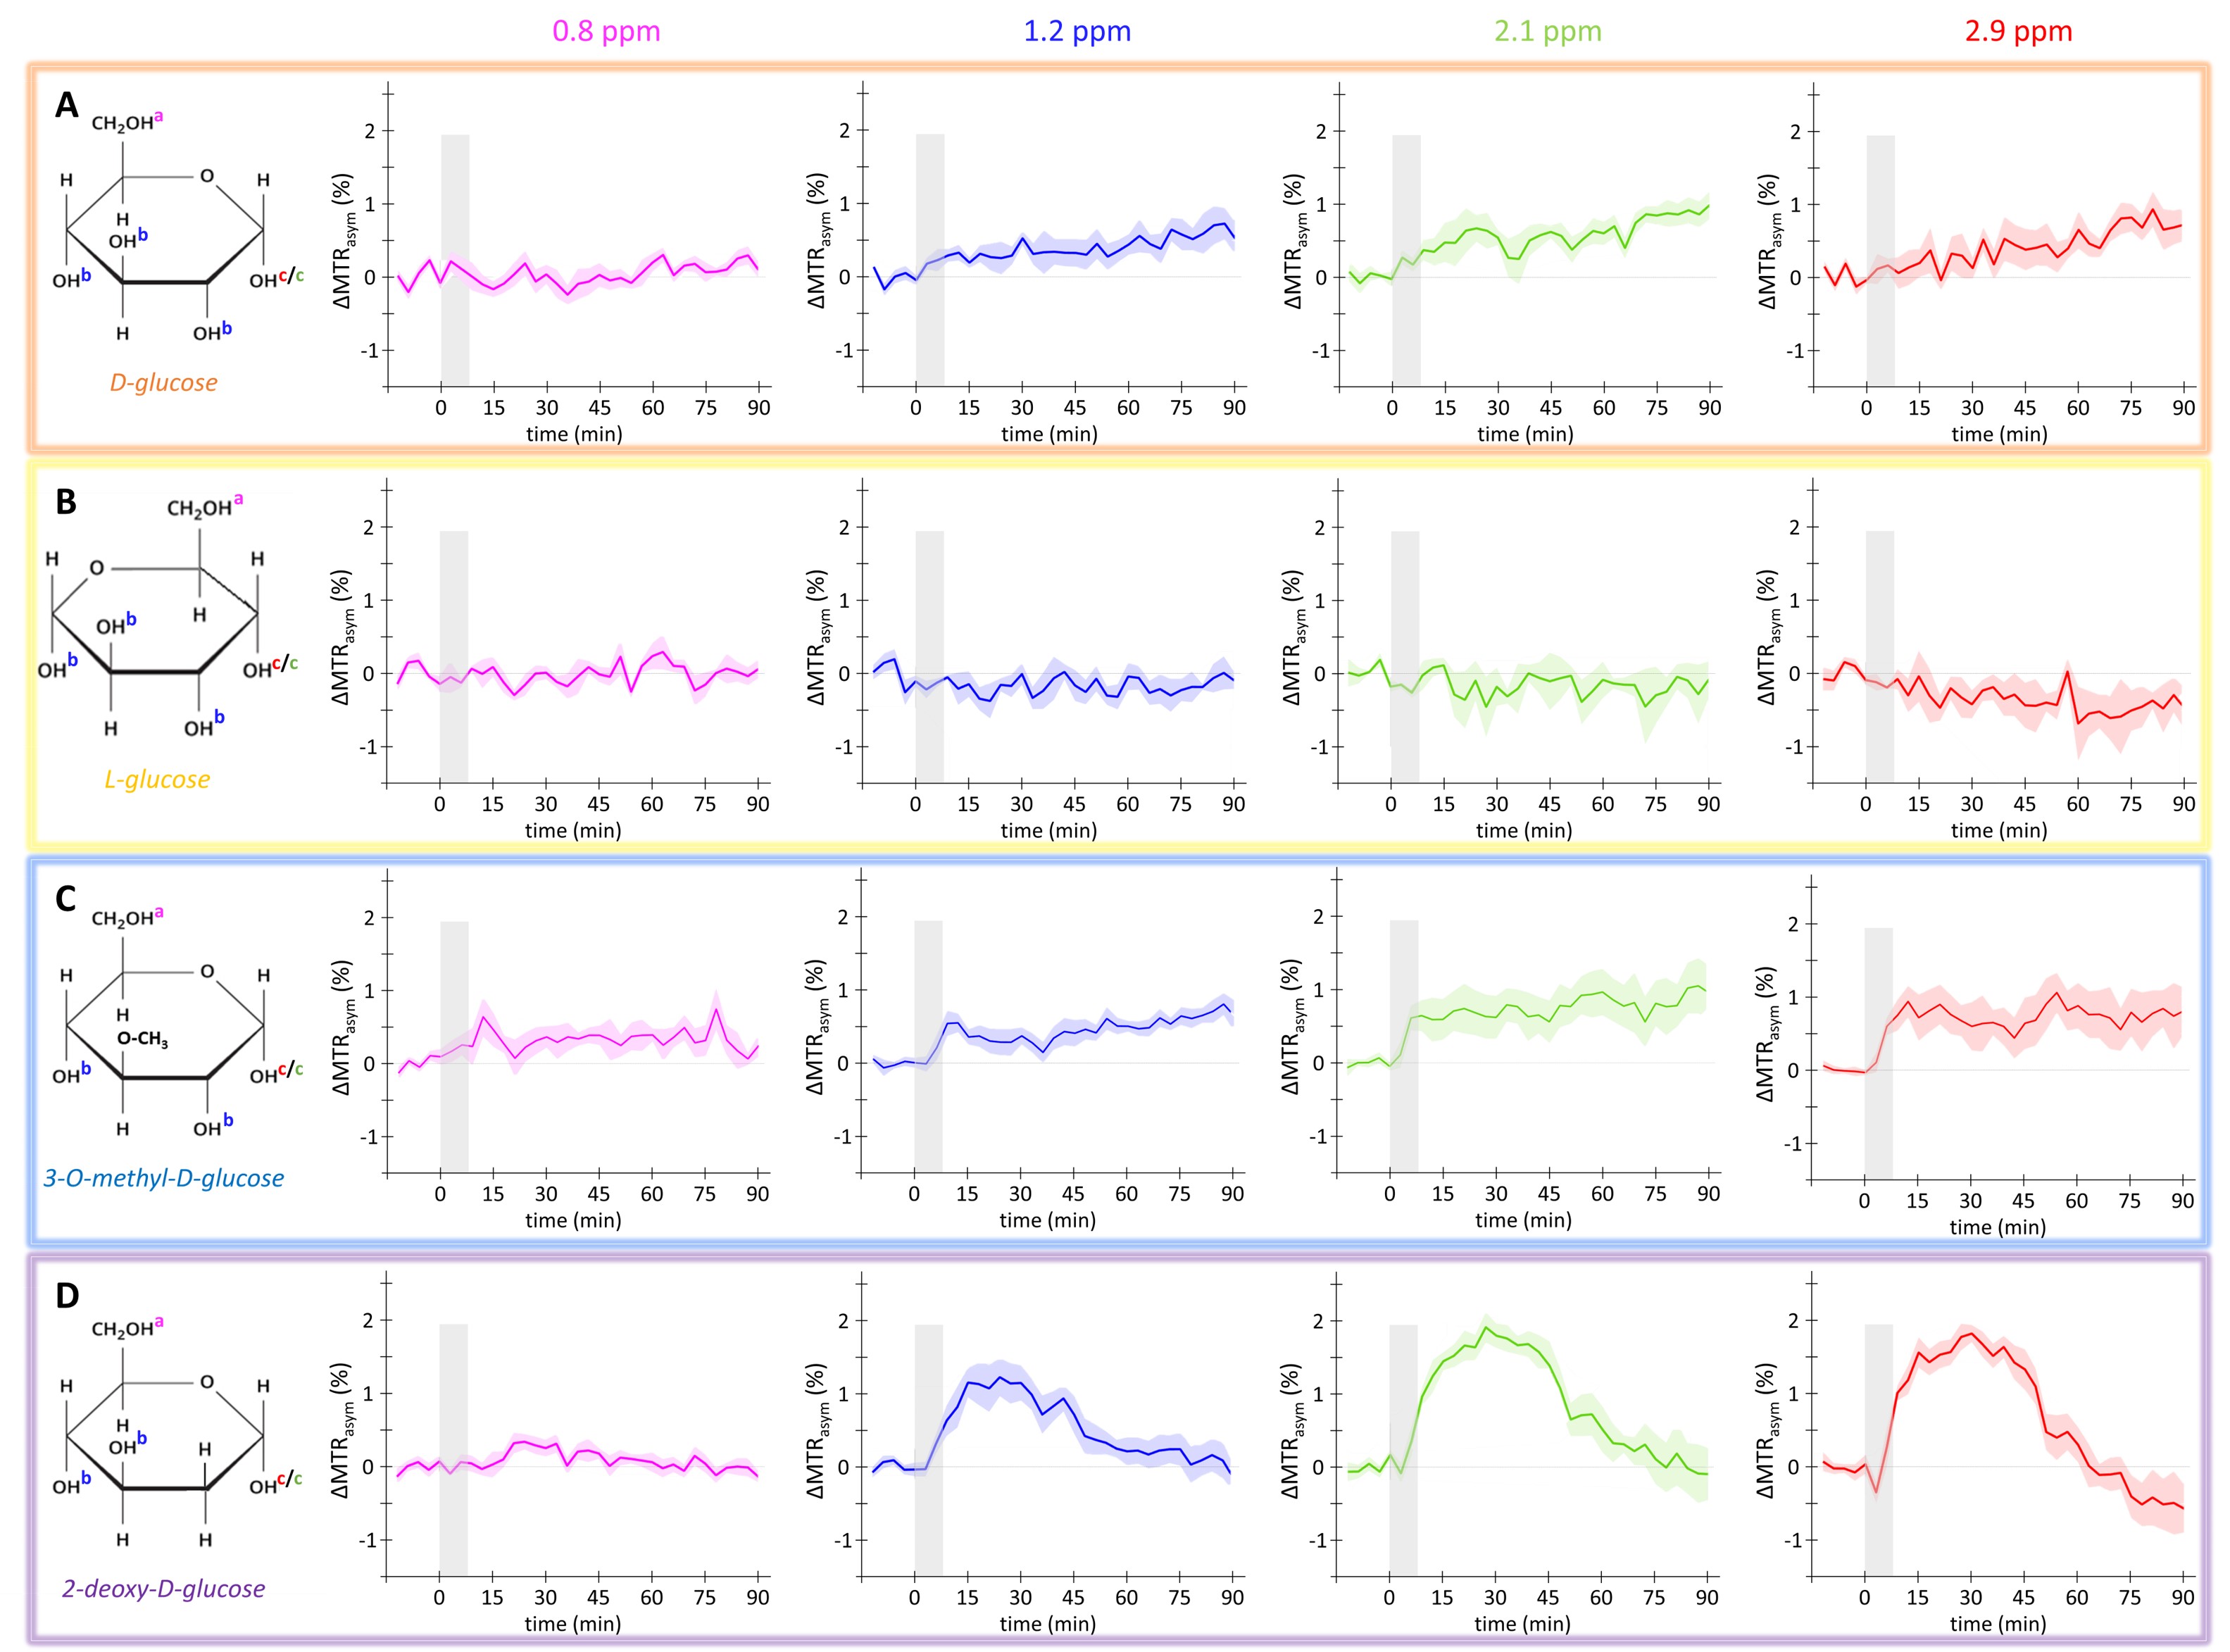
Figure 3: in vivo kinetics of glucoCEST signal
Intravenous injection of D-Glc (A), L-Glc (B), 3OMG (C) and 2DG (D). GlucoCEST variations were measured before and after intravenous injection (gray area) at 0.8 ppm, 1.2
ppm, 2.1 ppm, 2.9 ppm. Mean ± SEM variations of CEST signal compared to baseline are shown (n=5, 3, 9 and 7 respectively).