0144
Predicting malignancy in additional lesion in breast cancer: A machine learning approach combining radiomics and clinical imaging analysis1Radiology, Chonnam National University, GWANGJU, Korea, Republic of, 2Radiology, Chonnam National University Hwasun Hospital, Hwasun, Korea, Republic of, 3Radiology, Chonnam National University, Gwangju, Korea, Republic of, 4Radiology, Chonnam National University Hospital, GWANGJU, Korea, Republic of, 5Artificial Intelligence Convergence, Chonnam National University, Gwangju, Korea, Republic of
Synopsis
The purpose of this study was to investigate the feasibility of machine learning classifiers combining radiomics and clinical imaging interpretation for predicting malignancy in additional MR-detected enhancing lesions on multiparametric breast MRI. Machine learning algorithms trained with the combination of radiomics features extracted from breast MRI and clinical imaging interpretation what was obtained by an experienced breast radiologist demonstrated the maximal accuracy and AUC of 86.2% and 92.6%, respectively. The results from this study suggest that our approach may provide a noninvasive assisting tool to guide proper management that can reduce the use of unnecessary US or biopsy.
Introduction
MRI is widely used for preoperative evaluation of the extent of malignancy as well as to detect any ipsilateral or contralateral additional lesions. It is of importance to accurately predict malignancy of an additional MR-detected lesion which has not been identified on prior mammogram or ultrasound due to differing treatment options [1]. The aim of this study was to investigate whether machine learning classifiers combining radiomics and clinical imaging analysis can predict malignancy in additional enhancing lesions on multiparametric breast MRI.Methods
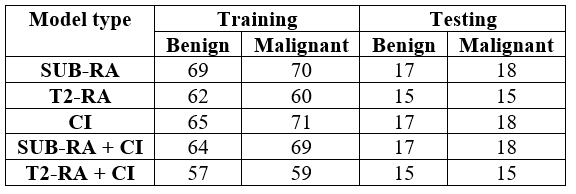
A total of 174 patients with primary breast cancer, who underwent preoperative MRI in 3T scanners and was pathologically-confirmed to have additional enhancing lesions (benign, n=86; malignant, n=88) were included in this study. Three datasets were collected: the subtraction images between pre- and post-contrast T1-weighted image (SUB), T2-weighted image (T2) and clinical imaging interpretation (CI), that is a qualitative assessment of breast lesion imaging characteristics made by an experienced breast radiologist. The entire data was split to training (80%) and independent test set (20%) (Table 1).The ROIs of additional enhancing lesions were drawn semi-automatically using 3D Slicer [2] by an experienced radiologist. A set of 107 radiomics features were extracted from the ROIs of additional enhancing lesions in SUB and T2 using PyRadiomics [3]. For each radiomics feature set of SUB and T2, a 2-step feature selection procedure was applied. At first, least absolute shrinkage and selection operator (LASSO) was applied across the training data 100 times with a random selection of LASSO-training (80%) and LASSO-validation (20%). Only features that had non-zero weights more than 10 times were selected. The second feature selection step was applied to define a new set of features, S, to produce the maximum classification accuracy. Each of the feature from the first step was added to S and the classification accuracy was evaluated. If adding a new feature increased the accuracy, the feature remained in S. Otherwise, it was removed from S. To evaluate the classification accuracy, a Support Vector Machine (SVM) was applied to the training dataset with 4-fold cross validation, where 3 parts of training dataset were used for training and 1 part for validation. The accuracy was calculated as an average from 4-fold validations. After the optimal set of features were determined, the features in S_SUB and S_T2 were extracted from the independent testing dataset, transferred to the trained SVM model at the inference step to evaluate the performance of the proposed method.
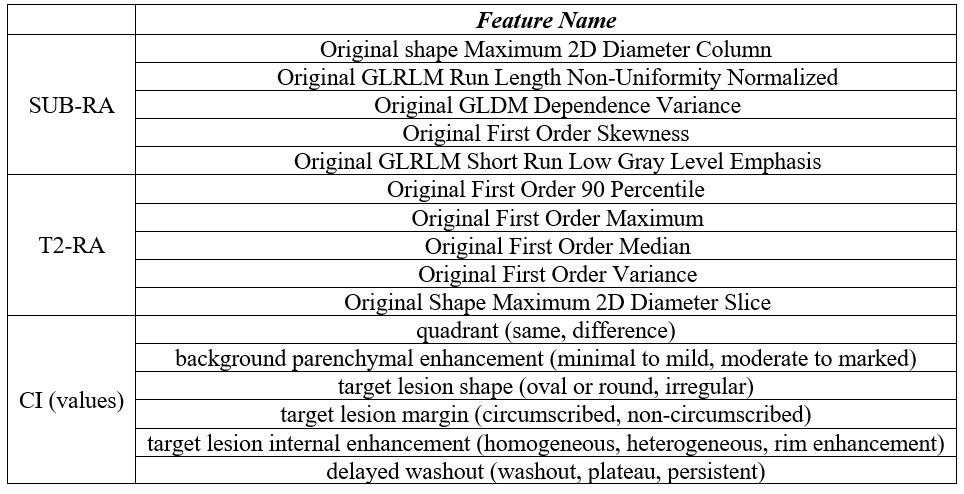
For analysis using CI, a decision tree model was applied to the features from CI to classify the additional enhancing lesion as malignant or benign. The names of CI features used in the decision tree model and their values are listed in Table 2. The proposed model applied ID3 algorithm to build up the tree.
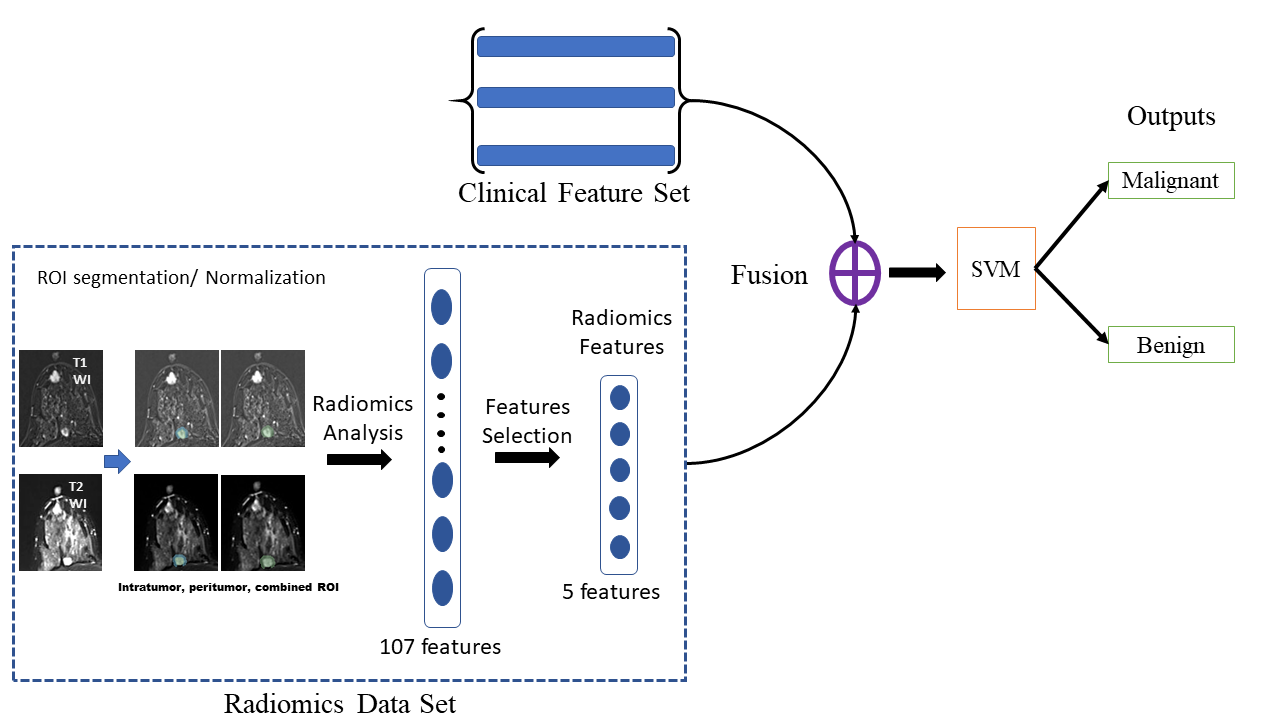
Lastly, fusion models combining features from radiomics and CI analysis were developed. The features in S_SUB and S_T2 were separately concatenated with three features from CI, which include quadrant, delayed washout and target lesion margin. SVM models were trained using these concatenated features. The workflow of the fusion model is shown in the Figure 1.
Results and Discussion
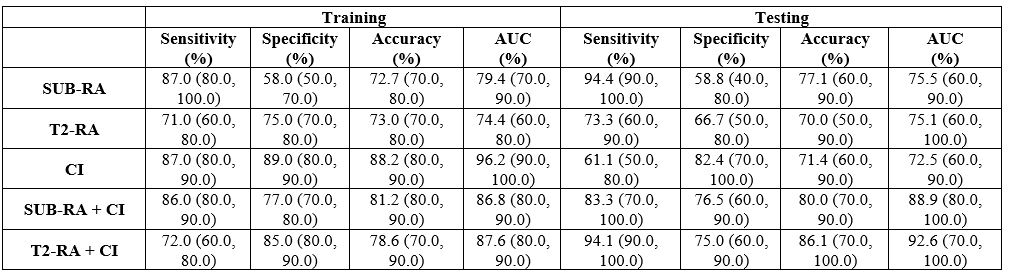
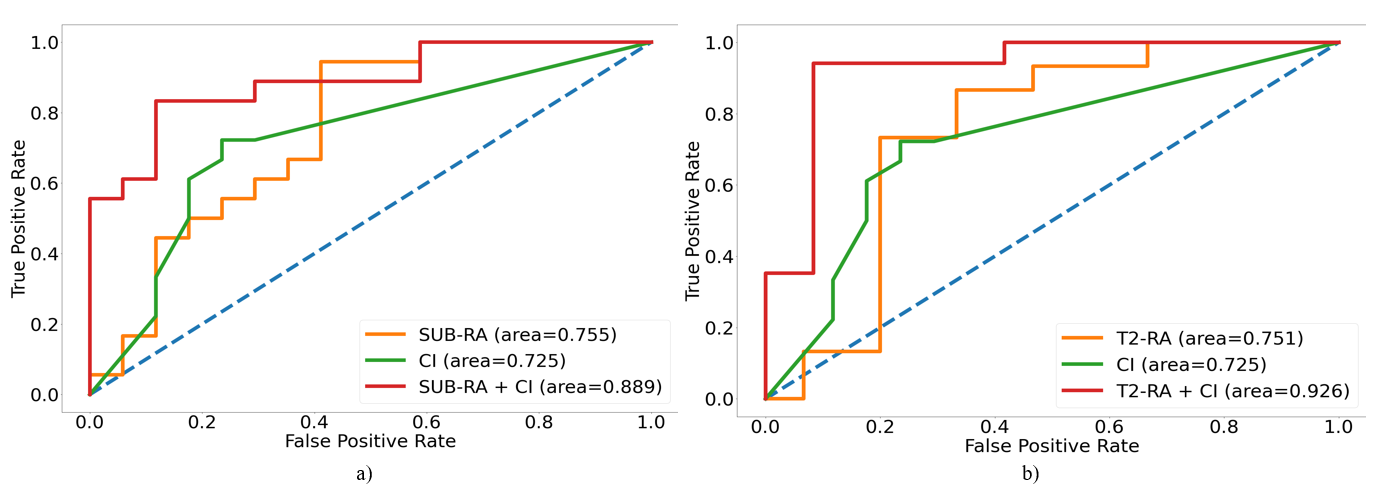
Malignancy prediction using radiomics analysis of multiparametric MRI: The 2-step feature selection procedure rendered the combination of 5 radiomics features for SUB and T2 each, which consisted of intensity-, shaped- and texture-based metrics (Table 2). Table 3 shows the summary of results for the classification between malignant and benign lesions using machine learning classifiers. The performance of predicting malignancy in additional MR-detected lesions were similar between the model using SUB and T2 features with the accuracy and AUC of 77.1% and 75.5% for SUB and 70.0% and 75.1% for T2 on independent test set.Malignancy prediction using clinical imaging interpretation data: The decision tree model using the features from clinical imaging interpretation produced the performance of classifying between malignant and benign additional MR-detected lesions, which was comparable to that of SVM models using radiomics features from SUB and T2. The accuracy and AUC were 71.4% and 72.5%, respectively.
The fusion models combing features from radiomics and clinical imaging interpretation demonstrated improved performances: The SVM classifier using the combination of features from both radiomics and clinical imaging interpretation (CI) produced improved malignancy predicting performance. The accuracy and AUC of the SUB-radiomics+CI model were 80.0% and 88.9%, respectively, which demonstrated a 3-5% increase in accuracy and a 13-16% increase in AUC compared to those of SUB-radiomics or CI models (Table 3). Similarly, the accuracy and AUC of the T2-radiomics+CI model were 86.2% and 92.6%, respectively, which indicated approximately a 16% increase in accuracy and a 17-20% increase in AUC compared to those of T2-radiomics or CI models (Table 3).
Conclusion
In this study, we proposed an effective method to extract radiomics features from breast MRI data and demonstrated that machine learning methods combining features from radiomics and clinical imaging interpretation using multiparametric MRI can be used to predict malignancy in additional MR-detected lesions in patients with breast cancer. Our results suggest that this approach may provide a noninvasive assisting tool to guide proper management that can reduce the use of unnecessary US or biopsy.Acknowledgements
This study was supported by the Ministry of Education, Republic of Korea (2019R1I1A3A01059201) and the Korea Health Technology R&D Project through the Korea Health Industry Development Institute (KHIDI), funded by the Ministry of Health & Welfare, Republic of Korea (HR20C0021).References
1. Fan XC, et. al. Impact of presurgical breast magnetic resonance imaging (MRI) on surgical planning: a retrospective analysis from a private radiology group. Breast J 2013;19:134-141.
2. Fedorov A, et. al. 3D Slicer as an image computing platform for the Quantitative Imaging Network. Magn Reson Imaging. 2012 Nov; 30(9):1323-41.3. van Griethuysen JJM, et. al. Computational Radiomics System to Decode the Radiographic Phenotype. Cancer Res. 2017 Nov 1; 77(21): e104–e107.
Figures