0143
Effect of enhancement segmentation thresholds on predicting neoadjuvant response in breast cancer patients using DCE-MRI textural features
Deep K Hathi1, Rohan Nadkarni1, Natsuko Onishi1, Alex Anh-Tu Nguyen1, Wen Li1, Efstathios D Gennatas2, Bonnie N Joe1, Elissa R Price1, I-SPY 2 Consortium3, David C Newitt1, Ella F Jones1, and Nola M Hylton1
1Radiology and Biomedical Imaging, University of California San Francisco, San Francisco, CA, United States, 2Epidemiology & Biostatistics, University of California San Francisco, San Francisco, CA, United States, 3Quantum Leap Healthcare Collaborative, San Francisco, CA, United States
1Radiology and Biomedical Imaging, University of California San Francisco, San Francisco, CA, United States, 2Epidemiology & Biostatistics, University of California San Francisco, San Francisco, CA, United States, 3Quantum Leap Healthcare Collaborative, San Francisco, CA, United States
Synopsis
This study explores the prediction of pathologic complete response (pCR) using tumor-derived textural features in breast cancer patients receiving neoadjuvant chemotherapy. Textural features were generated from increasingly restricted tumor masks applied on DCE-MRI signal enhancement ratio maps. Elastic net and random forests models were trained on features from baseline and early treatment timepoints, resulting in minimal differences in AUC between percent enhancement segmentation thresholds and a mean AUC of 0.68 (range 0.60-0.75). Our analysis suggests that, for the prediction of pCR, textural features derived from strongly enhancing regions dominate over those from regions of lower enhancement.
Introduction
Functional tumor volume (FTV) derived from breast dynamic contrast-enhanced MRI (DCE-MRI) is predictive of post-surgery pathologic complete response (pCR)1 and 5-year recurrence-free survival2 in locally advanced breast cancer patients receiving neoadjuvant chemotherapy (NAC). FTV corresponds to viable tumor burden and neo-angiogenesis by incorporating contrast uptake kinetics and retention via empirically determined thresholds from percent enhancement (PE) and signal enhancement ratio (SER) maps3. Recently, several studies have demonstrated that radiomics-based models further describing intra-tumoral heterogeneity in DCE-MRI images have improved on the capability of breast DCE-MRI for predicting response to NAC4,5. However, most radiomics features are highly dependent on tumor volumes. We have previously demonstrated that the optimal PE and SER segmentation thresholds for FTV and its subsequent ability to predict pCR varied by breast cancer subtype based on the expression of hormonal receptor (HR) and human epidermal growth factor receptor-2 (HER2) status6. To further assess the impact of tumor segmentation on radiomics models, we studied the effect of varying PE segmentation thresholds on textural radiomics features and their prediction of pCR from pre-treatment baseline and early during-treatment timepoints in a retrospective cohort of patients receiving NAC in the multi-center treatment trial I-SPY 2 TRIAL (Investigation of Serial Studies to Predict Your Therapeutic Response With Imaging And Molecular Analysis 2)7.Methods
This retrospective study cohort was comprised of 990 I-SPY 2 patients randomly assigned to one of the 11 experimental treatment arms between 2010 and 2016. All participating sites received institutional review board approval and patients provided written informed consent prior to enrollment in the trial. DCE-MRI exams performed at baseline (T0) and three weeks after the start of NAC (T1) were included in this analysis. Axial T1-weighted images were acquired before and at least twice after the injection of gadolinium-based contrast agents using a dedicated breast coil. Early PE and SER maps were generated from pre-contrast, early (2.5 minutes), and late (7.5 minutes) post-contrast timepoints. Analysis was constrained to a manually defined 3D bounding box encompassing all enhancing regions. Tumor masks were defined using PE thresholds ranging from 10% to 90% with a step size of 10% and SER threshold of zero and used to mask SER maps prior to the texture analysis.Textural radiomics features from the gray-level co-occurrence (GLCM), dependence (GLDM), run length (GLRLM), size zone (GLSZM), and neighborhood gray-tone difference (NGTDM) matrices were calculated for each masked SER map using the PyRadiomics8 package in Python 3.6. All feature calculations were performed in accordance with the Image Biomarker Standardization Initiative recommendations9, by first resampling masked SER maps to 1.5 mm isotropic resolution with linear interpolation and converting to 64 discrete gray levels. Regions with less than five pixels were excluded from radiomics calculations. FTV was also calculated for each PE threshold, resulting in 76 features for each PE segmentation threshold and treatment timepoint.
Machine learning modeling was performed using the rtemis10 package in R 4.0.3 (R Foundation for Statistical Computing, Austria). Elastic net and random forest classifiers were trained separately to predict pCR on z-scored features from each PE threshold with 10-fold stratified outer resampling and 5-fold inner cross-validation for hyperparameter tuning with an 80%/20% training/test data split. Predictive performance was assessed by computing the area under the receiver operator characteristic curve (AUC). Models combined both T0 and T1 features for each PE threshold (N = 152 total features) and were generated in the full cohort, and in three sub-groups stratified by HR and HER2 receptor status (HR+, HR+/HER2-, and HR-). Subgroup analysis of HER2+ patients was excluded due to small sample size.
Results
Of the 990 patients, 43 were excluded due to missing data (Table 1). Initial assessment based on AUC indicates no significant relationship between PE thresholds and the prediction of pCR from T0 and T1 textural features (Figures 1, 2). The best performing elastic net models for the full, HR+, HR-, and HR+/HER2- cohorts were for PE ≥ 30% (AUC, mean ± SD: 0.73 ± 0.02), 50% (0.74 ± 0.03), 70% (0.74 ± 0.04), and 60% (0.68 ± 0.08), respectively. The best performing random forest classifiers for the full, HR+, and HR+/HER2- cohorts were for PE ≥ 50% (0.71 ± 0.03, 0.74 ± 0.05, and 0.69 ± 0.07, respectively) and PE ≥ 60% (0.72 ± 0.04) for HR- patients.Unlike random forests, elastic net models did not select FTV as a high importance feature for any cohort, possibly due to high correlation between FTV and textural features. However, both models selected GLCM features from T1 to be primarily responsible for the predictive performance of the models. Variable importance for elastic net and random forest models are shown in Figures 3 and 4.
Conclusions
Our results indicate that tumor-derived textural features may outperform FTV alone in predicting pCR. PE thresholds had minimal impact on the predictive ability of elastic net and random forest models, suggesting robustness to a wide range of PE thresholds. Our analysis suggests that tumor-derived textural features are weighted more heavily compared to lower-enhancing features in the SER maps. Future work would involve testing radiomics features derived from both PE and SER segmentation thresholds and incorporating age and other clinical covariates into the predictive models.Acknowledgements
This work was supported in part by NIH grants: R01 CA132870, U01 CA225427, and P01 CA210961.References
- Hylton, N. M. et al. Locally advanced breast cancer: MR imaging for prediction of response to neoadjuvant chemotherapy--results from ACRIN 6657/I-SPY TRIAL. Radiology 263, 663-672, doi:10.1148/radiol.12110748 (2012).
- Hylton, N. M. et al. Neoadjuvant Chemotherapy for Breast Cancer: Functional Tumor Volume by MR Imaging Predicts Recurrence-free Survival-Results from the ACRIN 6657/CALGB 150007 I-SPY 1 TRIAL. Radiology279, 44-55, doi:10.1148/radiol.2015150013 (2016).
- Jafri, N. F. et al. Optimized breast MRI functional tumor volume as a biomarker of recurrence-free survival following neoadjuvant chemotherapy. J Magn Reson Imaging 40, 476-482, doi:10.1002/jmri.24351 (2014).
- Lambin, P. et al. Radiomics: extracting more information from medical images using advanced feature analysis. European journal of cancer 48, 441-446, doi:10.1016/j.ejca.2011.11.036 (2012).
- Huang, S. H. et al. Combined PET and MRI Radiomics with Breast Cancer Outcomes. IEEE Medical Imaging Conference Preceeding submitted (2017).
- Li, W. et al. Effect of MR Imaging Contrast Thresholds on Prediction of Neoadjuvant Chemotherapy Response in Breast Cancer Subtypes: A Subgroup Analysis of the ACRIN 6657/I-SPY 1 TRIAL. Tomography 2, 378-387, doi:10.18383/j.tom.2016.00247 (2016).
- Barker, A. D. et al. I-SPY 2: An Adaptive Breast Cancer Trial Design in the Setting of Neoadjuvant Chemotherapy. Clin Pharmacol Ther 86, 97-100, doi:http://www.nature.com/clpt/journal/v86/n1/suppinfo/clpt200968s1.html (2009).
- van Griethuysen, J. J. M. et al. Computational Radiomics System to Decode the Radiographic Phenotype. Cancer Res 77, e104-e107, doi:10.1158/0008-5472.CAN-17-0339 (2017).
- Zwanenburg, A. et al. The Image Biomarker Standardization Initiative: Standardized Quantitative Radiomics for High-Throughput Image-based Phenotyping. Radiology 295, 328-338, doi:10.1148/radiol.2020191145 (2020).
- Gennatas, E. D. Towards precision psychiatry: Gray matter development and cognition in adolescence. (2017).
Figures
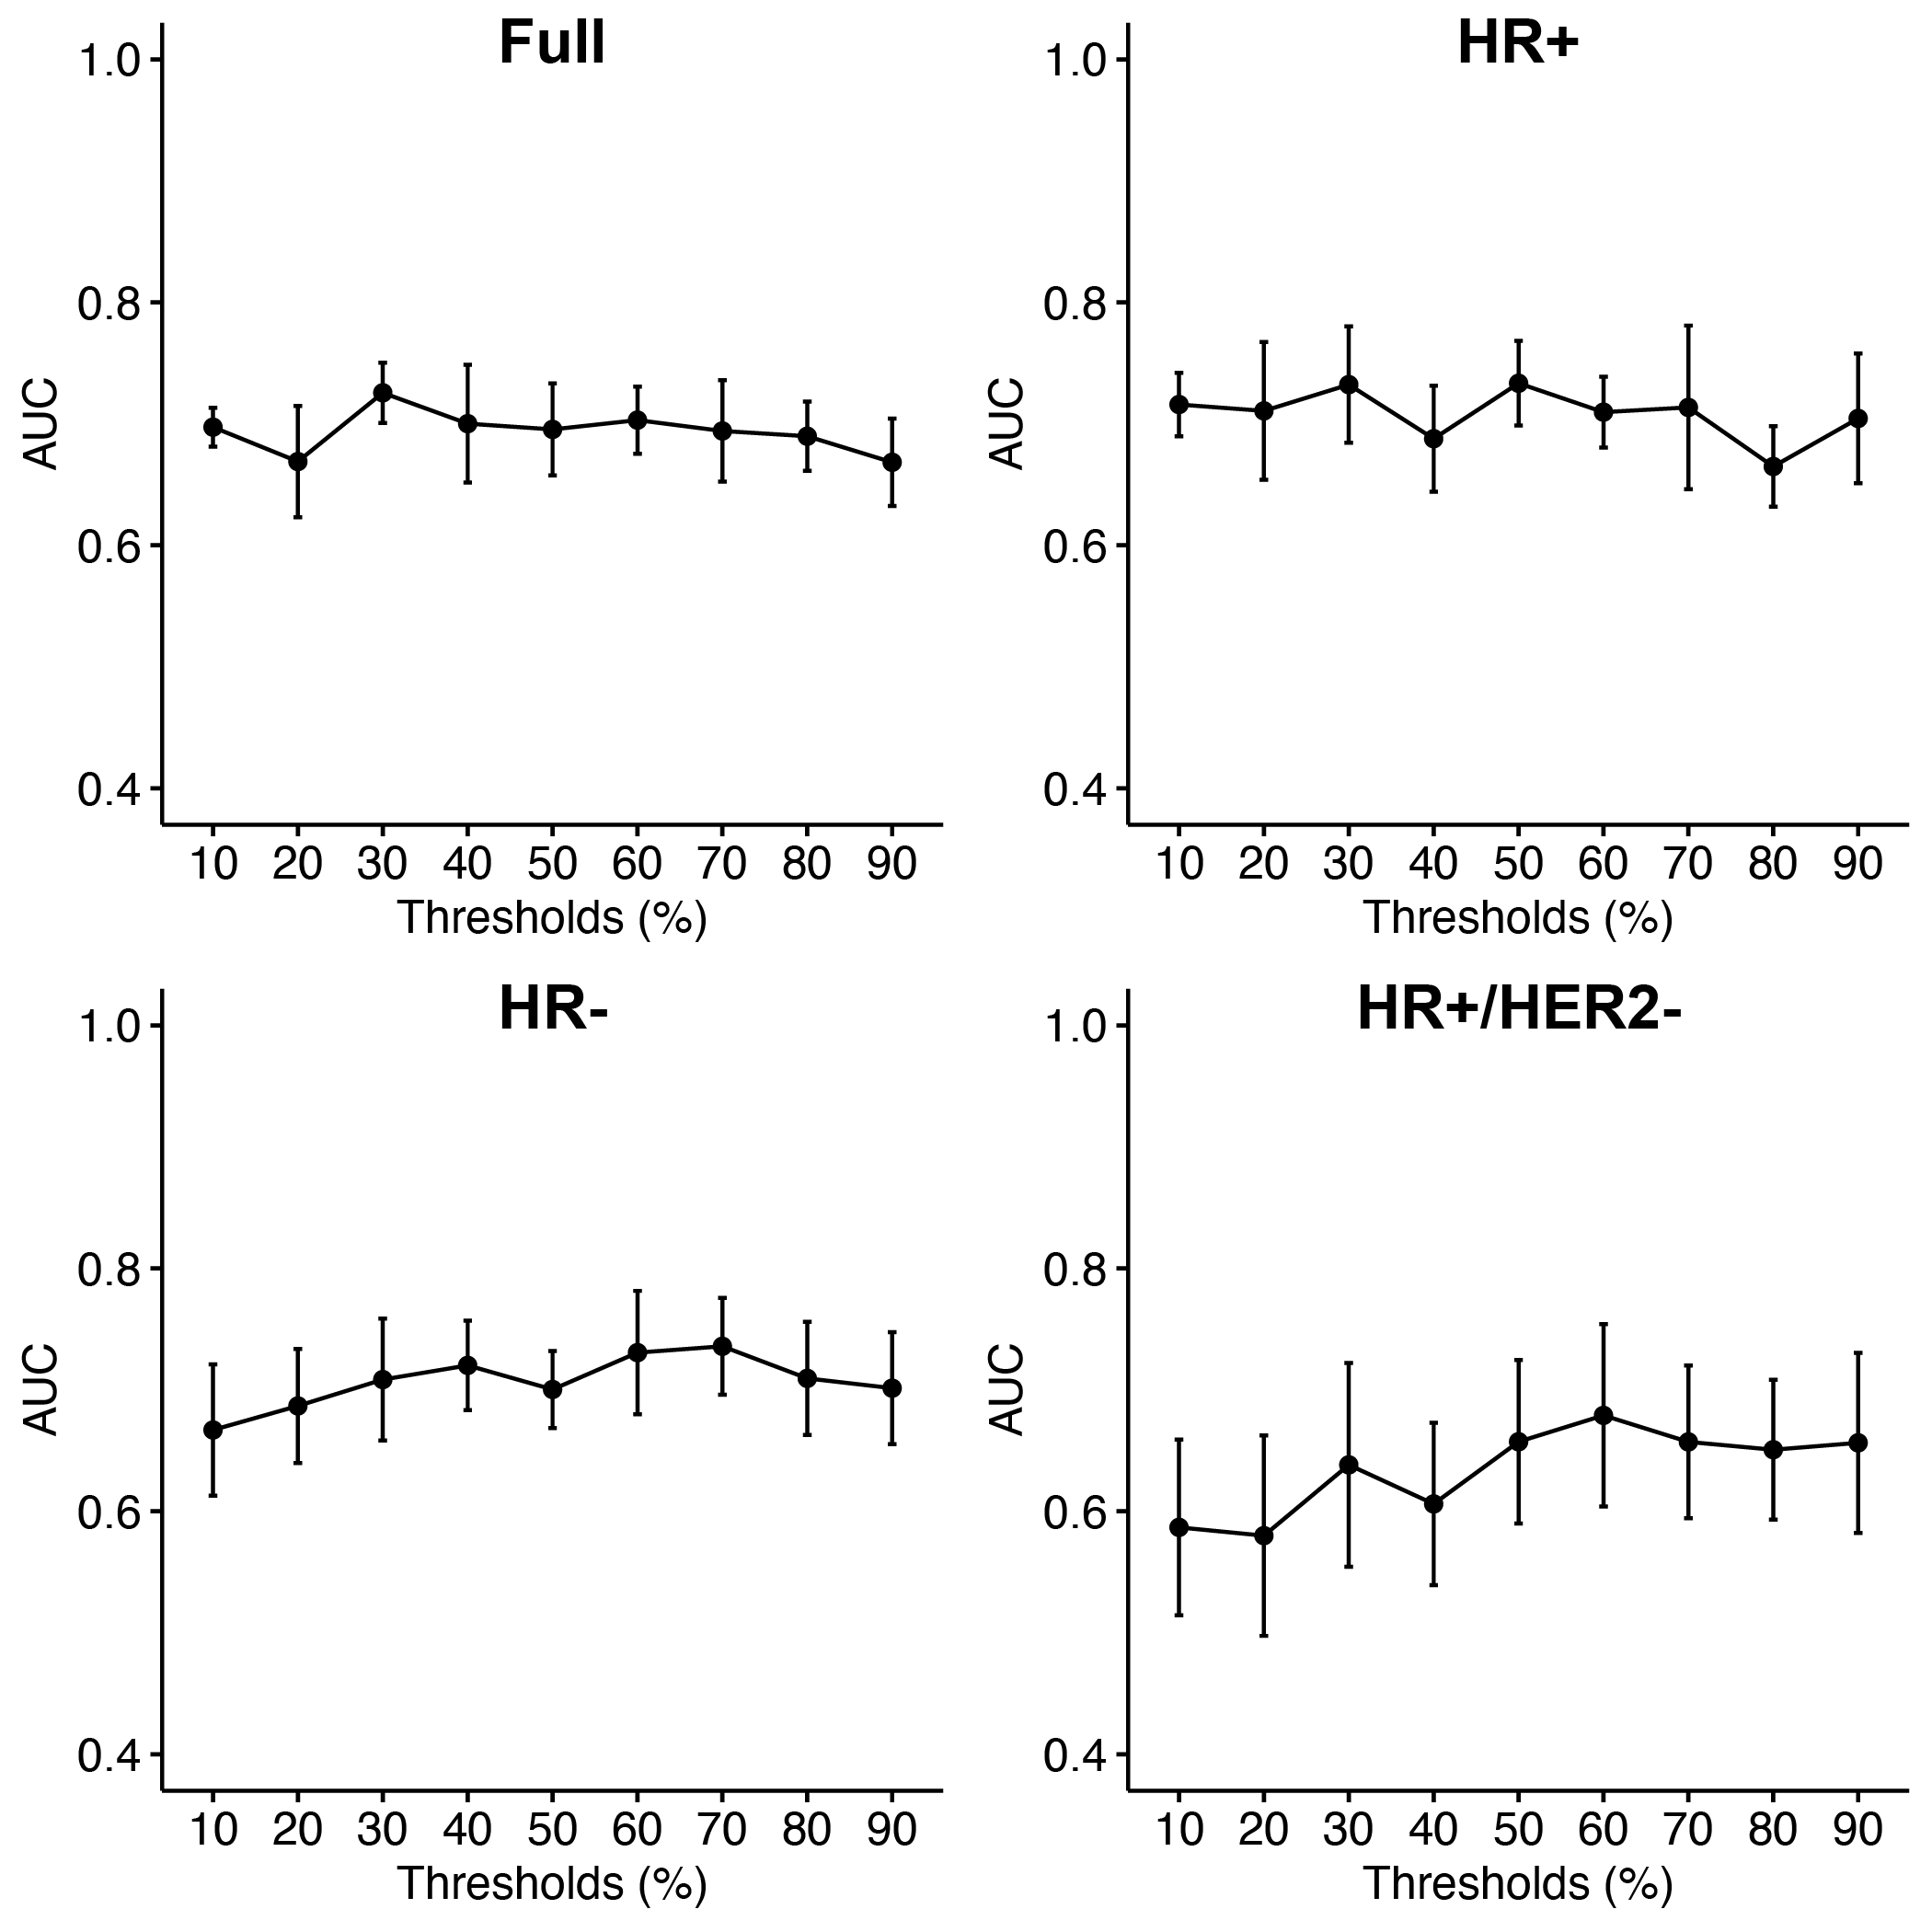
Figure 1: Elastic net fit quality as a function of PE thresholds.
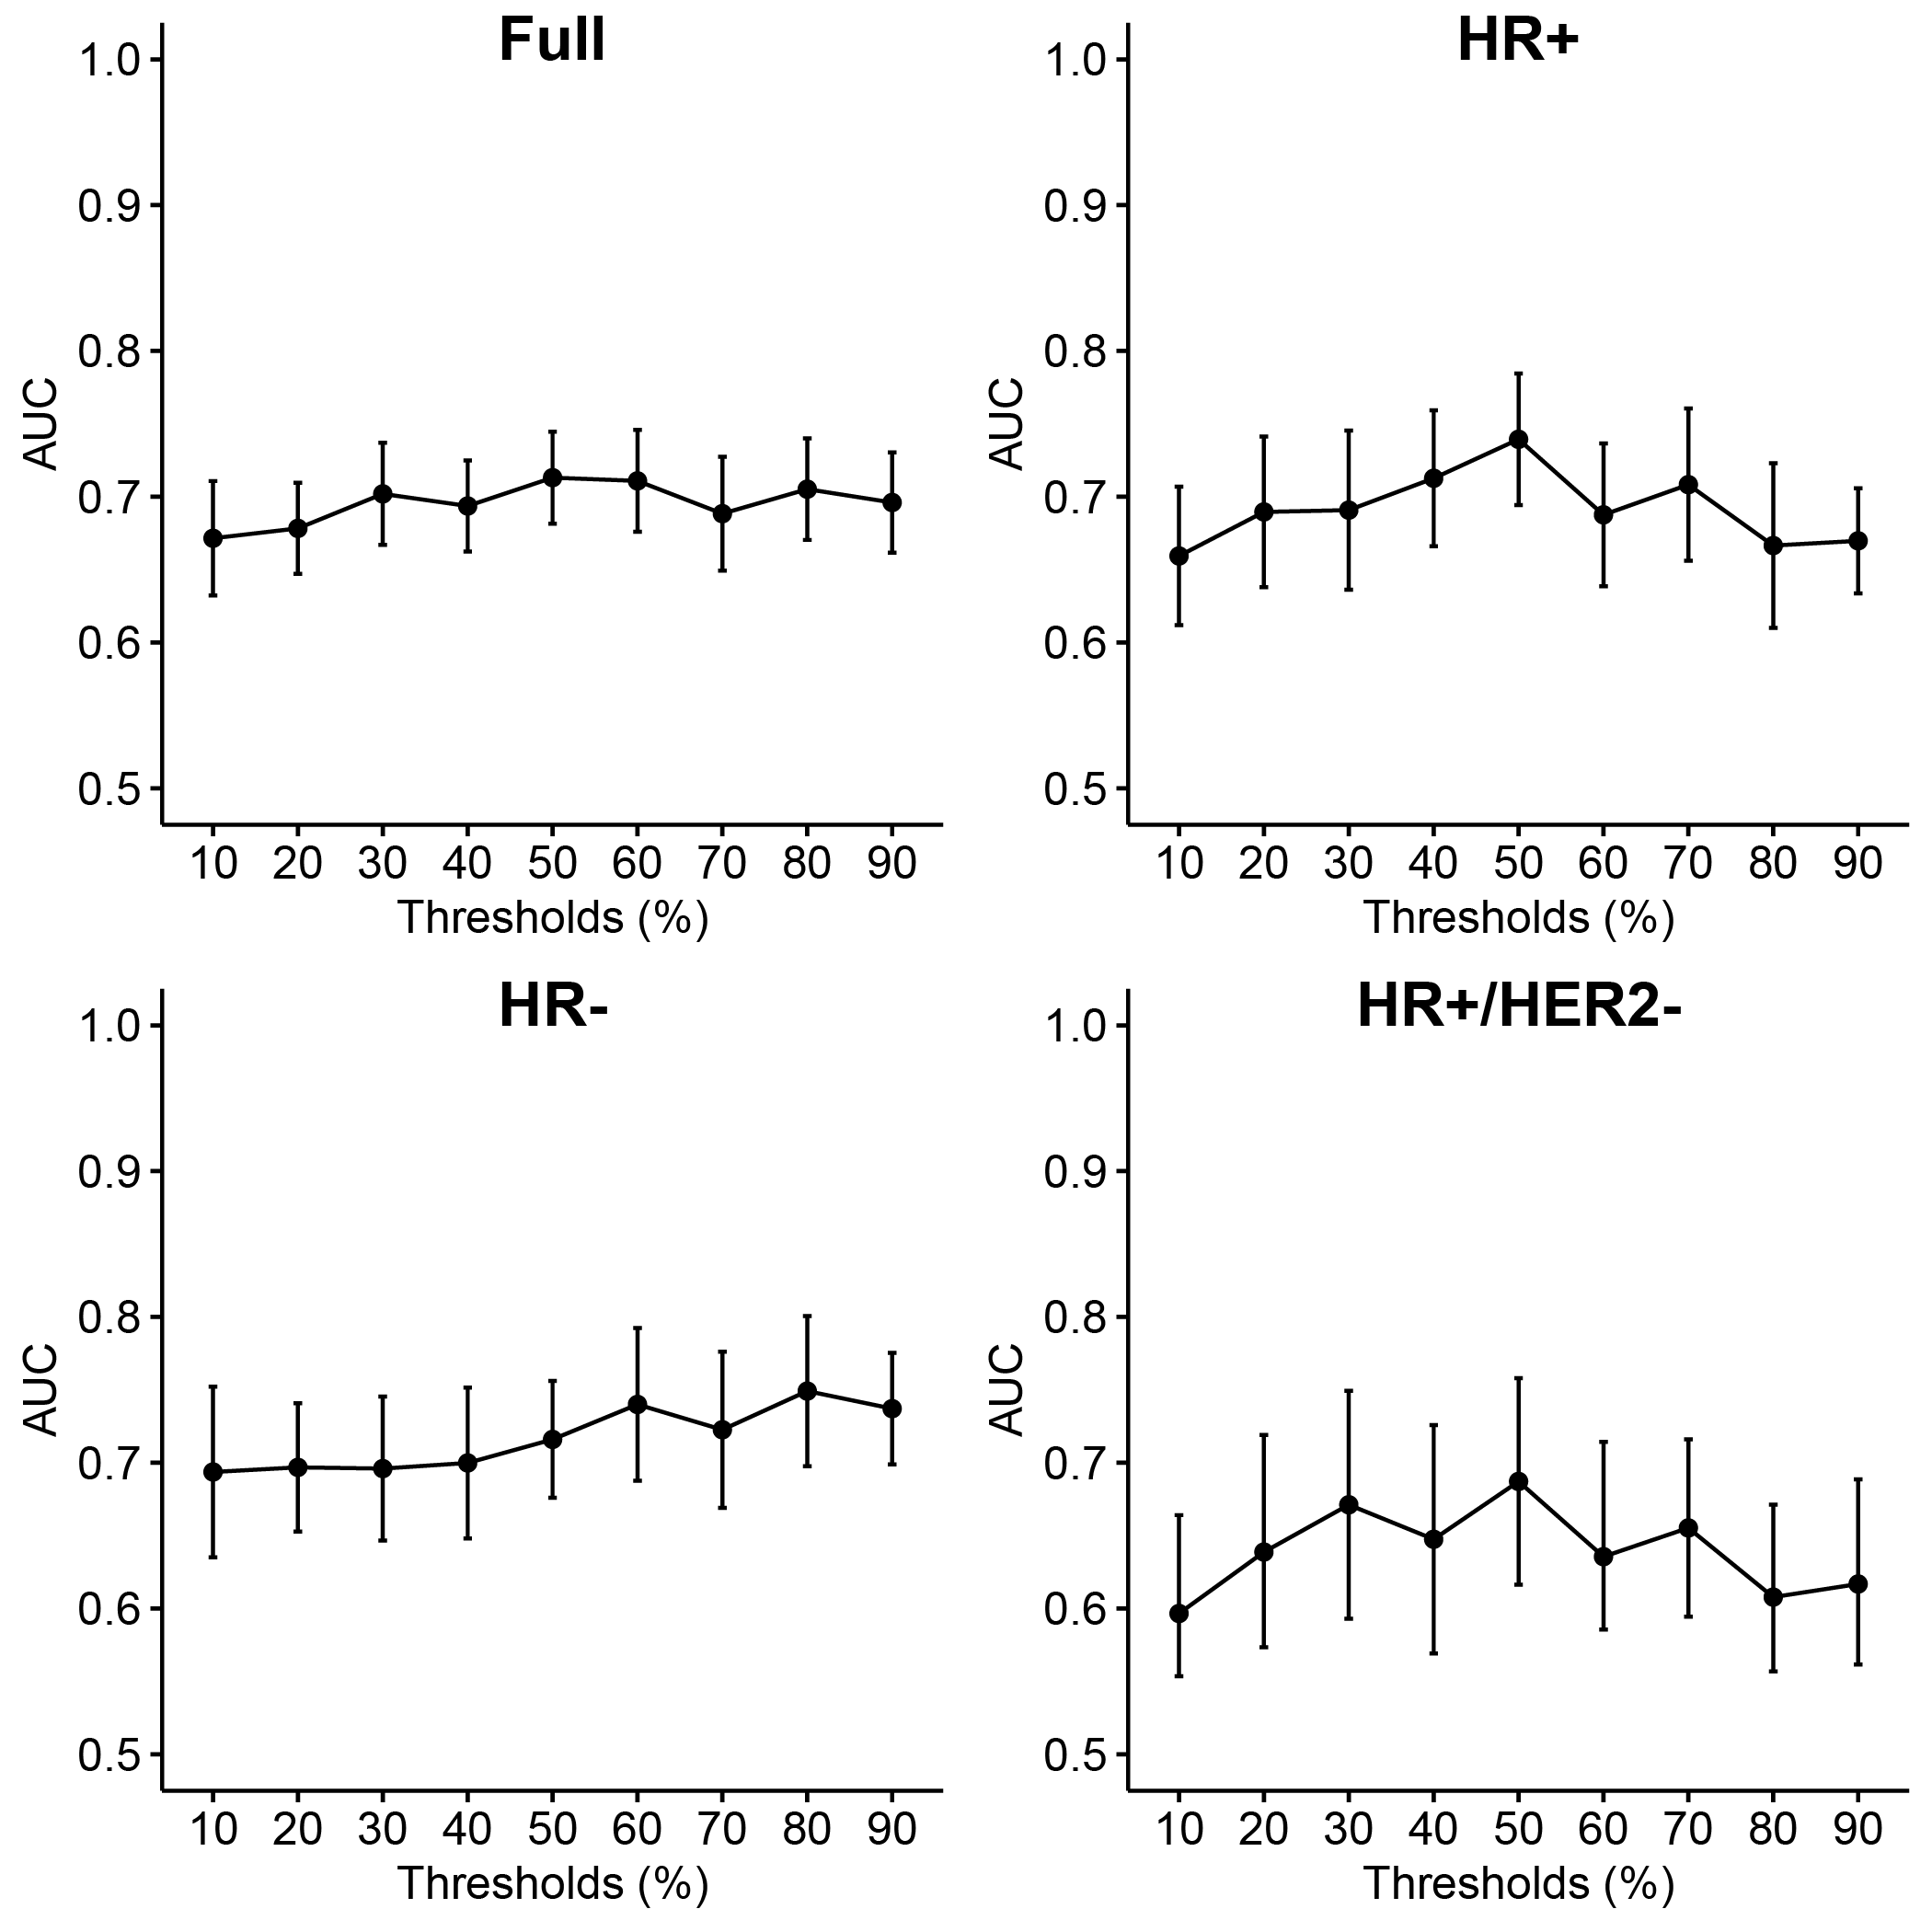
Figure 2: Random forest fit quality as a function of PE thresholds.
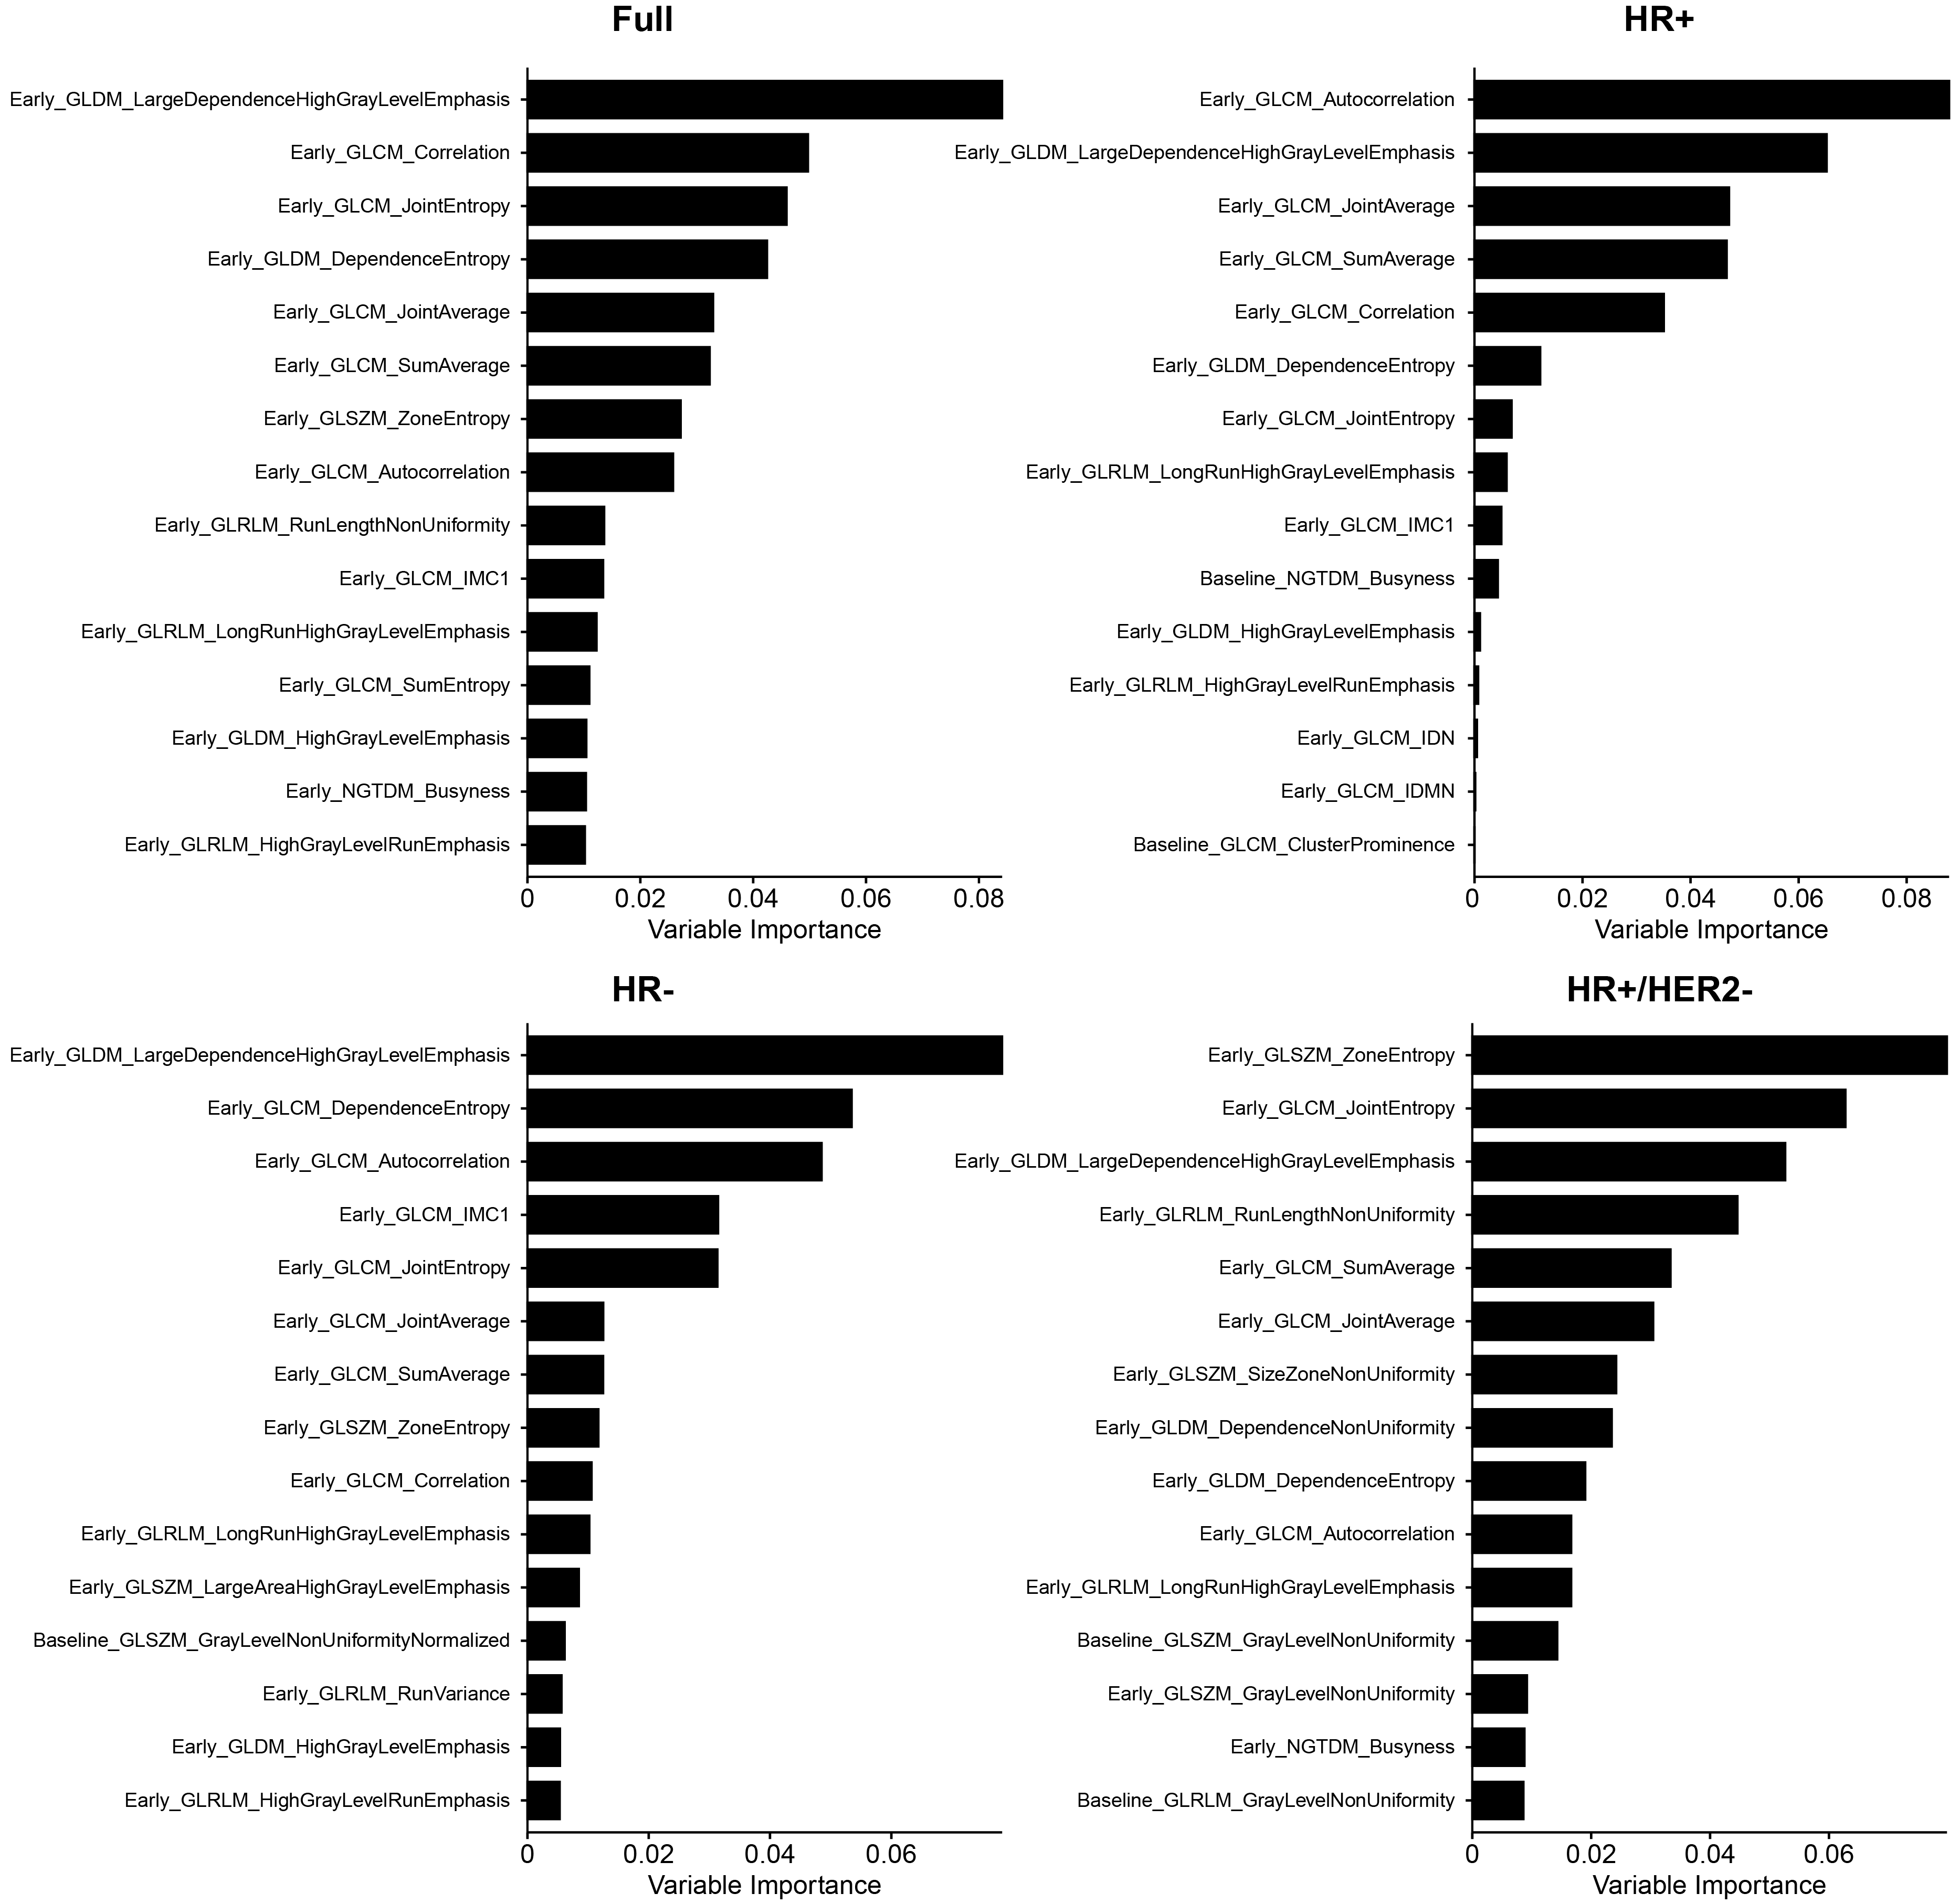
Figure 3: Elastic net variable importance plots for top 15 features. PE thresholds used for the full, HR+, HR-, and HR+/HER2- cohorts were 30%, 50%, 70%, and 60%, respectively. IMC 1 and 2 are the GLCM information measures coefficients 1 and 2; MCC is the GLCM maximum correlation coefficient; IDN and IDMN are GLCM normalized inverse difference and inverse difference moment, respectively.
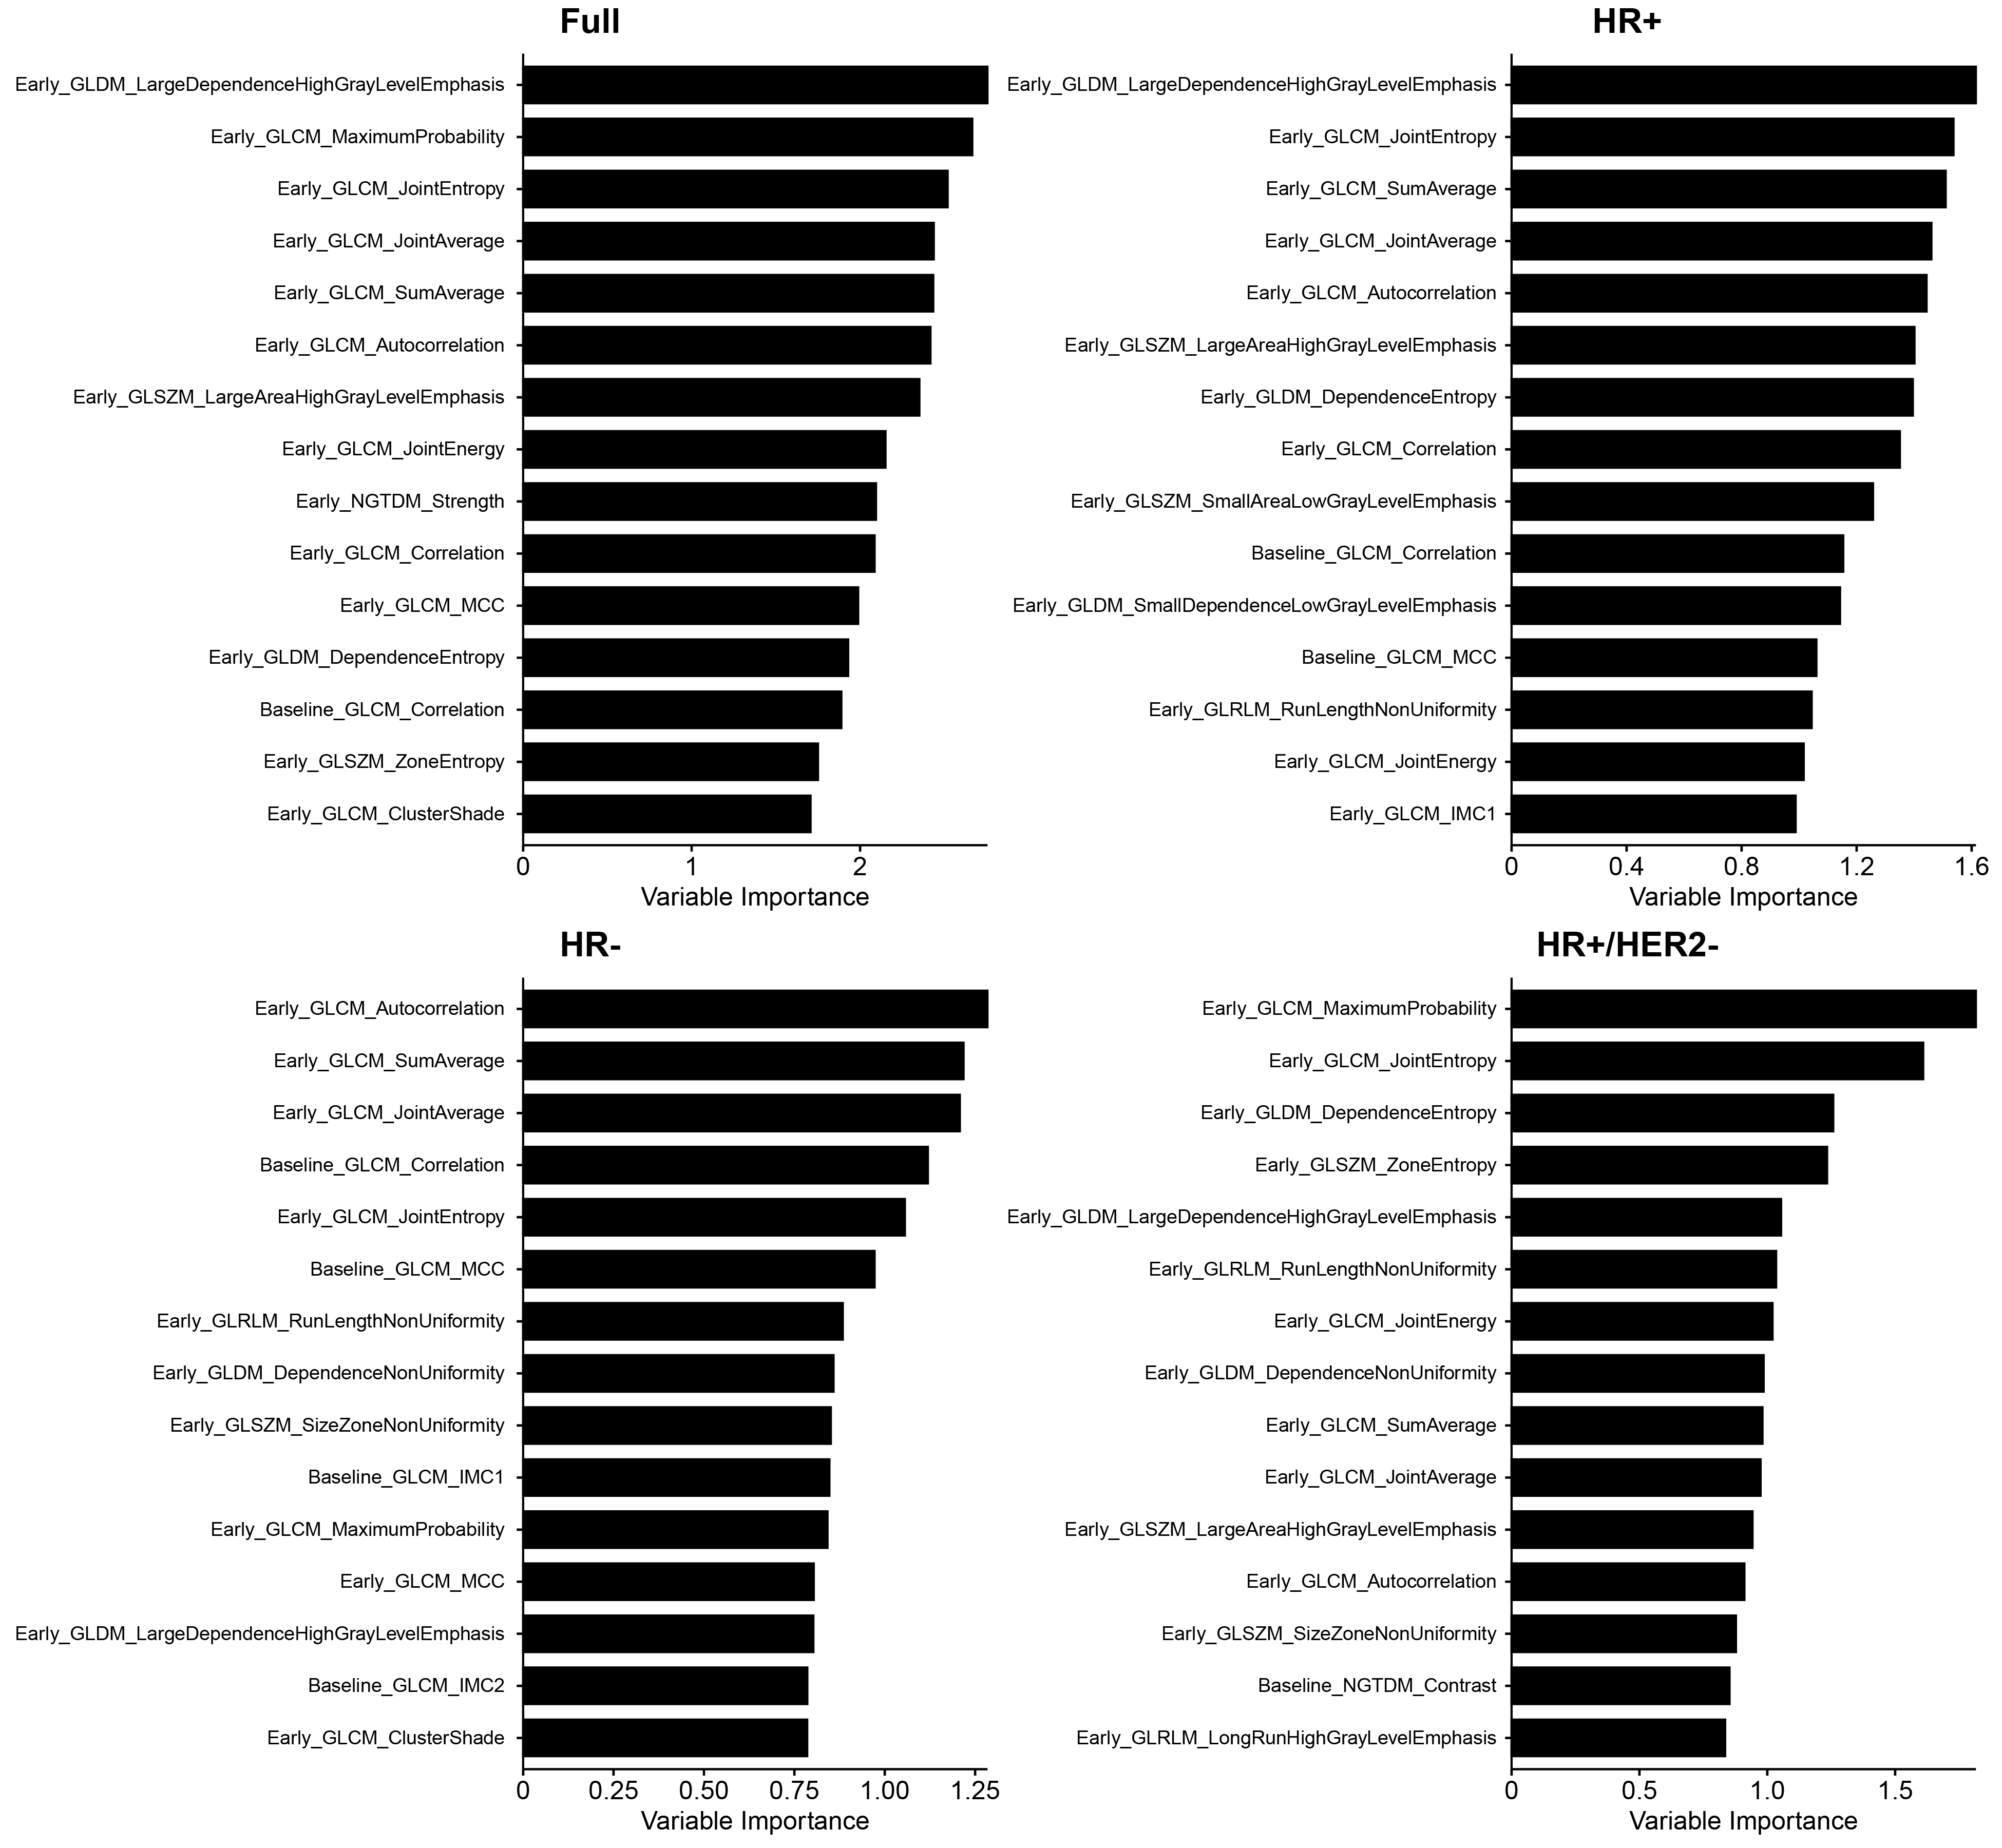
Figure 4: Random forest variable importance plots for top 30 features. PE ≥ 60% was used for HR+/HER2-, and PE ≥ 50% was used for the other cohorts. IMC 1 and 2 are the GLCM information measures coefficients 1 and 2; MCC is the GLCM maximum correlation coefficient.
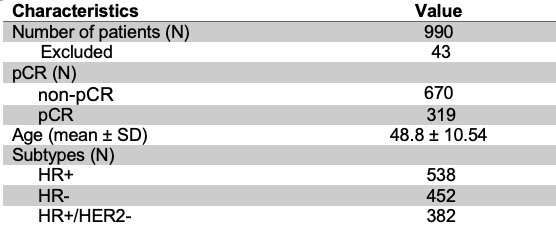
Table 1: Summary of clinical demographics for study cohort