0121
Visualizing the cerebellar cortical layers with prospective motion correction1Spinoza Center, Amsterdam, Netherlands, 2Philips Healthcare, Copenhagen, Denmark, 3Danish Research Centre for Magnetic Resonance, Centre for Functional and Diagnostic Imaging and Research, Copenhagen University Hospital, Hvidovre, Denmark
Synopsis
The cerebellar cortical microstructure is important for several functions, like motor control, but remain largely underexplored in vivo due to its small thickness. Here, we combined a susceptibility-weighted acquisition with in-plane resolution of just 0.2x0.2mm2 at 7Tesla along with a fat-navigator-based prospective motion correction. Using this setup, the cerebellar layers could be seen in the phase images of all 4 MRI-naive participants. Our results show that the cerebellar layers can be consistently visualized opening new neuroscientific and clinical dimensions.
Introduction
The human cerebellum is involved in a wide array of functions, ranging from motor control to executive functions and, as such, is of big neuroscientific interest1. These functions are achieved through a layer organization in the cerebellar cortex (granular, Purkinje and molecular), similar to the six cerebral cortical layers. However, these thin cerebellar layers are unexplored in vivo, except for exactly a single study that showed layer structures in high-resolution phase images, taking advantage of their different susceptibility profile2. This is the case because these structures are thin (~250μm) and are therefore swamped by blurriness introduced by involuntary motion. Motion-correction techniques have shown promise in increasing the effective resolution3. Here, we employed a high-resolution susceptibility-weighted scan along with a fat-navigator based prospective-motion-correction (PMC) technique4 that reacquires high-motion shots and updates the field-of-view online, to explore if the cerebellar layers can be consistently visualized.Methods
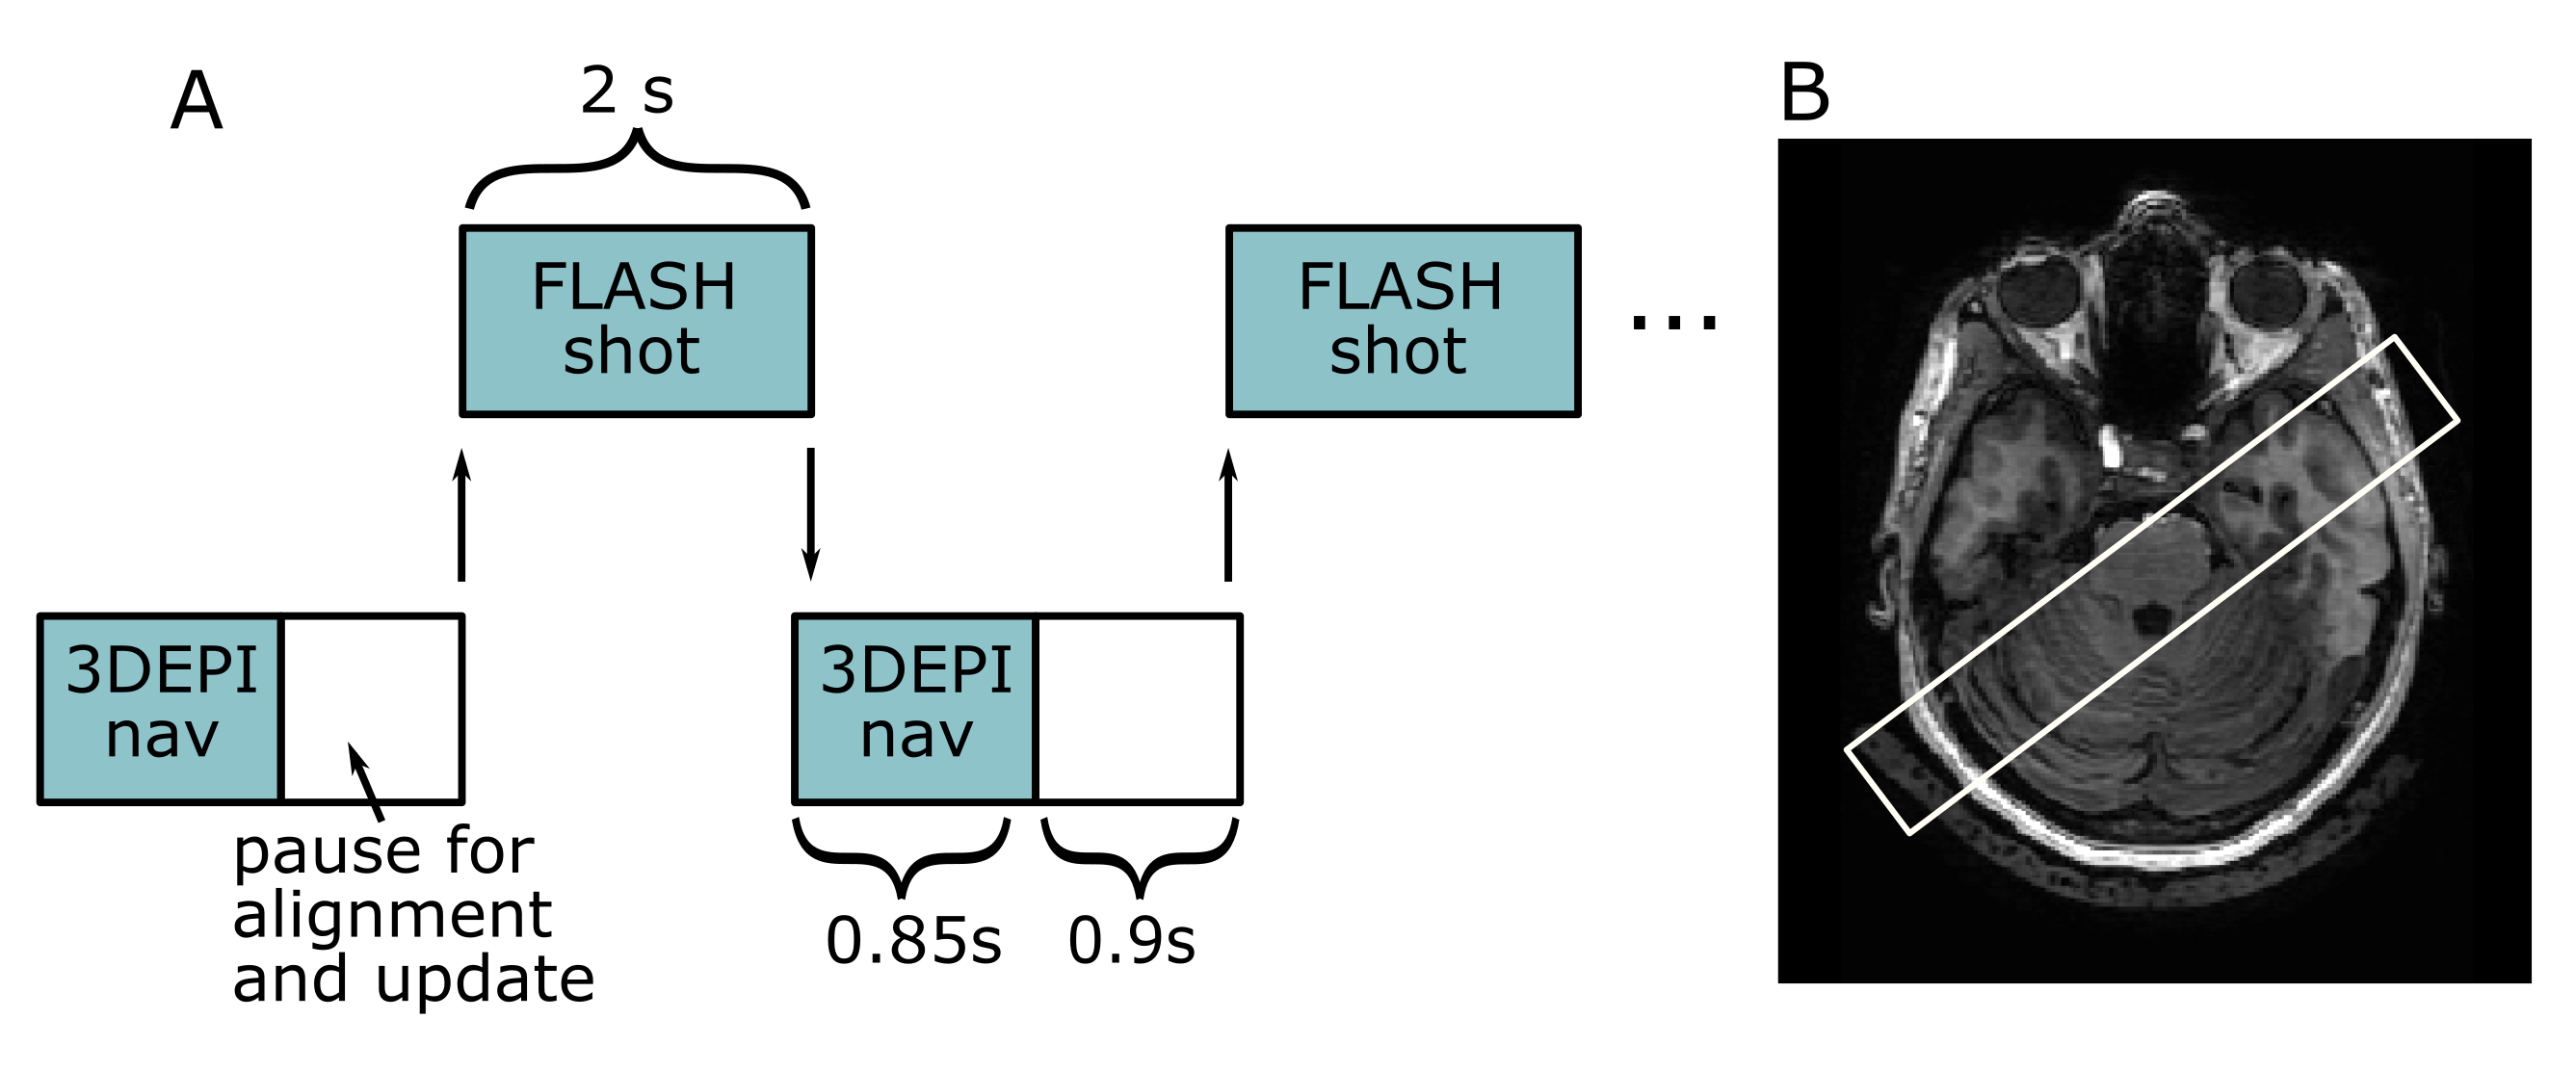
Four healthy and MRI-naive volunteers were scanned in a whole body 7T (Philips Achieva, Best, the Netherlands), with a 2Tx/32Rx whole-head coil (Nova Medical) and dielectric pads to improve B1 uniformity in the cerebellum5. Two turbo-FLASH scans (FOV=15x210x210mm3, TE/TR=20/37.12ms, flip-angle=13o, voxel-size=0.2x0.2x1mm3, SENSEy/z=1.5/1, TFL-shot=2s, TATFL=8min, TAtotal=~12min) were interleaved (Figure 1A) with fat-navigators (3D-EPIs with a fat-selective binomial excitation pulse; FOV=240x240x160mm3, voxel-size=2mm isotropic, TE/TR/TAvolume=1.88/5.65/850ms, flip-angle=1o, SENSEy/z=4 /2)3. For the first scan, the PMC algorithm was employed and shots with movement larger than 0.5mm (on the surface of sphere of 64mm4,6) were reacquired. For one participant, a dual-echo turbo-FLASH (FOV=210x210x15mm3, TE1/TE2/TR=15/42/57.12ms, flip-angle=12o, voxel-size=0.2x0.2x1mm3, SENSEy/z=1.5/1, TATFL-SHOT=4s) interleaved with the above fat-navigators was further collected (TAtotal=18min). An MPRAGE was acquired (FOV=200x220x180mm3, voxel-size=0.9mm isotropic, TR/TE=150ms/3ms, flip-angle=7o, SENSEy/z=2/2.5, TI=1300ms) as a reference, so that the slice selection direction of the high-resolution turbo-FLASHs was placed parallel to the layers of the cerebellar cortex (Figure 1B).The scans were visually inspected for motion-related signal variation, by examining the motion traces of the navigators and finally by calculating the Average Edge Strength (AES), a measure of image sharpness7.
FSL-BET was used to mask the brain and Laplacian unwrapping to unwrap the tissue phase. The vSHARP algorithm was used for background field elimination8 and QSM images were reconstructed using α and λ chosen with L-curve9. A T2* map was fitted to the dual-echo data using linear least-squares.
Results
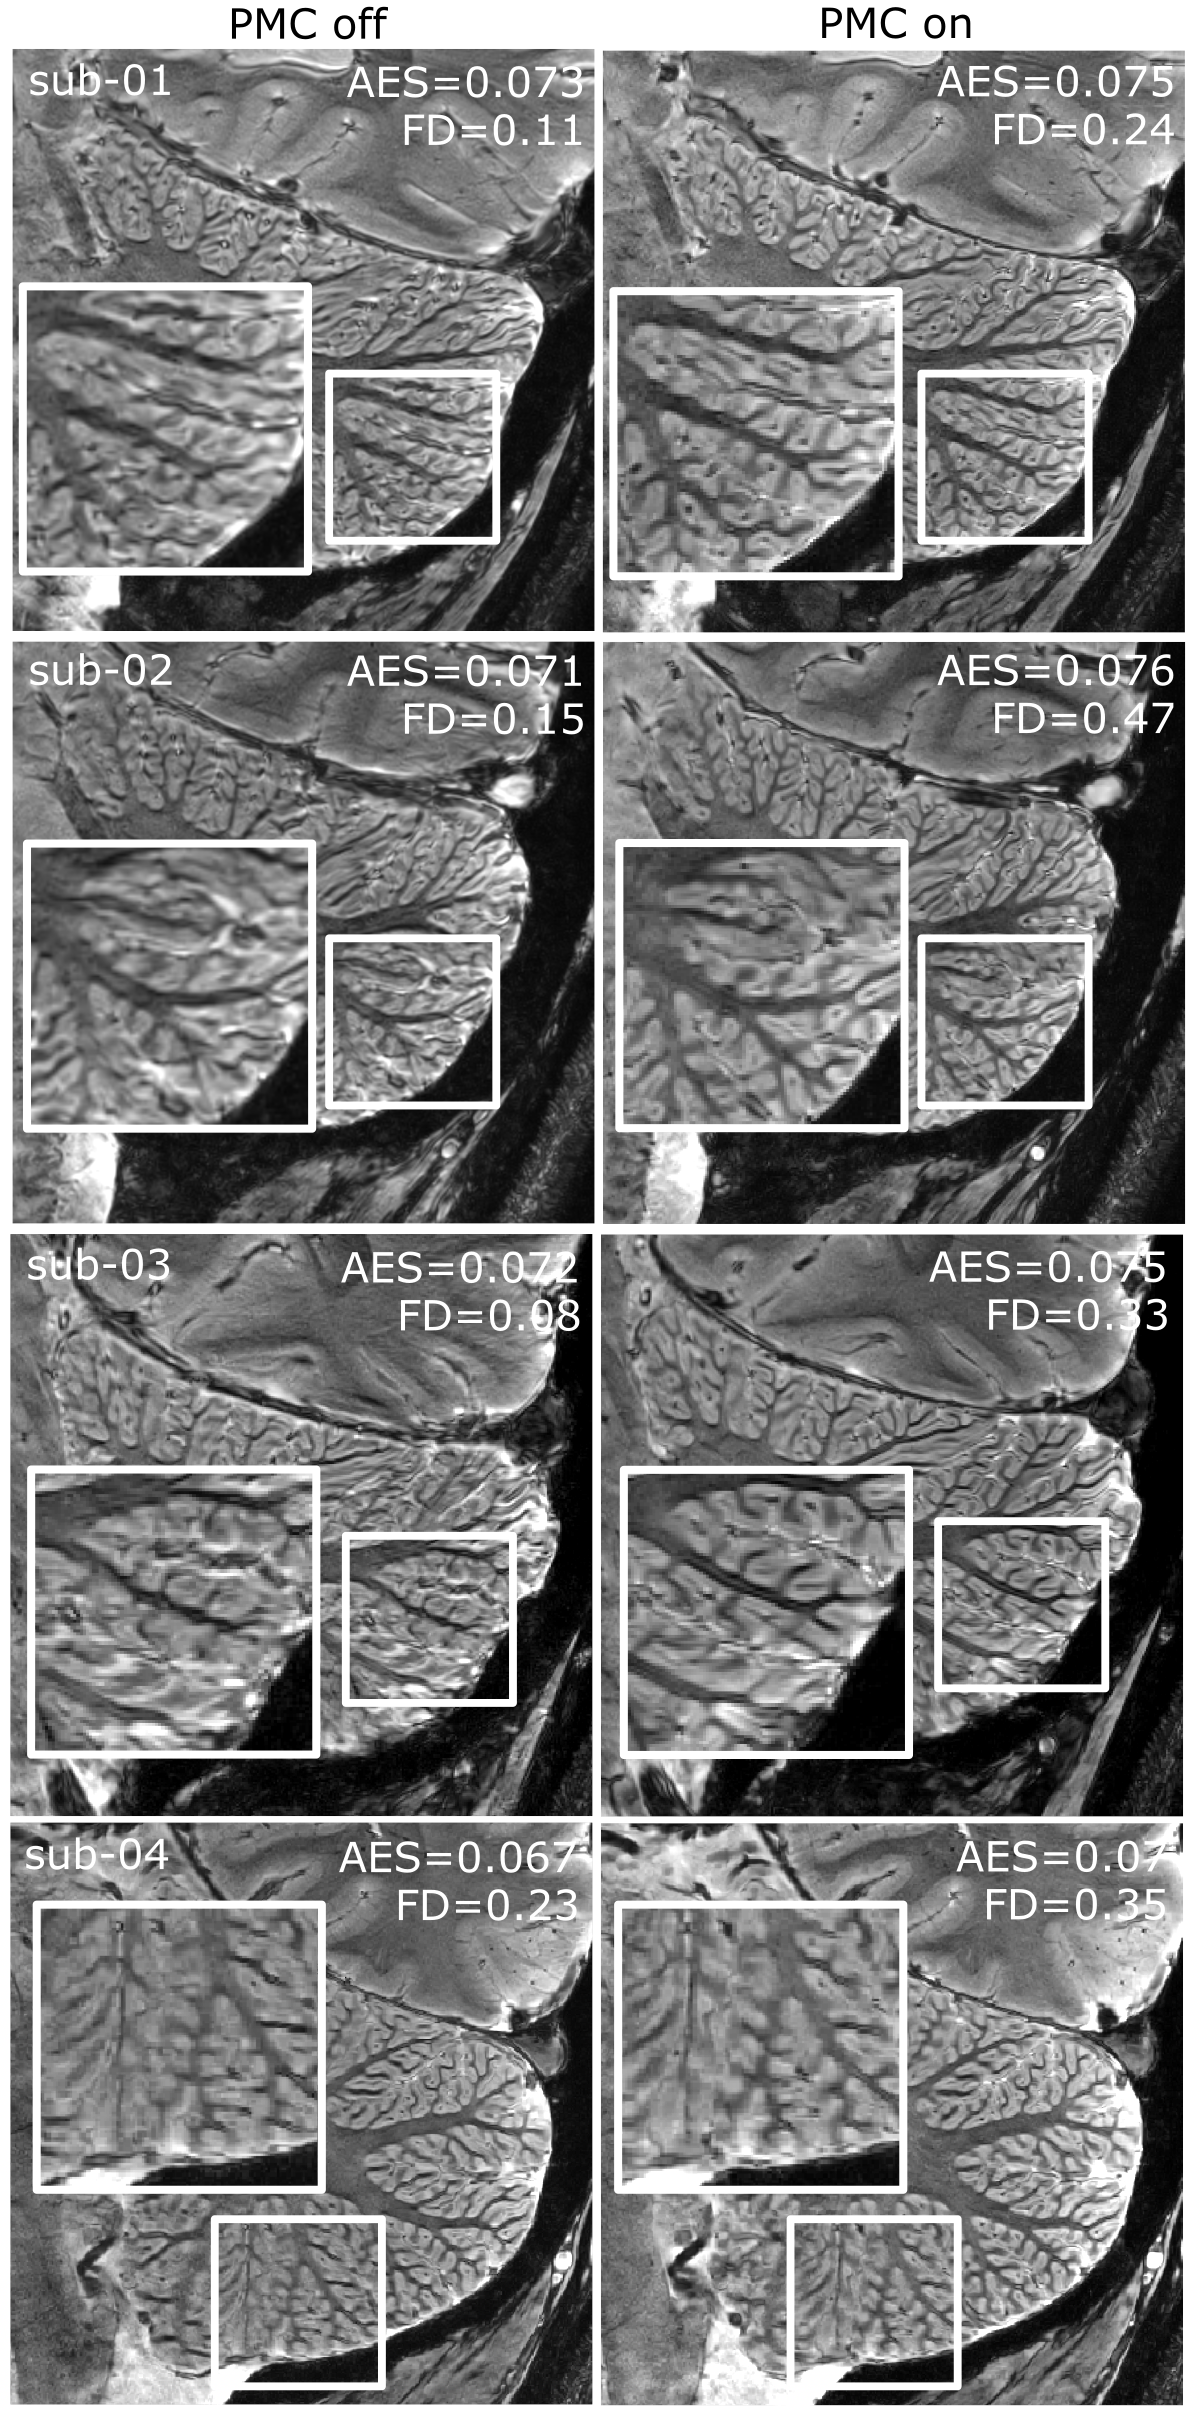
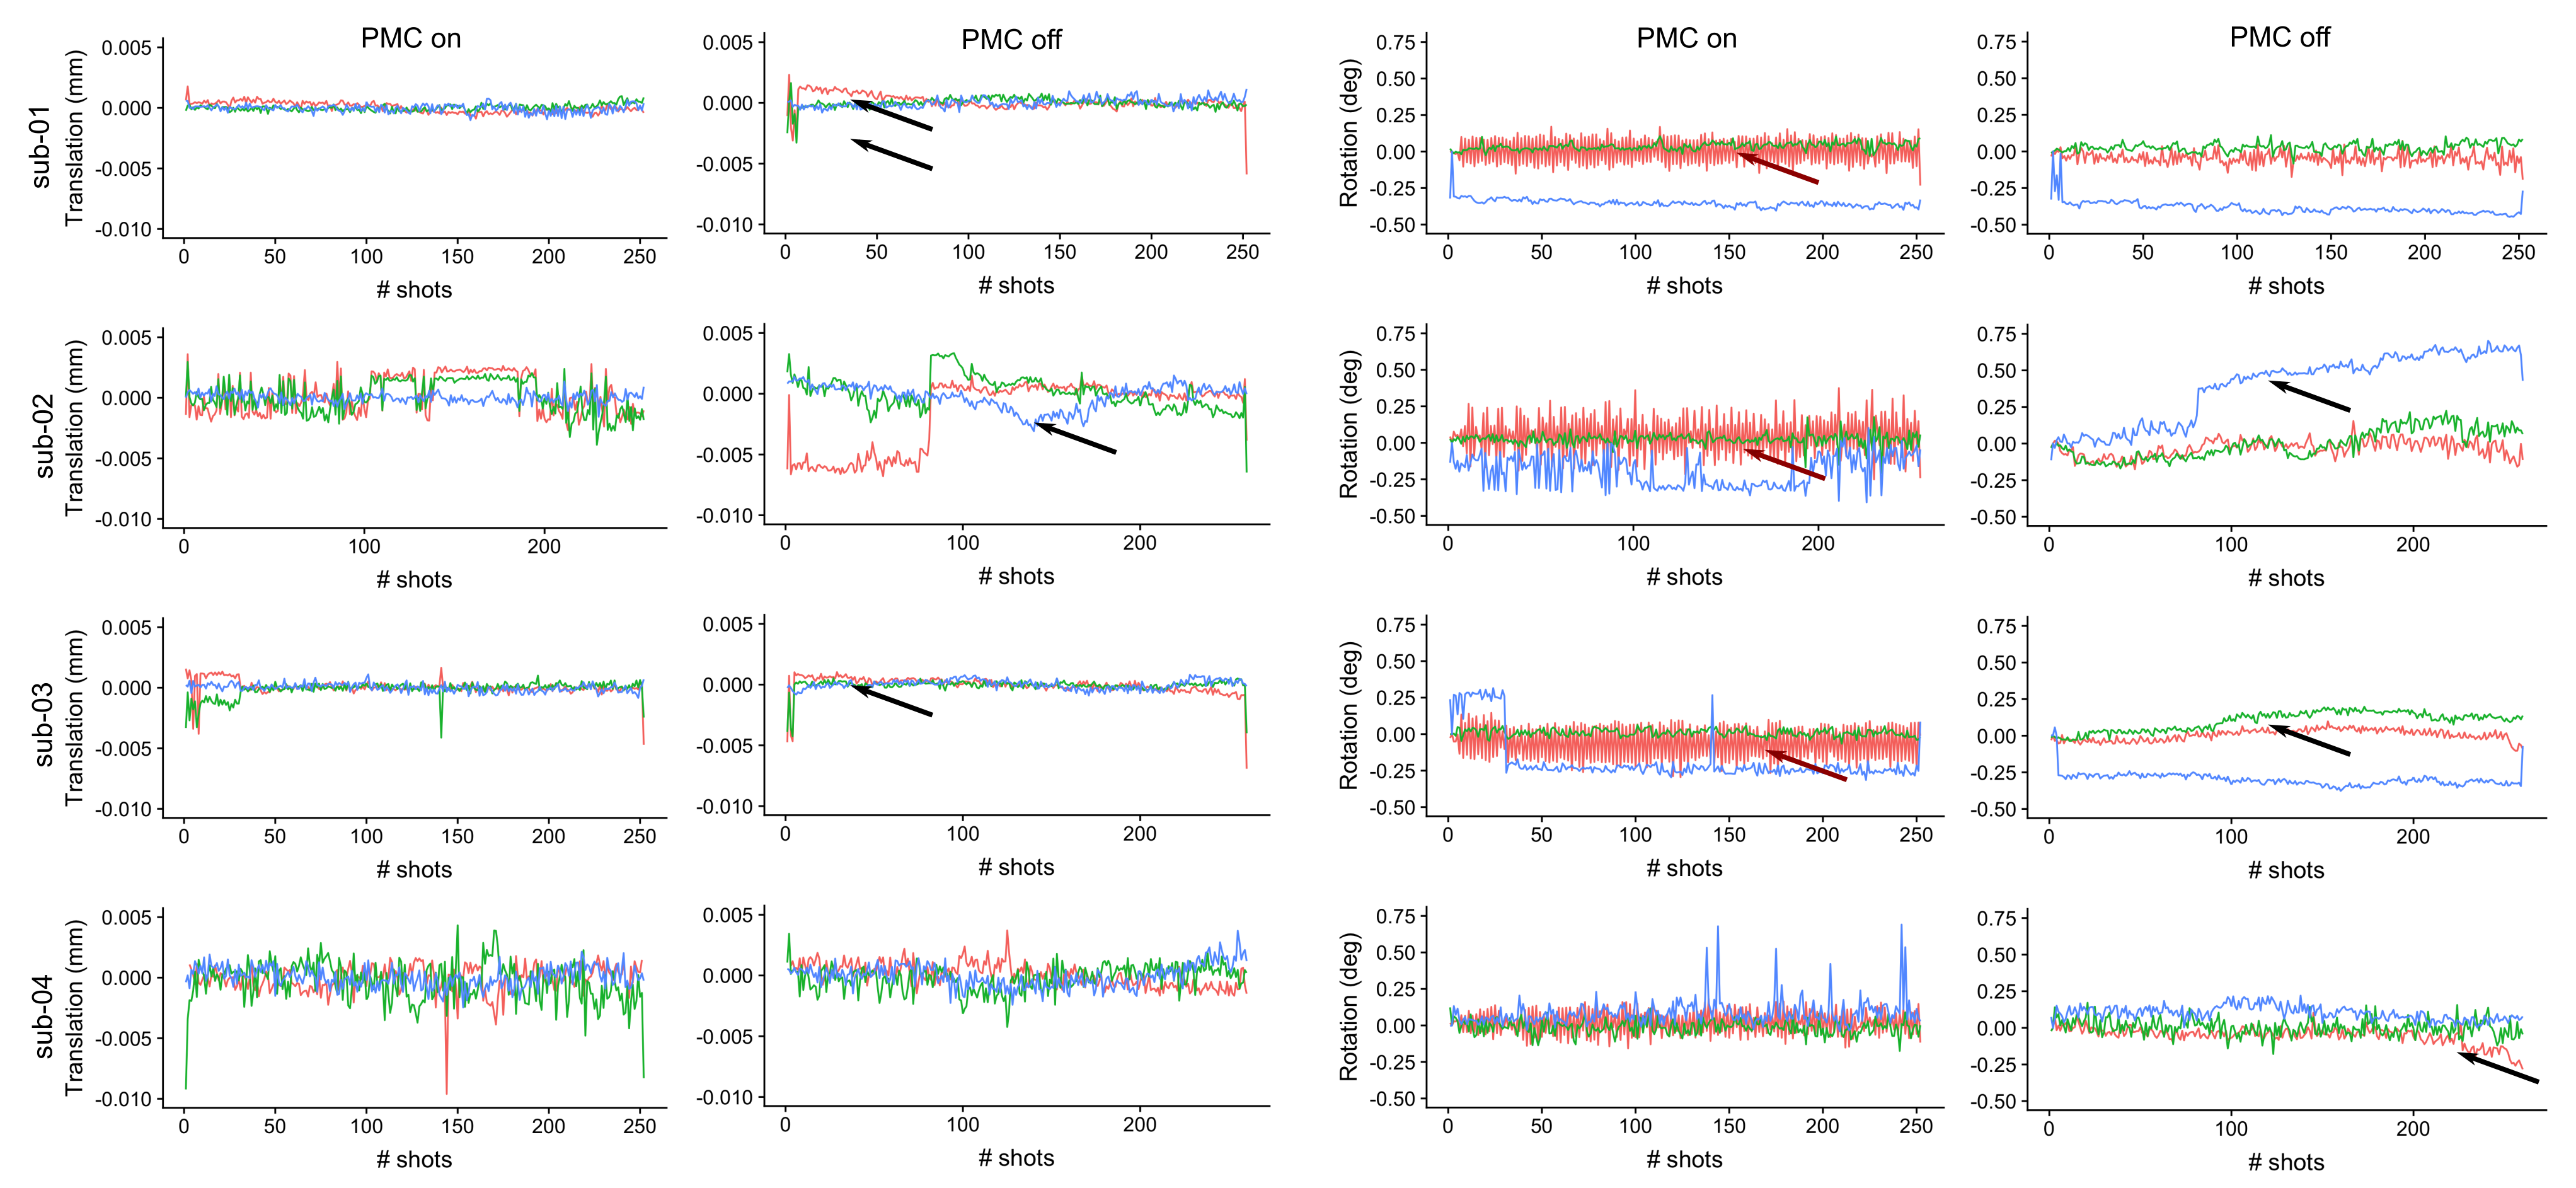
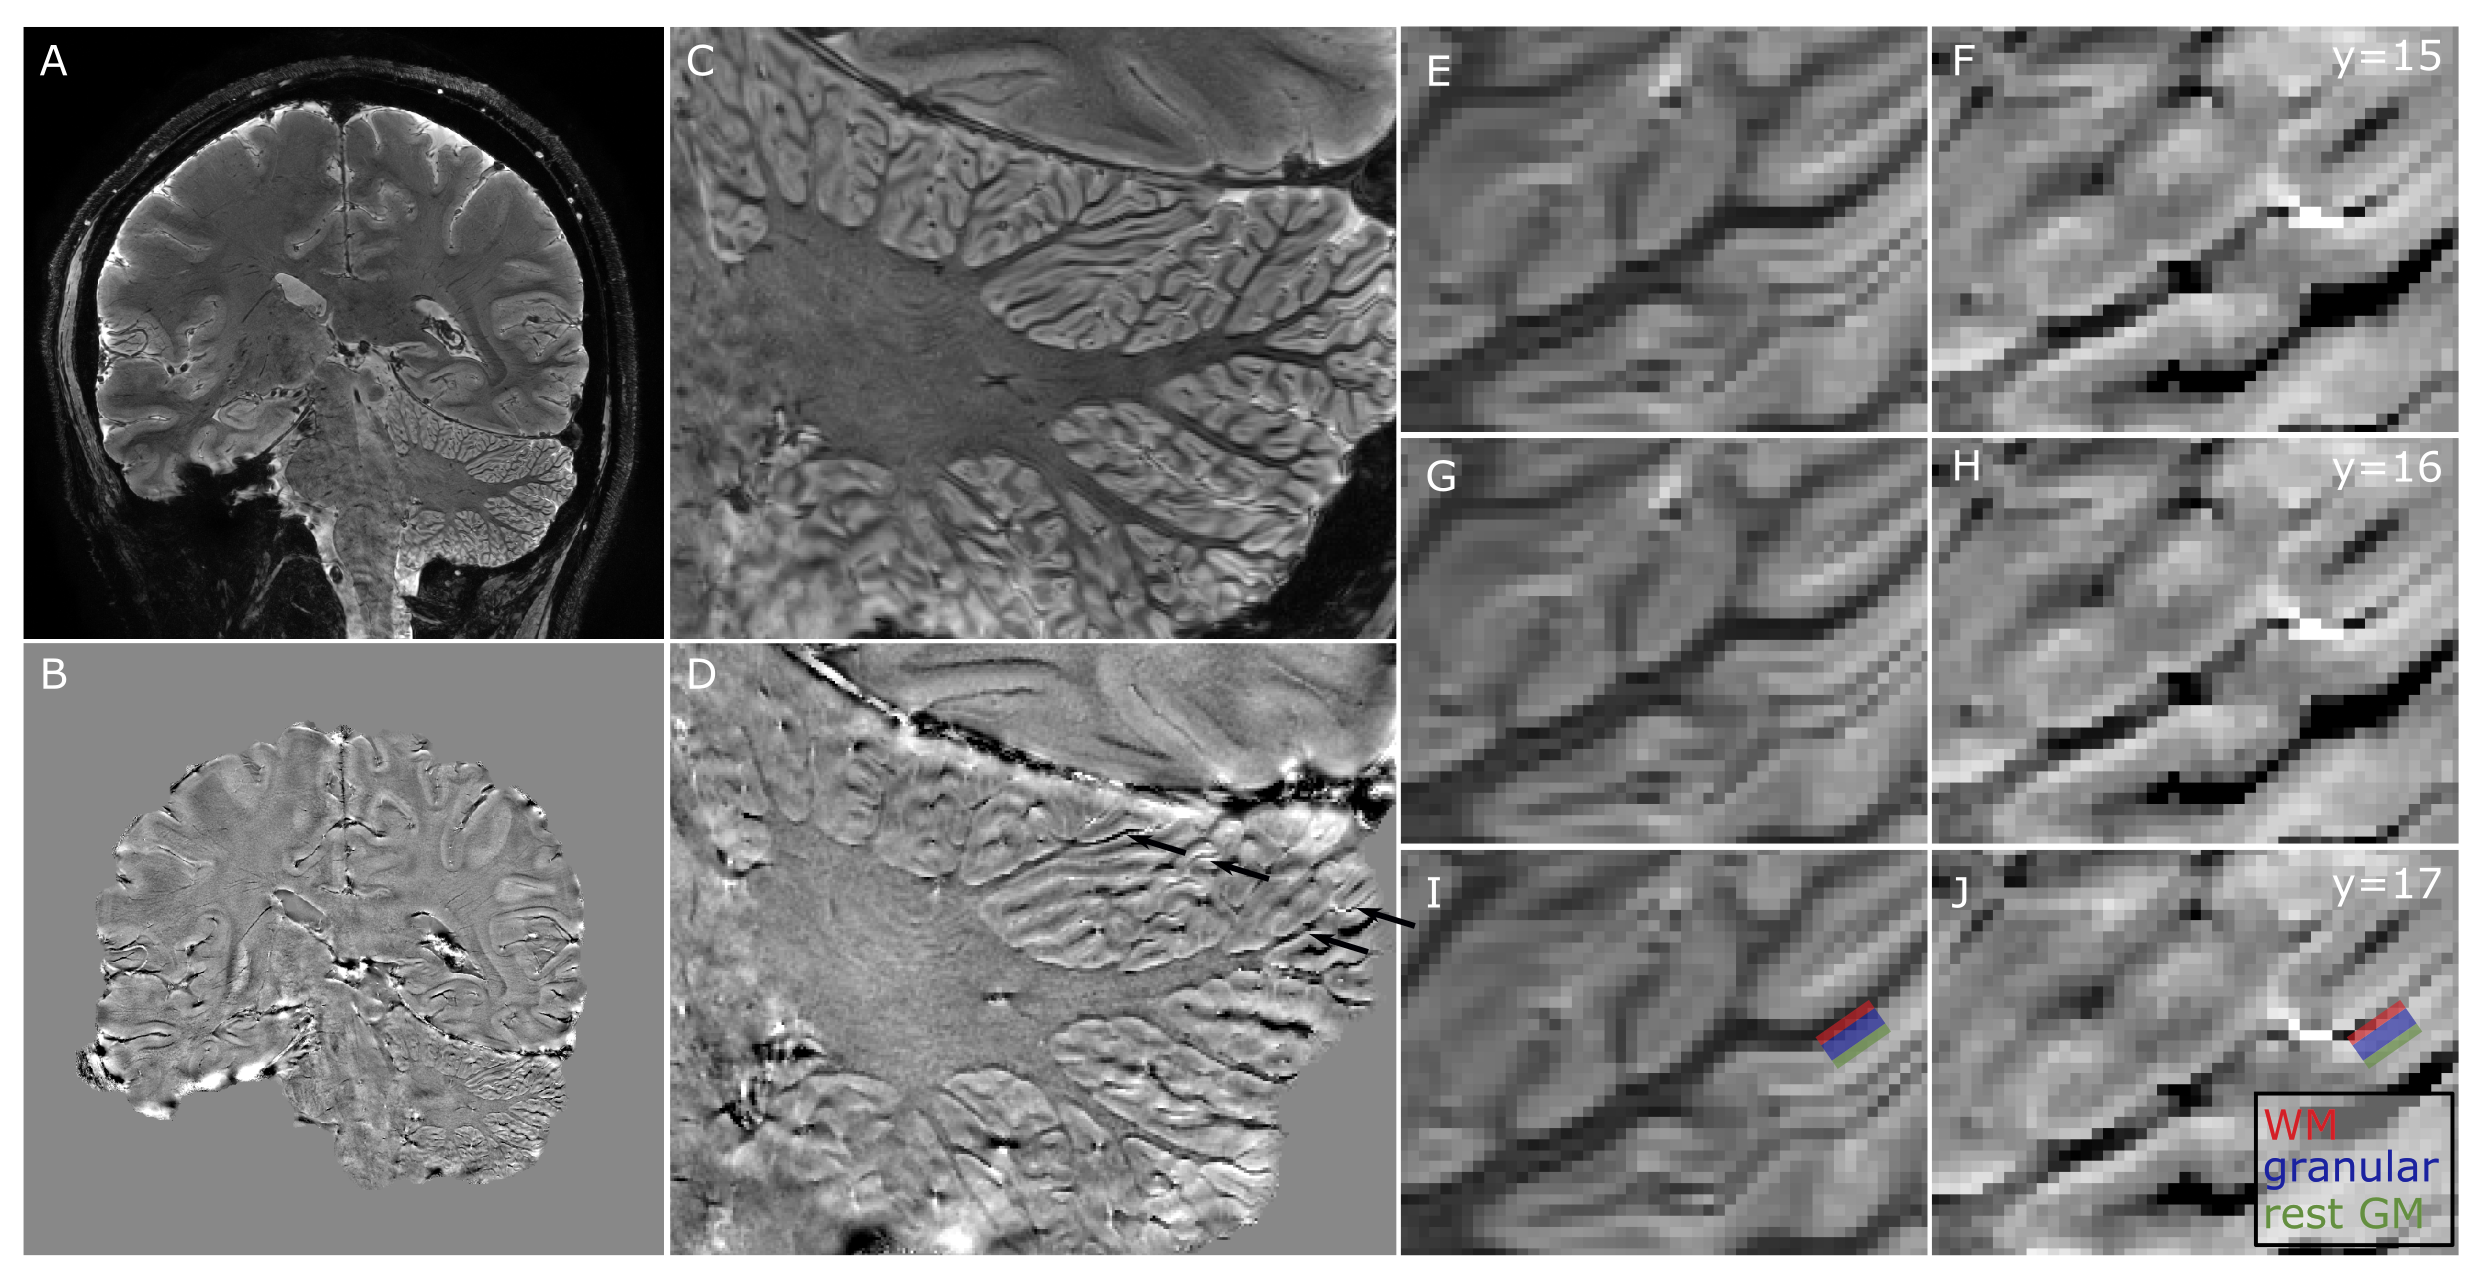
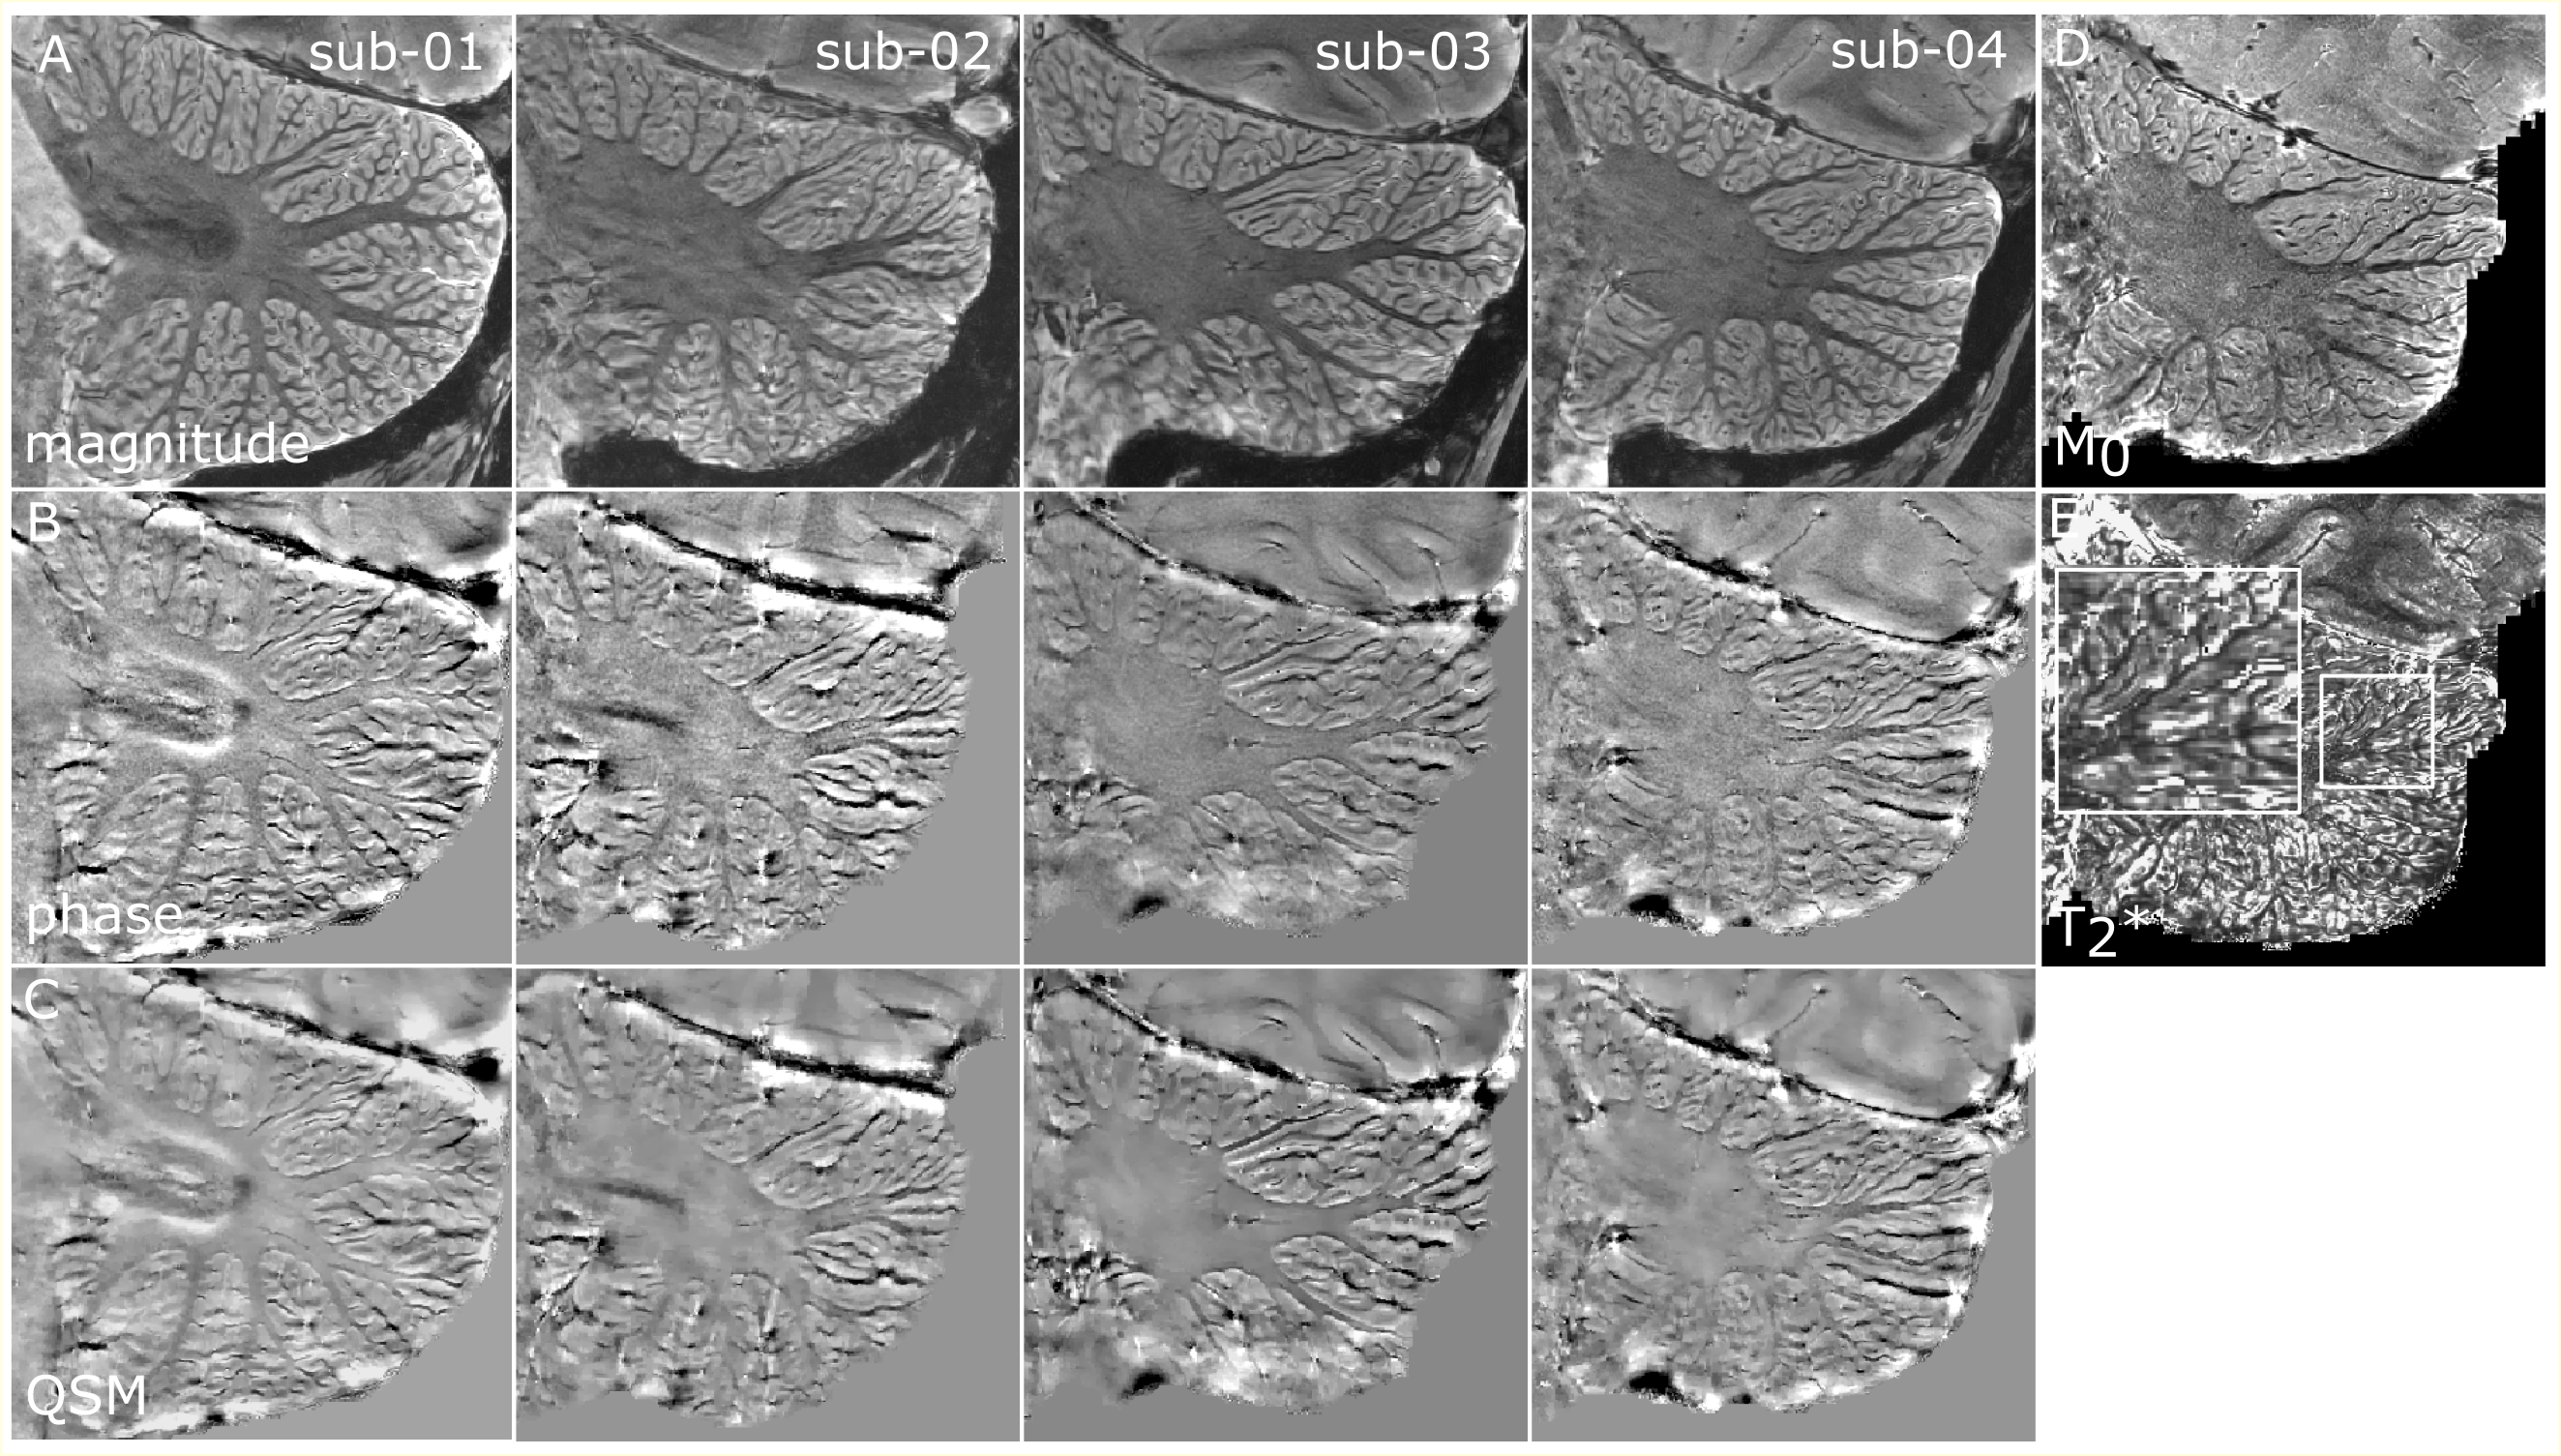
PMC improved the image quality in all participants (Figure 2). The motion traces of the fat-navigators showed less slow drifts during the PMC scans (Figure 3). Some oscillations were observed in the x-axis (Figure 3, red arrows), which was reflected in an increased frame-wise displacement in the PMC-corrected fat-navigators (FD in Figure 2). Despite this, the image sharpness when using PMC was consistently higher (AES in Figure 2).The cerebellar gray matter showed bright compared to the white matter bundles in phase images. Within the grey matter, two layers could be discerned, with the inner one that showed a positive frequency shift likely being the granular layer (Figure 4). These layers could be observed for all participants and in the QSM images (Figure 5).
ROIs were drawn manually in the phase and magnitude image (example colored stripes in Figure 4) to confirm that this layer is in grey matter. The identified granular layer showed M0 (M0=27.6) similar to that of the rest of the grey matter (M0=29.85) and higher than the adjacent white matter (M0=21.23), but shorter T2* values (T2*=36.31ms) than the adjacent white (T2*=39.79ms) and grey matter (T2*=41.75ms).
Discussion
In this study, PMC-corrected 7T MRI at 200μm in-plane resolution allowed the visualization of the cerebellar cortical layers. The PMC improved the image quality in this cohort of healthy participants, though some oscillations were observed on one axis (nodding), potentially respiration-related. Higher navigator sampling-rate may ameliorate this in future work at the cost of longer scan times10. Compared to other approaches, fat-navigators require no extra equipment, are easily implemented, can be greatly accelerated and are easily adjusted resolution and acquisition-time wise4,6.Similar to the cerebral cortex11, the cerebellar layers are expected to have a differential susceptibility profile, due to the iron concentration in the granular layer12. In accordance to this, we detected consistent stripes of positive frequency shift and shorter T2* adjacent, but not overlapping the cerebellar white matter. These stripes were detectable in all four individuals and over multiple slices.
Unlike phase images, QSM are not sensitive to blooming artifacts and B0-orientation effects13. Despite the added spatial deconvolution, the cerebellar layer visualization was largely retained in the QSM images, which may further allow the quantification of layer-specific cerebellar disease patterns, particularly if iron regulation is affected12.
Due to PMC, the layers were visible in all the (MRI-naïve) participants. This, coupled with the convenience of a ready-to-use image, makes PMC-corrected cerebellar layer imaging highly relevant for clinical usage. The excellent grey-white matter in the magnitude images may also allow improved segmentation and cortical thickness measures. No obvious respiratory artifacts were visible in the cerebellum in this 3D scan, though a larger FOV (e.g. of the whole cerebellum) may render them obvious.
Conclusion
The cerebellar cortical microstructure is crucial but largely underexplored. By combining PMC and high-resolution susceptibility-based imaging we demonstrate that they can be reproducibly imaged for neuroscientific and clinical imaging.Acknowledgements
No acknowledgement found.References
1. Stoodley CJ, Schmahmann JD. Functional topography of the human cerebellum. Handbook of clinical neurology. 2018;154:59-70.
2. Marques JP, van der Zwaag W, Granziera C, Krueger G, Gruetter R. Cerebellar cortical layers: in vivo visualization with structural high-field-strength MR imaging. Radiology. 2010;254(3):942-948.
3. Bazin PL, Nijsse HE, van der Zwaag W, et al. Sharpness in motion corrected quantitative imaging at 7T. Neuroimage. 2020;222:117227.
4. Andersen M, Björkman-Burtscher IM, Marsman A, Petersen ET, Boer VO. Improvement in diagnostic quality of structural and angiographic MRI of the brain using motion correction with interleaved, volumetric navigators. PloS one. 2019;14(5):e0217145.
5. Teeuwisse WM, Brink WM, Webb AG. Quantitative assessment of the effects of high-permittivity pads in 7 Tesla MRI of the brain. Magn Reson Med. 2012;67(5):1285-1293.
6. Tisdall MD, Hess AT, Reuter M, Meintjes EM, Fischl B, van der Kouwe AJ. Volumetric navigators for prospective motion correction and selective reacquisition in neuroanatomical MRI. Magn Reson Med. 2012;68(2):389-399.
7. Zaca D, Hasson U, Minati L, Jovicich J. Method for retrospective estimation of natural head movement during structural MRI. J Magn Reson Imaging. 2018.
8. Li W, Wu B, Liu C. Quantitative susceptibility mapping of human brain reflects spatial variation in tissue composition. Neuroimage. 2011;55(4):1645-1656.
9. Bilgic B, Fan AP, Polimeni JR, et al. Fast quantitative susceptibility mapping with L1-regularization and automatic parameter selection. Magn Reson Med. 2014;72(5):1444-1459.
10. Gallichan D, Marques JP, Gruetter R. Retrospective correction of involuntary microscopic head movement using highly accelerated fat image navigators (3D FatNavs) at 7T. Magn Reson Med. 2016;75(3):1030-1039.
11. Duyn JH. Studying brain microstructure with magnetic susceptibility contrast at high-field. Neuroimage. 2018;168:152-161.
12. Patel BN, Dunn RJ, Jeong SY, Zhu Q, Julien JP, David S. Ceruloplasmin regulates iron levels in the CNS and prevents free radical injury. The Journal of neuroscience : the official journal of the Society for Neuroscience. 2002;22(15):6578-6586.
13. Wang Y, Spincemaille P, Liu Z, et al. Clinical quantitative susceptibility mapping (QSM): Biometal imaging and its emerging roles in patient care. J Magn Reson Imaging. 2017;46(4):951-971.
Figures