0118
Five-Dimensional Quantitative Low-Dose Multitasking Dynamic Contrast- Enhanced MRI (LD-MT-DCE): Preliminary Study on Breast Cancer
Nan Wang1,2, Yibin Xie1, Zhaoyang Fan1,2, Sen Ma1,2, Rola Saouaf3, Yu Guo1,4, Stephen L. Shiao5,6, Anthony G. Christodoulou1,2, and Debiao Li1,2
1Biomedical Imaging Research Institute, Cedars Sinai Medical Center, Los Angeles, CA, United States, 2Department of Bioengineering, University of California, Los Angeles, Los Angeles, CA, United States, 3Department of Imaging, Cedars Sinai Medical Center, Los Angeles, CA, United States, 4Department of Radiology, Tianjin First Central Hospital, Tianjin, China, 5Department of Radiation Oncology, Cedars-Sinai Medical Center, Los Angeles, CA, United States, 6Biomedical Sciences, Division of Immunology, Cedars-Sinai Medical Center, Los Angeles, CA, United States
1Biomedical Imaging Research Institute, Cedars Sinai Medical Center, Los Angeles, CA, United States, 2Department of Bioengineering, University of California, Los Angeles, Los Angeles, CA, United States, 3Department of Imaging, Cedars Sinai Medical Center, Los Angeles, CA, United States, 4Department of Radiology, Tianjin First Central Hospital, Tianjin, China, 5Department of Radiation Oncology, Cedars-Sinai Medical Center, Los Angeles, CA, United States, 6Biomedical Sciences, Division of Immunology, Cedars-Sinai Medical Center, Los Angeles, CA, United States
Synopsis
DCE MRI is an important technique for diagnosing breast cancer, but continues to face technical challenges and gadolinium deposition concerns. In this work, we proposed a low-dose Multitasking DCE (LD-MT-DCE) technique, enabling dynamic-T1-mapping based quantitative characterization of tumor blood flow and vascular properties with whole-breast coverage, a spatial resolution of 0.9×0.9×1.1mm3, and a temporal resolution of 1.4 s using only 20% gadolinium dose. An in vivo study showed excellent image quality and repeatability (ICC≥0.99) for LD-MT-DCE and consistent diagnosis to standard-dose clinical DCE. The kinetic parameters showed significant differences between normal breast tissue, and benign and malignant tumors.
Introduction
Dynamic contrast-enhanced (DCE) MRI is a key protocol in screening, diagnosis, and therapy evaluation of breast cancer1,2 with the great potential to evaluate tissue vascular properties3-8. However, technical challenges have prevented existing techniques from fully realizing this potential. One major difficulty is to simultaneously achieve entire-breast coverage, high spatial resolution, and sufficient temporal resolution to capture both the spatial variation and temporal kinetics3. Clinical DCE protocols usually adopt 1-mm spatial resolution with compromised temporal resolution of >60 s per phase, obscuring functional information3-5 and preventing kinetic parameter quantification. Another concern is the risk of gadolinium (Gd) retention in human body9-12; long-term clinical consequences of Gd deposition are unknown, but the benefit vs. risk of Gd-based imaging can be controversial, especially for screening.In this work, we proposed a low-dose Multitasking DCE (LD-MT-DCE) technique based on MR Multitasking13, performing dynamic T1 mapping with whole-breast coverage at a spatial resolution of 0.9×0.9×1.1 mm3 and a temporal resolution of 1.4 sec in a 10-minute continuous scan and allowing the quantification of kinetic parameters. An in vivo study was performed on 20 healthy subjects and 7 patients with breast cancer using 20% of the standard contrast agent (CA) dose.
Methods
Sequence design: A continuous-acquisition sequence with water-selective FLASH excitations in between periodic saturation recovery (SR) preparations provided multiple T1 weightings. A 3D Cartesian sampling pattern with randomized Gaussian-density reordering in both phase and partition encoding directions was used. Reconstruction: The 5D image $$$I(x,y,z,\tau,t)$$$ was represented as a three-way tensor $$$\mathcal{A}$$$ with voxel location index, an SR dimension $$$\tau$$$, and a DCE time course $$$t$$$. High image correlation along and across dimensions induces $$$\mathcal{A}$$$ to be low-rank14, allowing factorization as the product of different basis matrices representing each dimension: $$\mathcal{A}=\mathcal{G}\times_{1}\mathbf{U}\times_{2}\mathbf{V}\times_{3}\mathbf{W},$$ where the columns of $$$\mathbf{U}$$$, $$$\mathbf{V}$$$, and $$$\mathbf{W}$$$ contain basis functions for spatial, SR, and DCE dimensions, respectively, and $$$\mathcal{G}$$$ is the core tensor. The reconstruction of the final 5D images can be framed as the recovery of each basis matrix.Dynamic T1 quantification and kinetic modeling: The reconstructed 5D images contain 420 DCE phases, each consisting of a 1.4-sec SR period with 276 saturation times, permitting one T1 map per DCE phase. The 420 dynamic T1 maps were fitted jointly and the CA concentration was subsequently calculated according to relaxivity. A two-compartment exchange model (2CXM)15 was used to simultaneously evaluate plasma flow $$$F_p$$$, fractional plasma volume $$$v_p$$$, transfer constant $$$K^{trans}$$$, and fractional extravascular-extracellular space (EES) volume $$$v_e$$$.
Imaging experiment: All LD-MT-DCE data were acquired on a 3T scanner (VIDA, Siemens Medical Solutions, Germany) in transversal orientation with the following parameters: TE/TR=2.4/5.2 ms, FOV = 350x250x176 mm3, spatial resolution = 0.9x0.9x1.1 mm3, temporal resolution = 1.4 s, α=5°, scan time = 10 min. Gadavist of 20% dose (0.02 mmol/kg) was administered at the rate of 2.0 ml/s 3 minutes into the scan. The clinical DCE was performed using standard-dose Gadavist of 0.1 mmol/kg with parameters: FOV = 350x350x200 mm3, spatial resolution = 0.9x0.9x1.1 mm3, temporal resolution = 84 s, scan time = 10 min (7 phases in total).
Control study: Twenty healthy female subjects were recruited. Ten of them received two LD-MT-DCE in the same imaging session to assess the repeatability of the LD-MT-DCE; the other 10 received LD-MT-DCE followed by standard-dose MT-DCE (SD-MT-DCE) to assess correlation of the kinetic parameters estimated by LD- and SD-MT-DCE.
Patient study: Seven female patients with pathologically confirmed triple-negative breast cancer were recruited. All patients were scanned with LD-MT-DCE followed by clinical DCE. Two radiologists (RS and YG) who were blinded to the study independently read the patient data and drew the tumor ROI for all cases. An image quality score scaled from 1 (worst) to 5 (excellent) were given to each image set and a consistency score between LD-MT-DCE and clinical DCE scaled from 1 (lowest) to 3 (highest) were given to each patient case by the radiologists.
Results and Discussions
Figure 1 illustrates conversion from signal intensity to CA concentration using dynamic T1 quantification. Figure 2 displays representative images from the standard-dose DCE and LD-MT-DCE. The example kinetic parametric maps derived from LD-MT-DCE were also shown for a healthy subject, benign tumor, and malignant tumor. Kinetic parameters $$$F_p$$$, $$$v_p$$$, $$$K^{trans}$$$, $$$v_e$$$ of LD-MT-DCE showed excellent in vivo repeatability with all ICCs≥0.99 (Figure 3A), and good agreement with SD-MT-DCE measurements (Pearson correlation coefficients R=0.89, 0.85, 0.74, 0.91, respectively; Figure 3B). Against standard-dose clinical DCE, LD-MT-DCE showed comparable image quality and consistent diagnosis results, as listed in Table 1. $$$F_p$$$, $$$v_p$$$, and $$$K^{trans}$$$ were significantly different between malignant tumors and normal breast tissue (P <0.001 for all parameters), and between malignant and benign tumors (P =0.020, 0.003, <0.001, respectively).Conclusion
A novel LD-MT-DCE technique was proposed for breast MRI, enabling dynamic T1 mapping for the whole breast with a spatial resolution of 0.9×0.9×1.1 mm3 and a temporal resolution of 1.4 s using 20% CA dose. High temporal resolution achieved by MT-DCE allows quantitative assessment of both tissue perfusion and vascularity properties, which has not been possible using conventional techniques. By reducing Gd dose without losing diagnostic accuracy, LD-MT-DCE should improve the benefit-risk ratio of DCE MRI.Acknowledgements
No acknowledgement found.References
- Menezes GL, Knuttel FM, Stehouwer BL, Pijnappel RM, van den Bosch MAJWjoco. Magnetic resonance imaging in breast cancer: a literature review and future perspectives. 2014;5(2):61.
- Mann RM, Kuhl CK, Kinkel K, Boetes CJEr. Breast MRI: guidelines from the European society of breast imaging. 2008;18(7):1307-1318.
- Abe H, Mori N, Tsuchiya K, et al. Kinetic analysis of benign and malignant breast lesions with ultrafast dynamic contrast-enhanced MRI: comparison with standard kinetic assessment. American Journal of Roentgenology. 2016;207(5):1159-1166.
- Georgiou L, Sharma N, Broadbent DA, et al. Estimating breast tumor blood flow during neoadjuvant chemotherapy using interleaved high temporal and high spatial resolution MRI. 2018;79(1):317-326.
- Wang C-H, Yin F-F, Horton J, Chang ZJWjom. Review of treatment assessment using DCE-MRI in breast cancer radiation therapy. 2014;4(2):46.
- Wasser K, Klein S, Fink C, et al. Evaluation of neoadjuvant chemotherapeutic response of breast cancer using dynamic MRI with high temporal resolution. 2003;13(1):80-87.
- Mankoff DA, Dunnwald LK, Gralow JR, et al. Changes in blood flow and metabolism in locally advanced breast cancer treated with neoadjuvant chemotherapy. 2003;44(11):1806-1814.
- Jain RK, Duda DG, Willett CG, et al. Biomarkers of response and resistance to antiangiogenic therapy. 2009;6(6):327.
- Huckle JE, Altun E, Jay M, Semelka RCJIr. Gadolinium deposition in humans: when did we learn that gadolinium was deposited in vivo? 2016;51(4):236-240.
- Kanda T, Ishii K, Kawaguchi H, Kitajima K, Takenaka DJR. High signal intensity in the dentate nucleus and globus pallidus on unenhanced T1-weighted MR images: relationship with increasing cumulative dose of a gadolinium-based contrast material. 2013;270(3):834-841.
- McDonald RJ, McDonald JS, Kallmes DF, et al. Intracranial gadolinium deposition after contrast-enhanced MR imaging. 2015;275(3):772-782.
- Murata N, Gonzalez-Cuyar LF, Murata K, et al. Macrocyclic and other non–group 1 gadolinium contrast agents deposit low levels of gadolinium in brain and bone tissue: preliminary results from 9 patients with normal renal function. 2016;51(7):447-453.
- Christodoulou AG, Shaw JL, Nguyen C, et al. Magnetic resonance multitasking for motion-resolved quantitative cardiovascular imaging. Nature Biomedical Engineering. 2018;2(4):215.
- Liang Z-P. Spatiotemporal imagingwith partially separable functions. IEEE; 2007:988-991.
- Sourbron SP, Buckley DL. Classic models for dynamic contrast-enhanced MRI. Nmr in Biomedicine. Aug 2013;26(8):1004-1027. doi:10.1002/nbm.2940
Figures
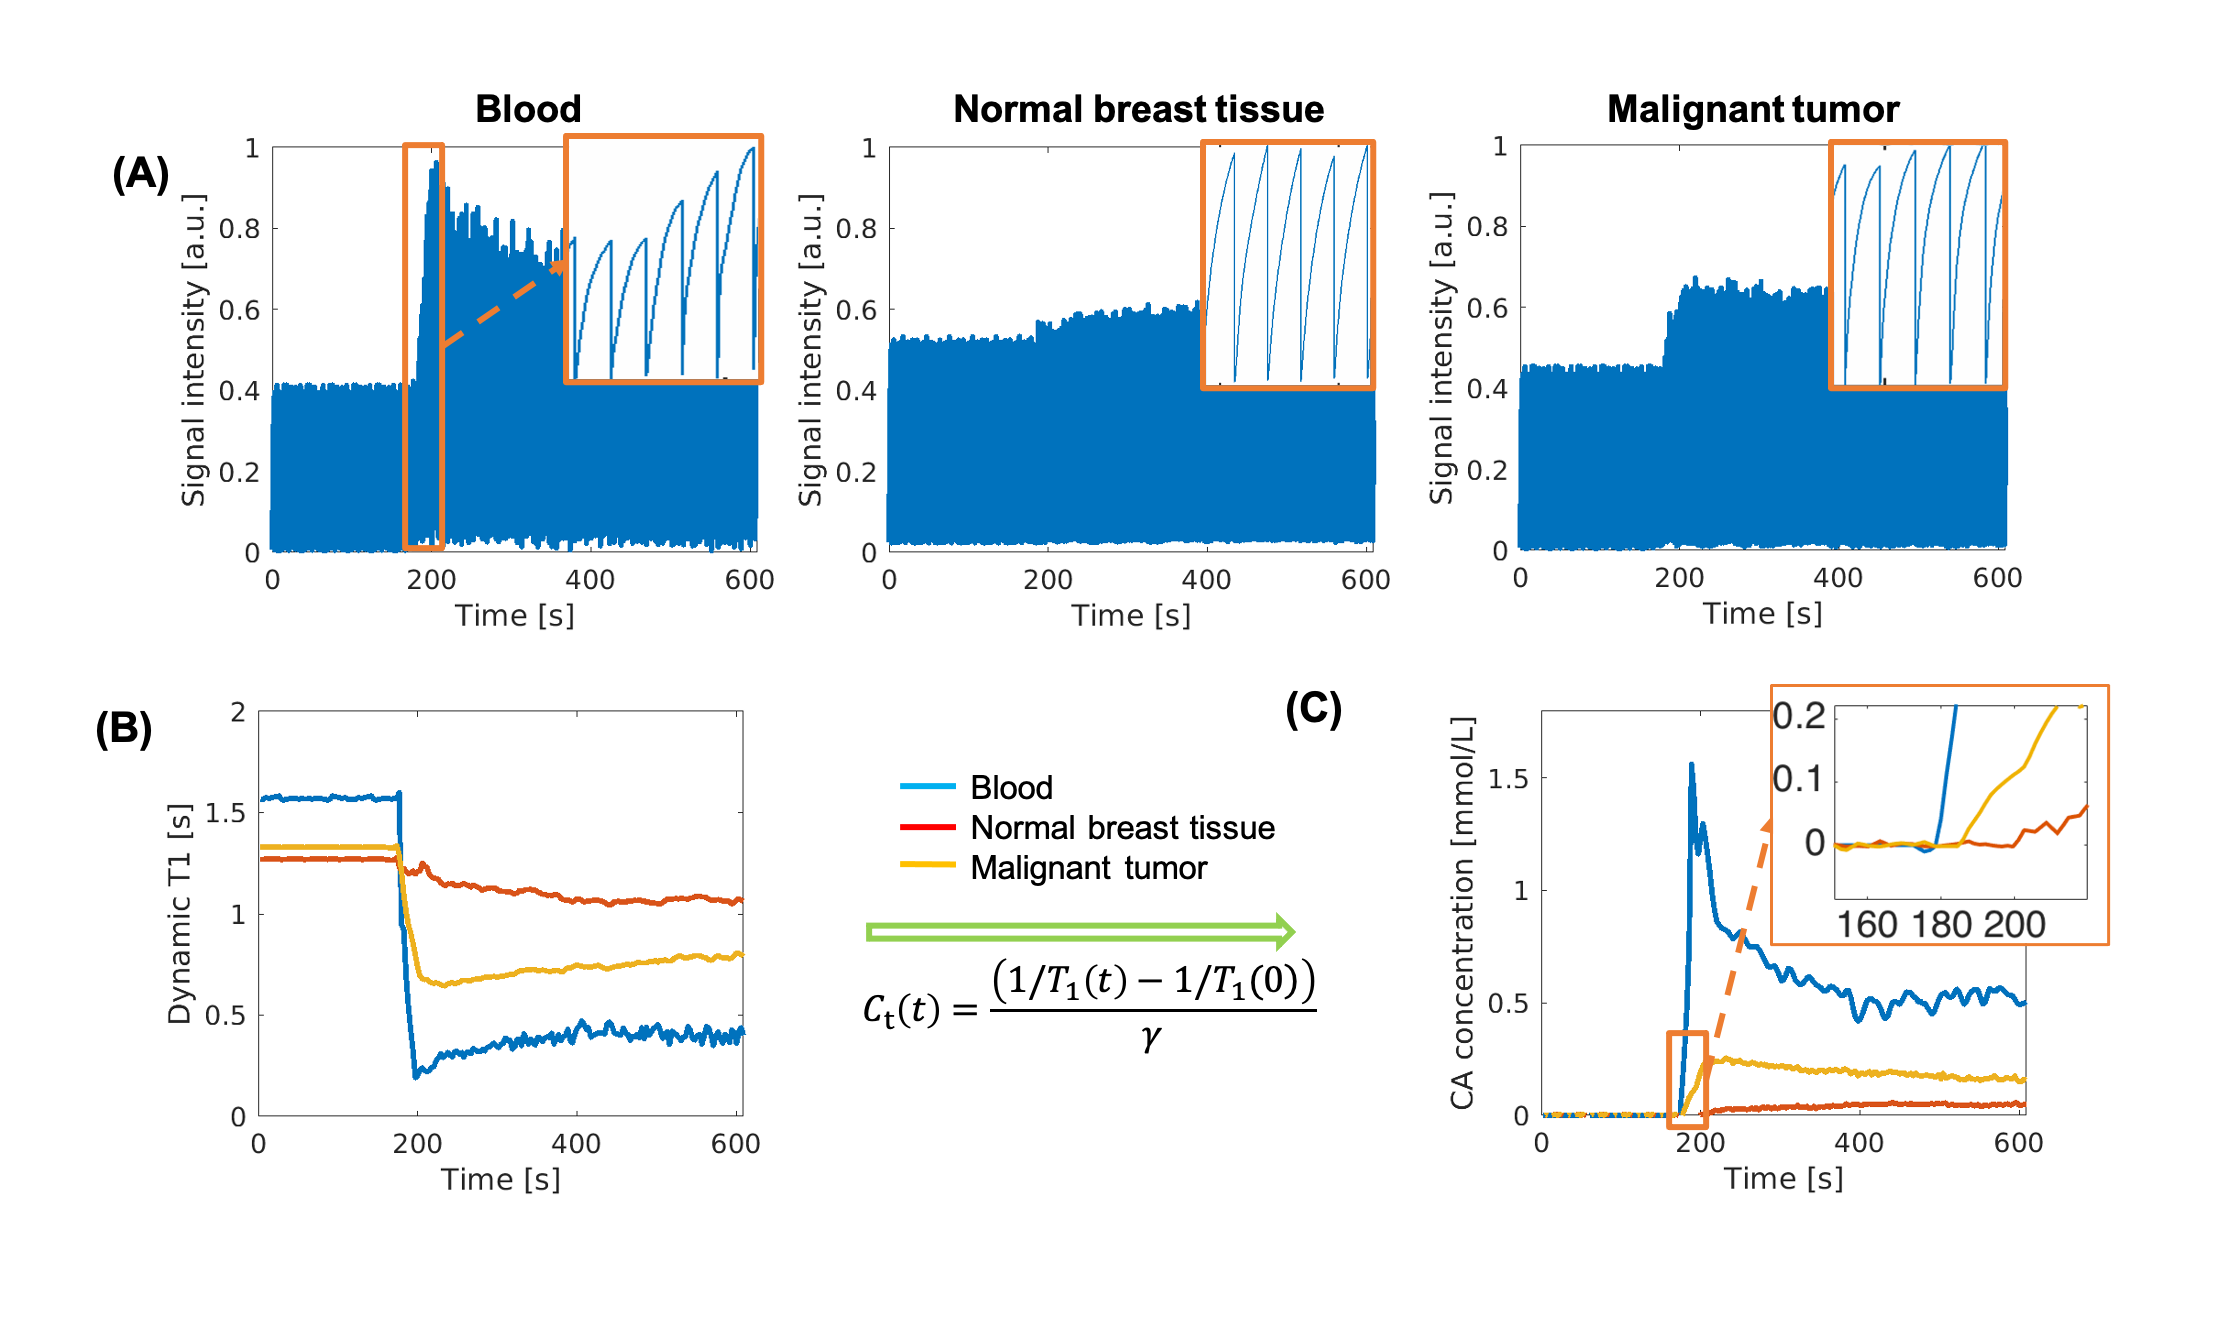
Figure
1: Transformation from signal intensity to CA concentration. (A) Representative
signal profiles of blood, normal breast tissue, and malignant tumor. The
zoom-in area shows the SR curves during the enhancement. (B) Dynamic T1 mapping
based on SR periods. (C) CA concentration curves derived directly from the T1
mapping according to CA relaxivity. The zoom-in area on (C) displays the
initial enhancement time for the three types of tissues.
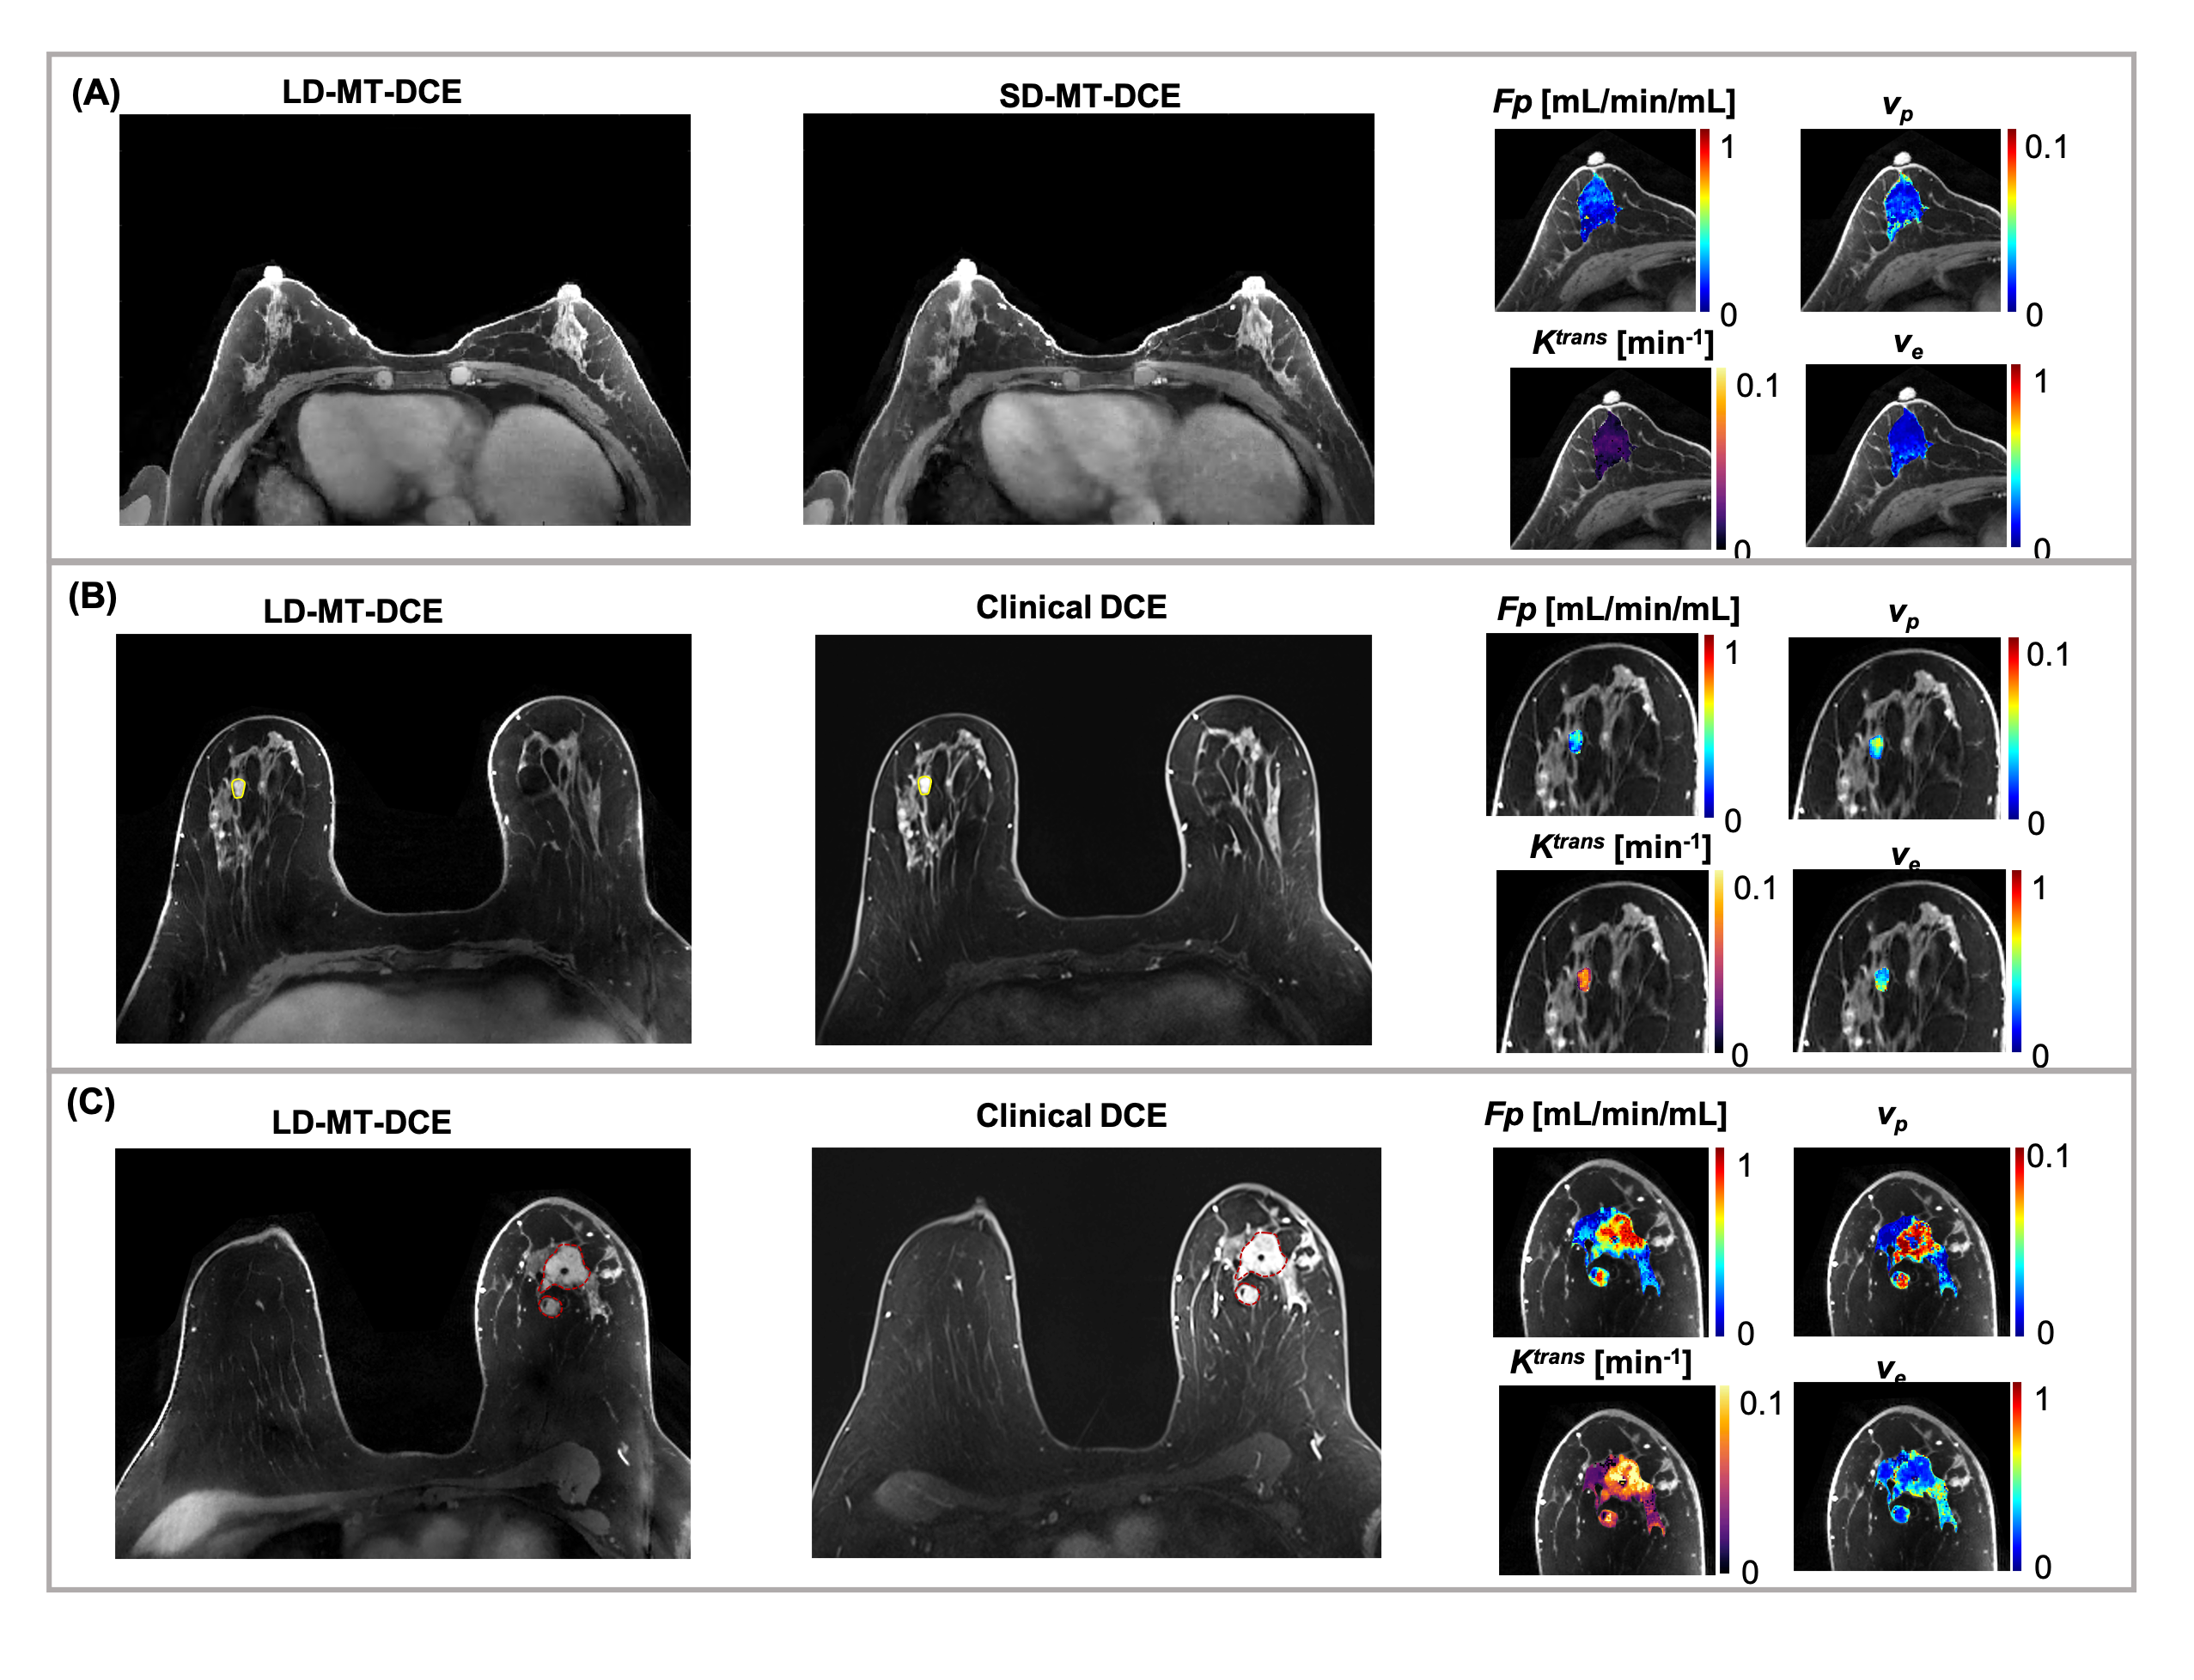
Figure
2: Representative maps of kinetic parameters showing normal breast tissue from
a 52-year-old healthy volunteer (A), a benign tumor (marked by a yellow solid
boundary) from a 49-year-old patient (B), and a malignant tumor (marked by a
red dashed boundary) from a 65-year-old patient (C). The gray-scale images
display peak-enhanced LD-MT-DCE images and the standard-dose images at the same
slice. The overlaid colormaps represents Fp, vp, Ktrans,
and ve, respectively.
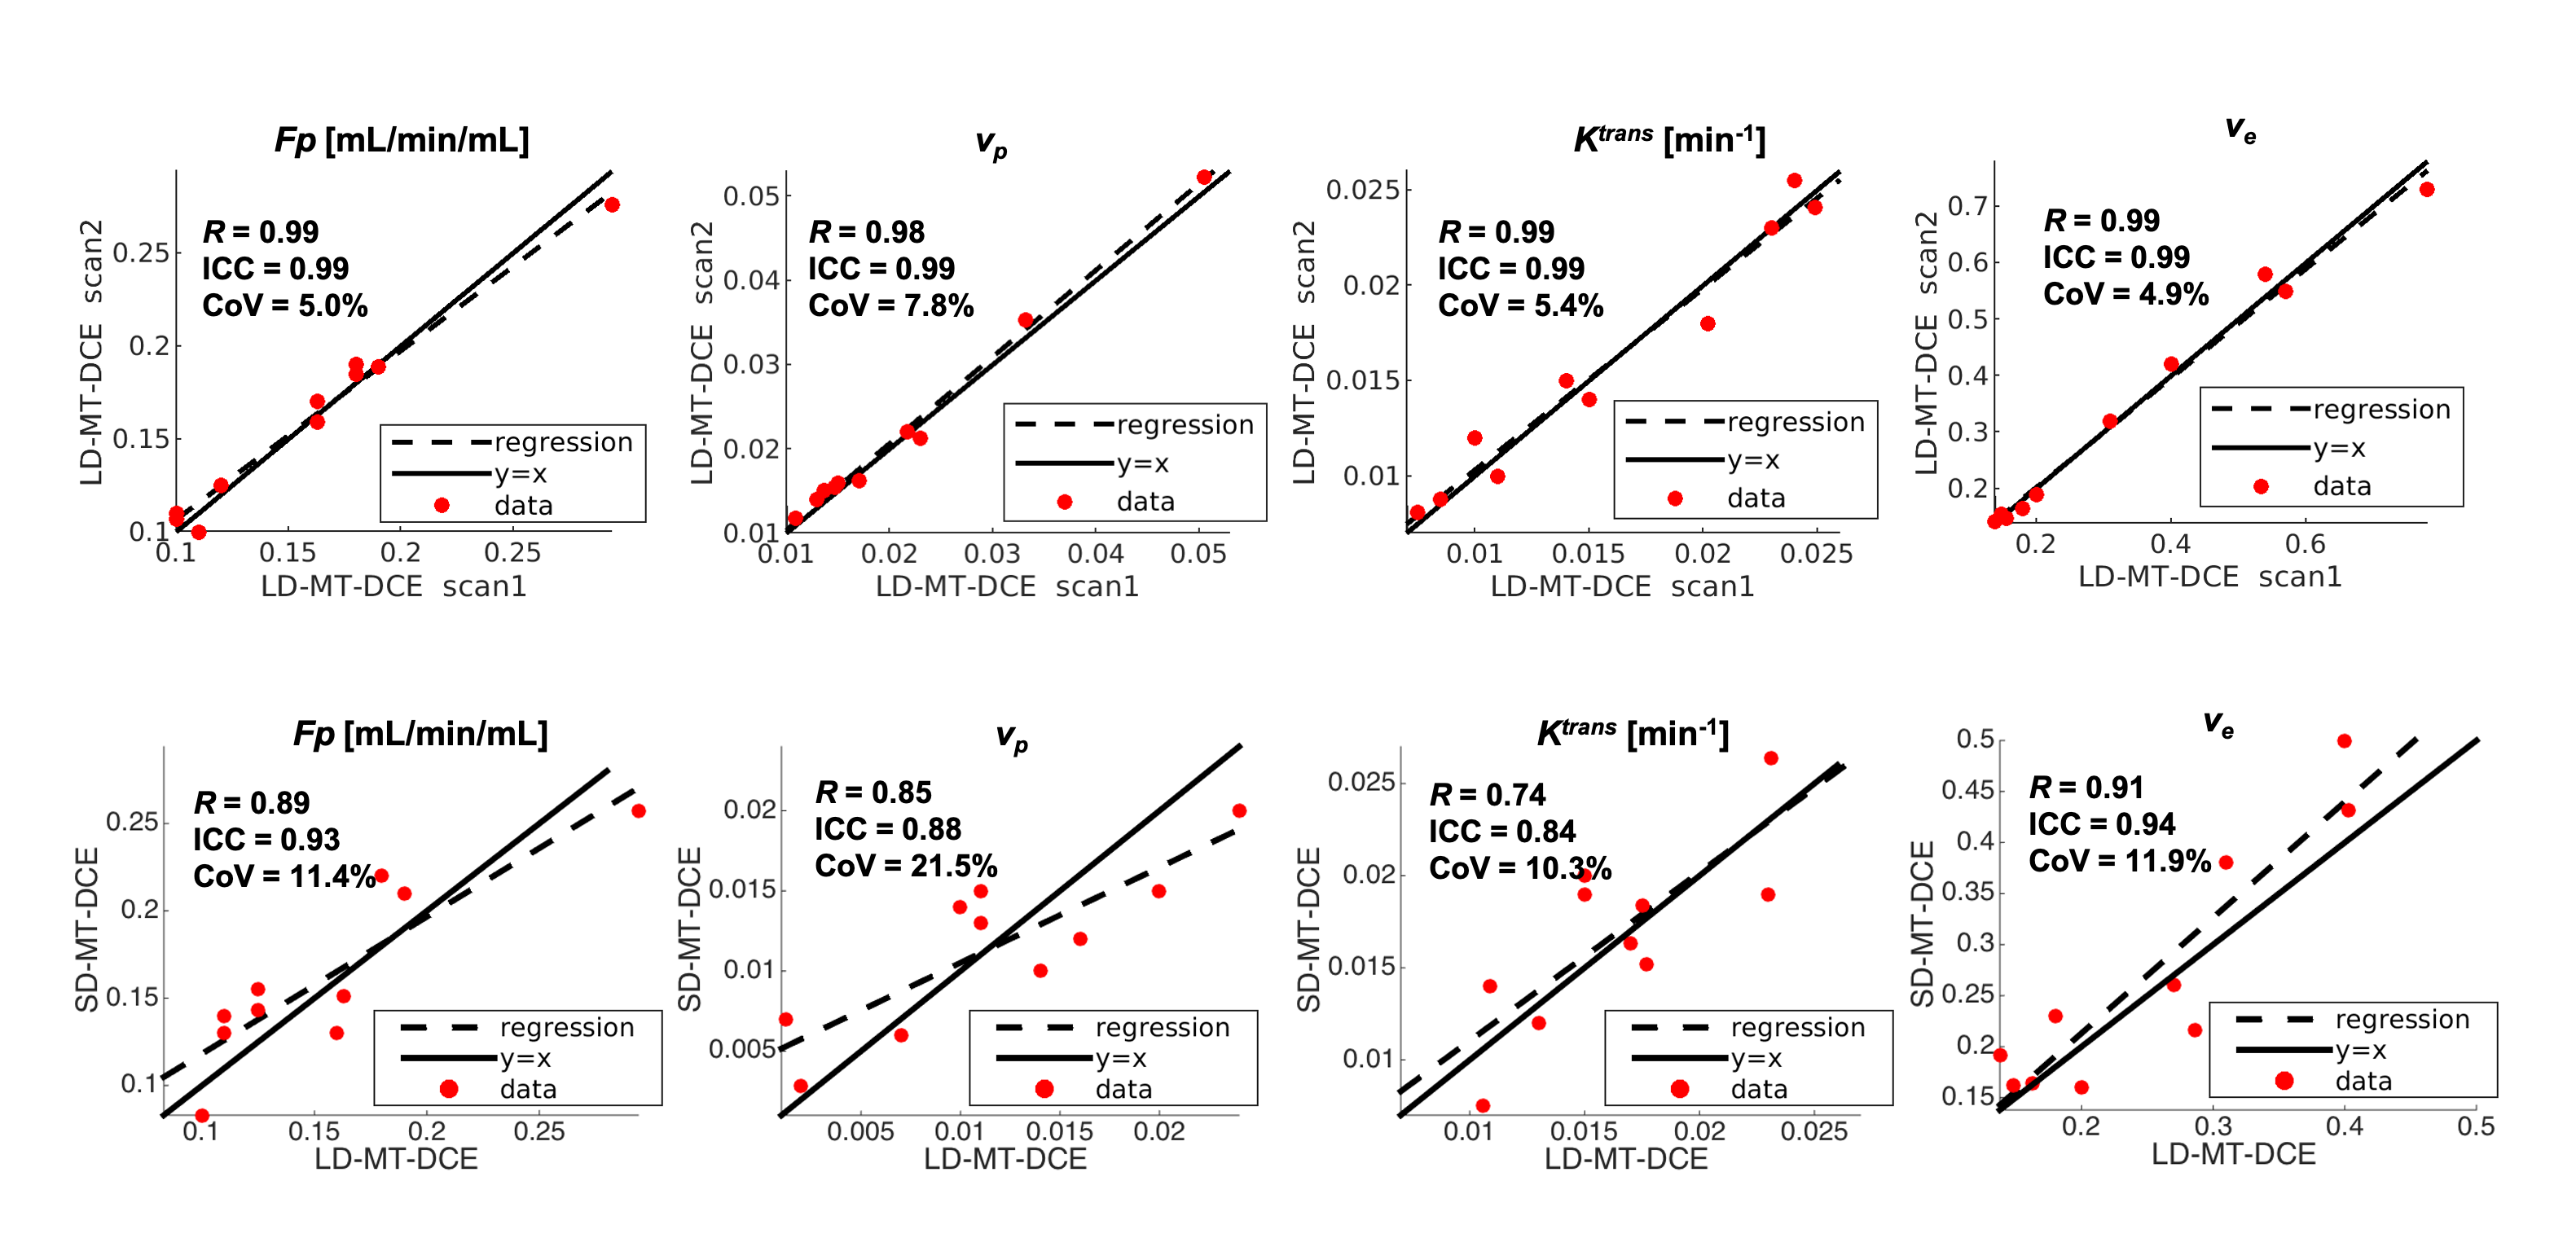
Figure
3: (A) Repeatability of LD-MT-DCE. The R, ICC, and CoV between the
estimation using the first and second LD-MT-DCE images were evaluated and
displayed for all parameters. (B) Correlation between the kinetic parameters
estimated using LD-MT-DCE and SD-MT-DCE.
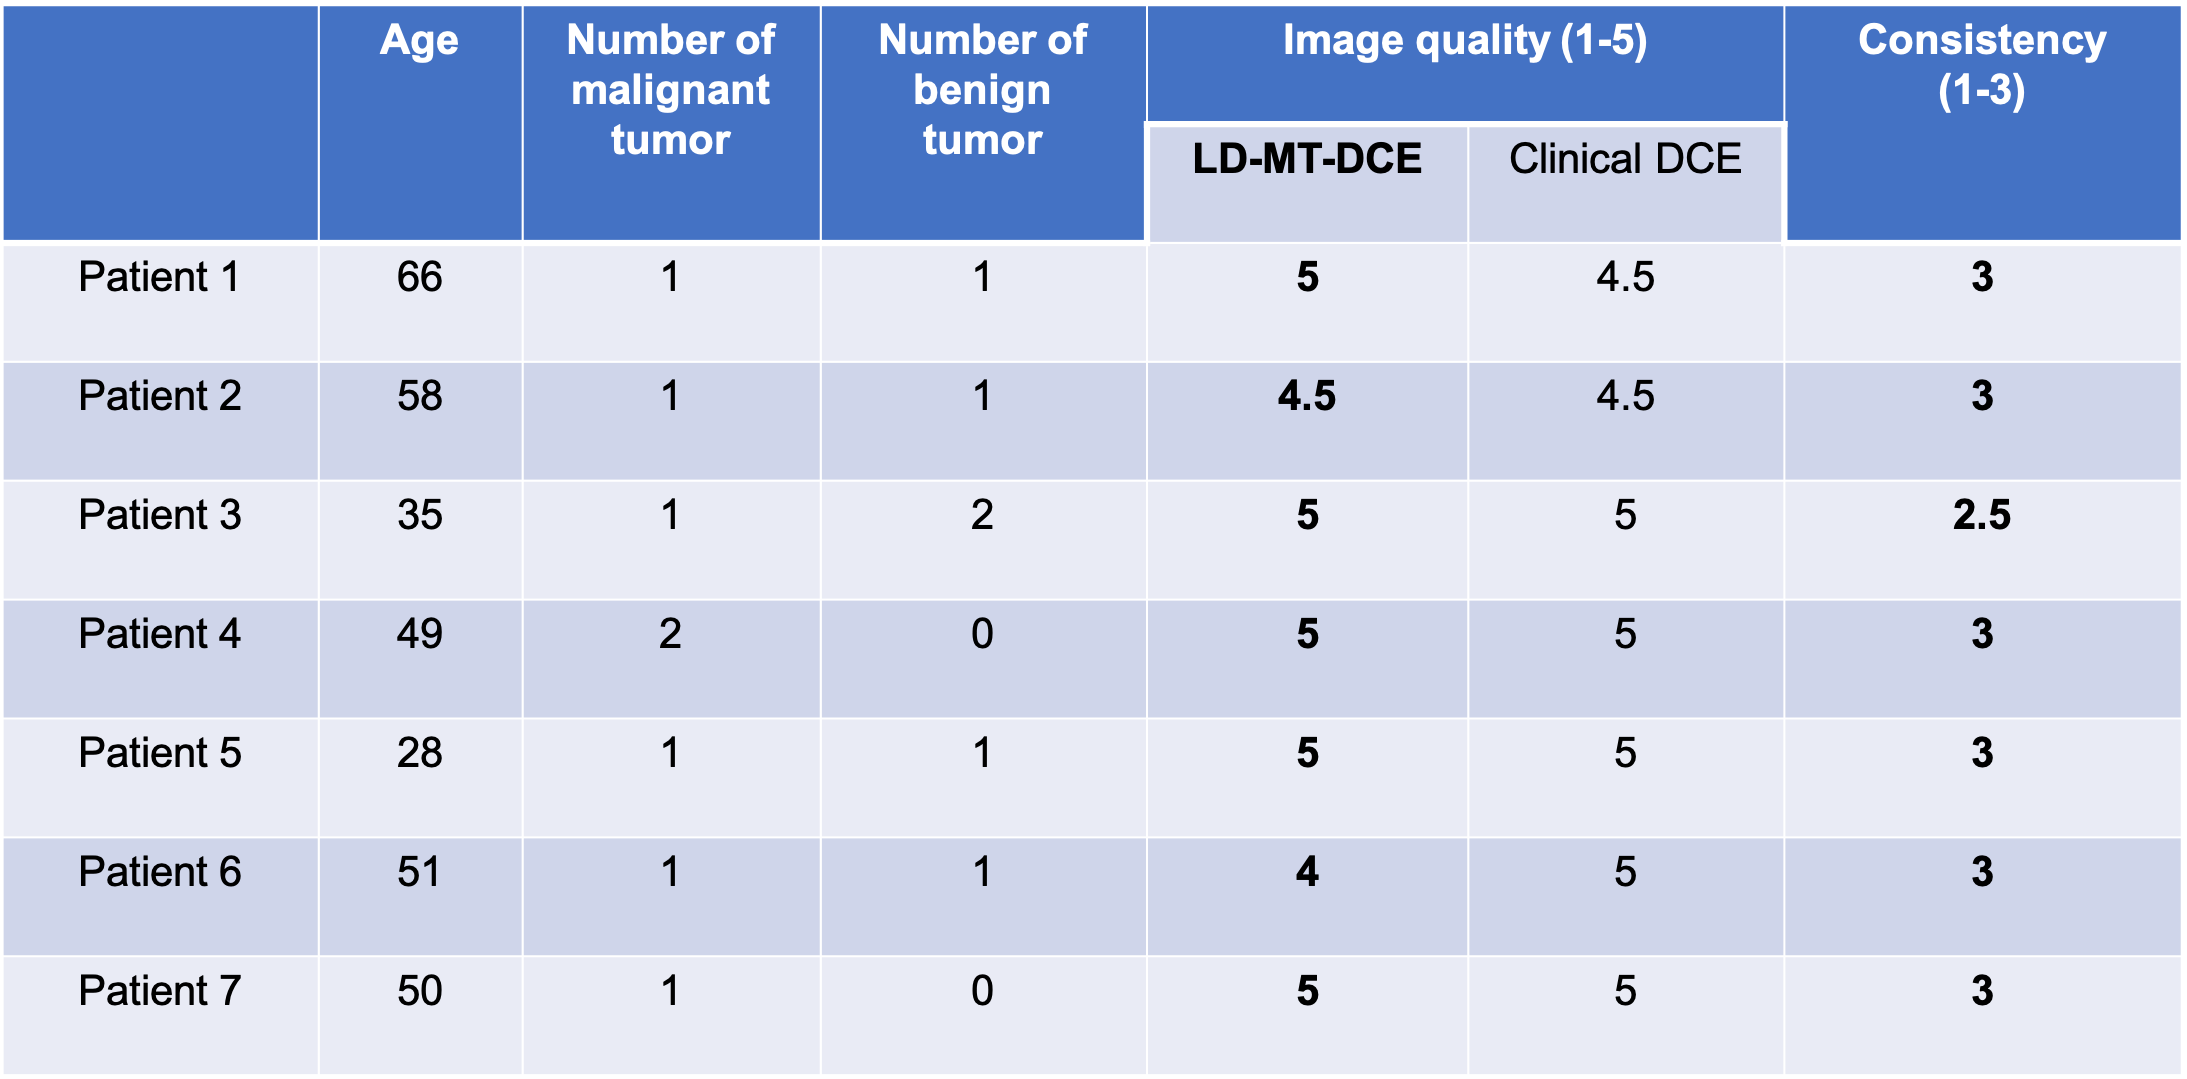
Table
1: Comparison of the image quality and diagnosis results between LD-MT-DCE and
clinical DCE in patient group. The image quality of both methods are listed.
The LD-MT-DCE images were scored as “excellent” for 5 cases and equal or above
“good” for the other 2 cases by both radiologists. In 6 cases, the diagnosis
results of LD-MT-DCE perfectly match the results of clinical DCE in terms of
the location, size, type, margin, and perfusion type.
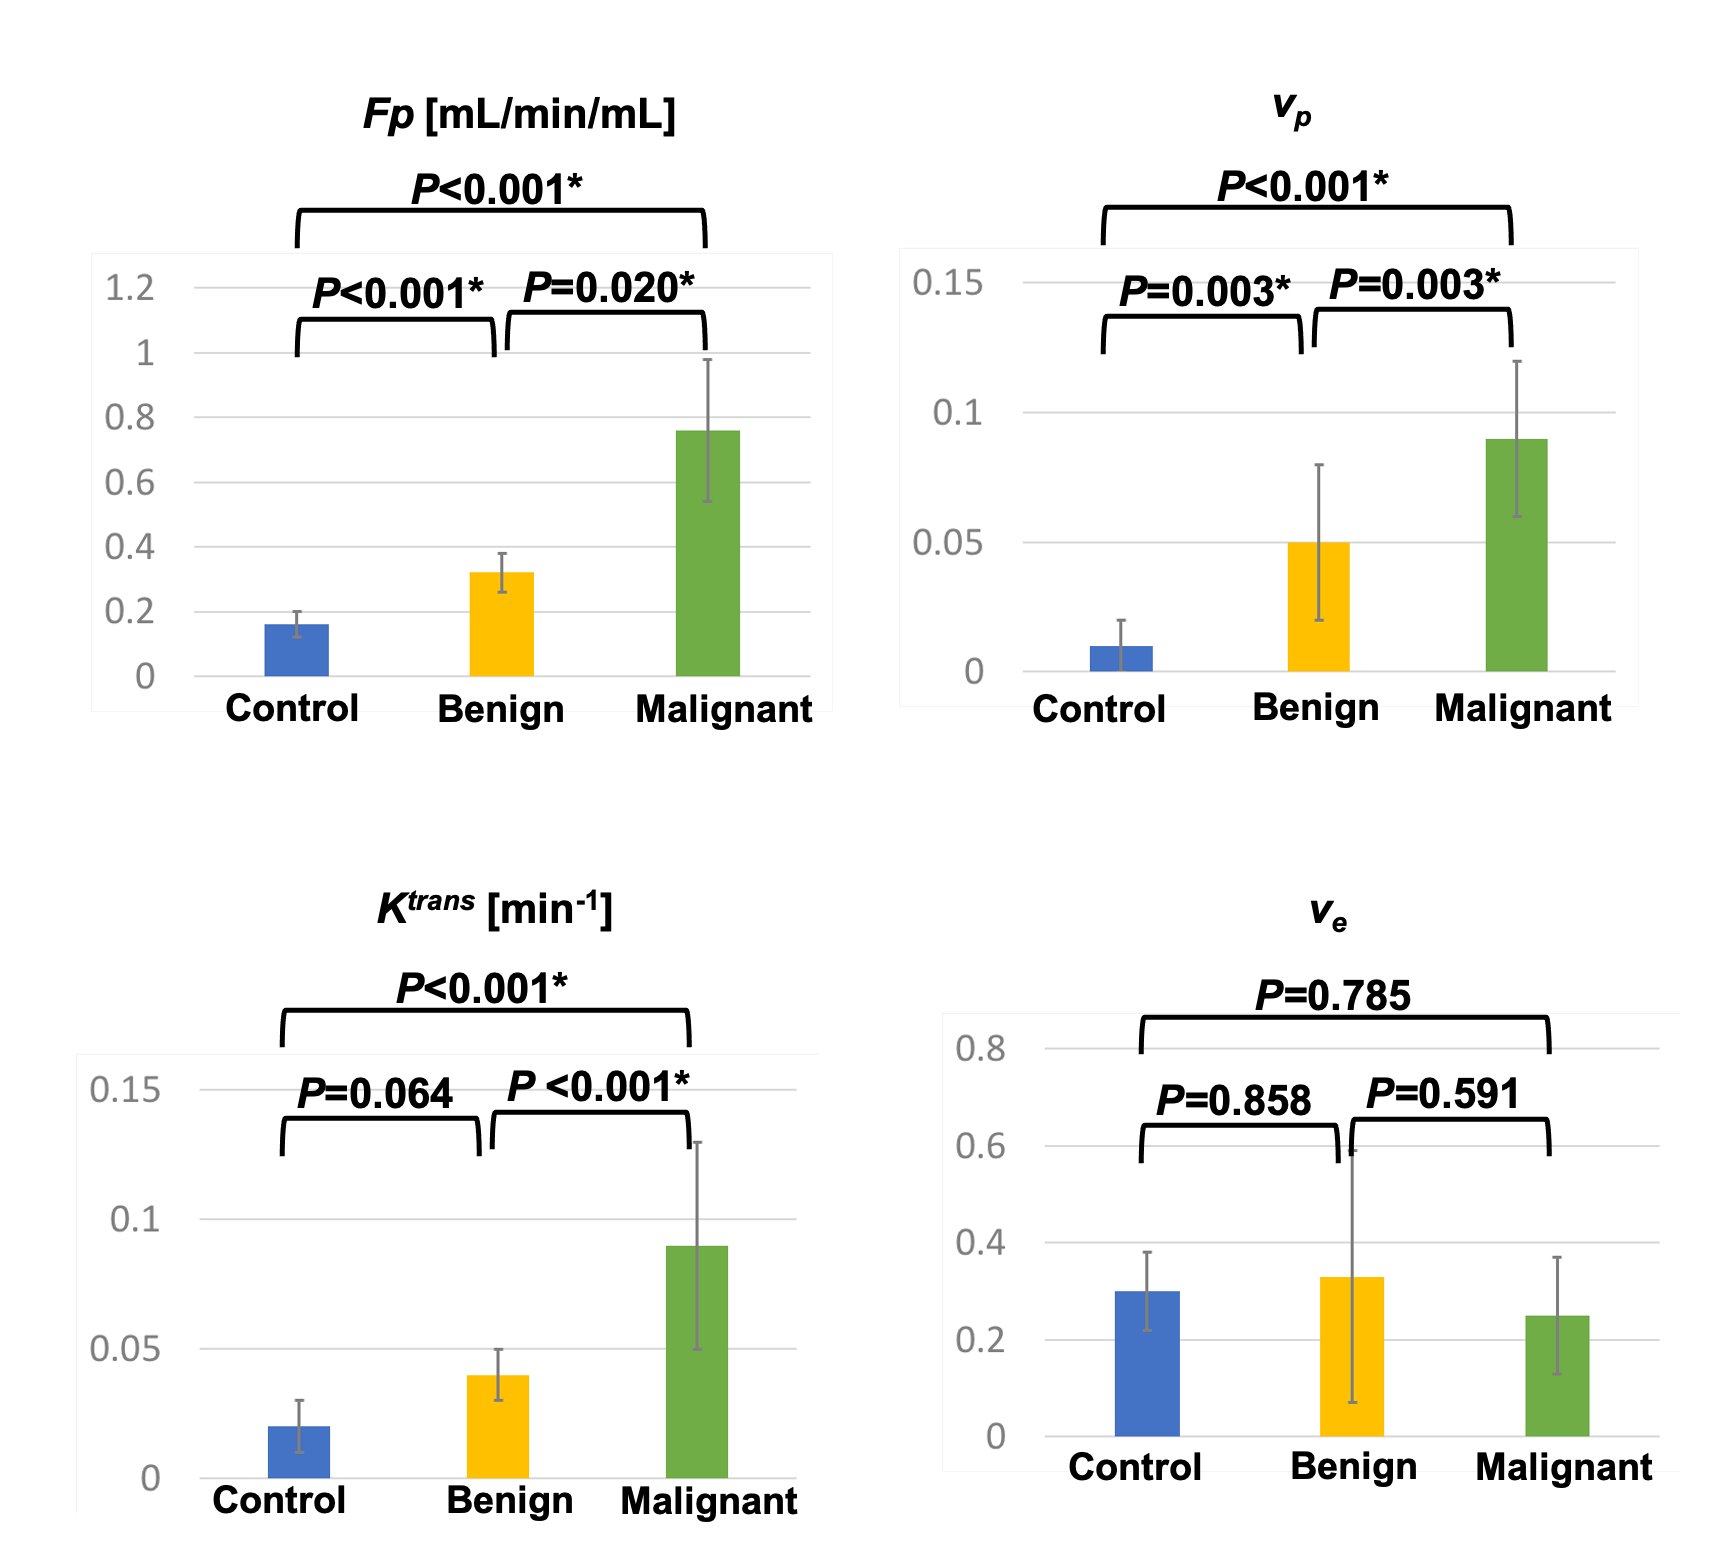
Figure
4: Mean and standard deviation measurements of Fp, vp, Ktrans,
and ve for control group, and benign and malignant tumors in patient
group. The P value of each pair by one-way ANOVA with Tukey test are marked on
top of the bar graphs. Fp, vp, and Ktrans were
significantly different between control and malignant tumor, and between benign
and malignant tumors; Fp, and vp were significantly
different between control and benign tumors. * indicates statistically
significant difference.