0114
Brain oxygen extraction is differentially altered by Alzheimer’s and vascular diseases1The Russell H. Morgan Department of Radiology & Radiological Science, Johns Hopkins University School of Medicine, Baltimore, MD, United States, 2Department of Biomedical Engineering, Johns Hopkins University School of Medicine, Baltimore, MD, United States, 3Department of Neurology, Johns Hopkins University School of Medicine, Baltimore, MD, United States, 4Department of Neurosurgery, Johns Hopkins University School of Medicine, Baltimore, MD, United States, 5Department of Medicine, Johns Hopkins University School of Medicine, Baltimore, MD, United States, 6Department of Psychiatry and Behavioral Sciences, Johns Hopkins University School of Medicine, Baltimore, MD, United States, 7F.M. Kirby Research Center for Functional Brain Imaging, Kennedy Krieger Research Institute, Baltimore, MD, United States
Synopsis
Alzheimer’s disease, vascular cognitive impairment and their concurrence represent the most common types of cognitive dysfunction. There exists a considerable overlap in their clinical symptoms and neuroimaging features, and we still lack effective tools for their differential diagnosis. This work demonstrated that cerebral oxygen-extraction-fraction (OEF) was differentially affected by Alzheimer’s (decrease OEF) and vascular (increase OEF) pathology. In individuals with low vascular risks, lower OEF was associated with worse cognitive performance and greater amyloid burden. In impaired patients, higher OEF was associated with great vascular risk factors. These findings suggest OEF can be useful in etiology-based diagnosis of cognitive impairment.
INTRODUCTION
Alzheimer’s disease (AD) and vascular cognitive impairment (VCI), as well as their concurrence, represent the most common types of cognitive dysfunction.1 Treatment strategies for the two types can be very different. However, there exists a considerable overlap in clinical symptoms and neuroimaging features between them,2 and we still lack effective tools for their differential diagnosis. Cerebral oxygen-extraction-fraction (OEF) reflects a delicate balance between vascular (e.g. blood supply) and neural (e.g. oxygen consumption) function.3,4 We therefore hypothesize that, when the brain is characterized by neurodegeneration with relatively intact vascular function (i.e. AD), OEF will be diminished due to reduced oxygen consumption. On the other hand, when the brain mainly suffers from vascular dysfunction (i.e. VCI), OEF will be elevated due to decreased blood flow. In this work, we used a non-invasive and rapid MRI technique5,6 to measure OEF, and examined its relationship to Alzheimer’s pathology and vascular risk factors in a group of cognitively impaired patients.METHODS
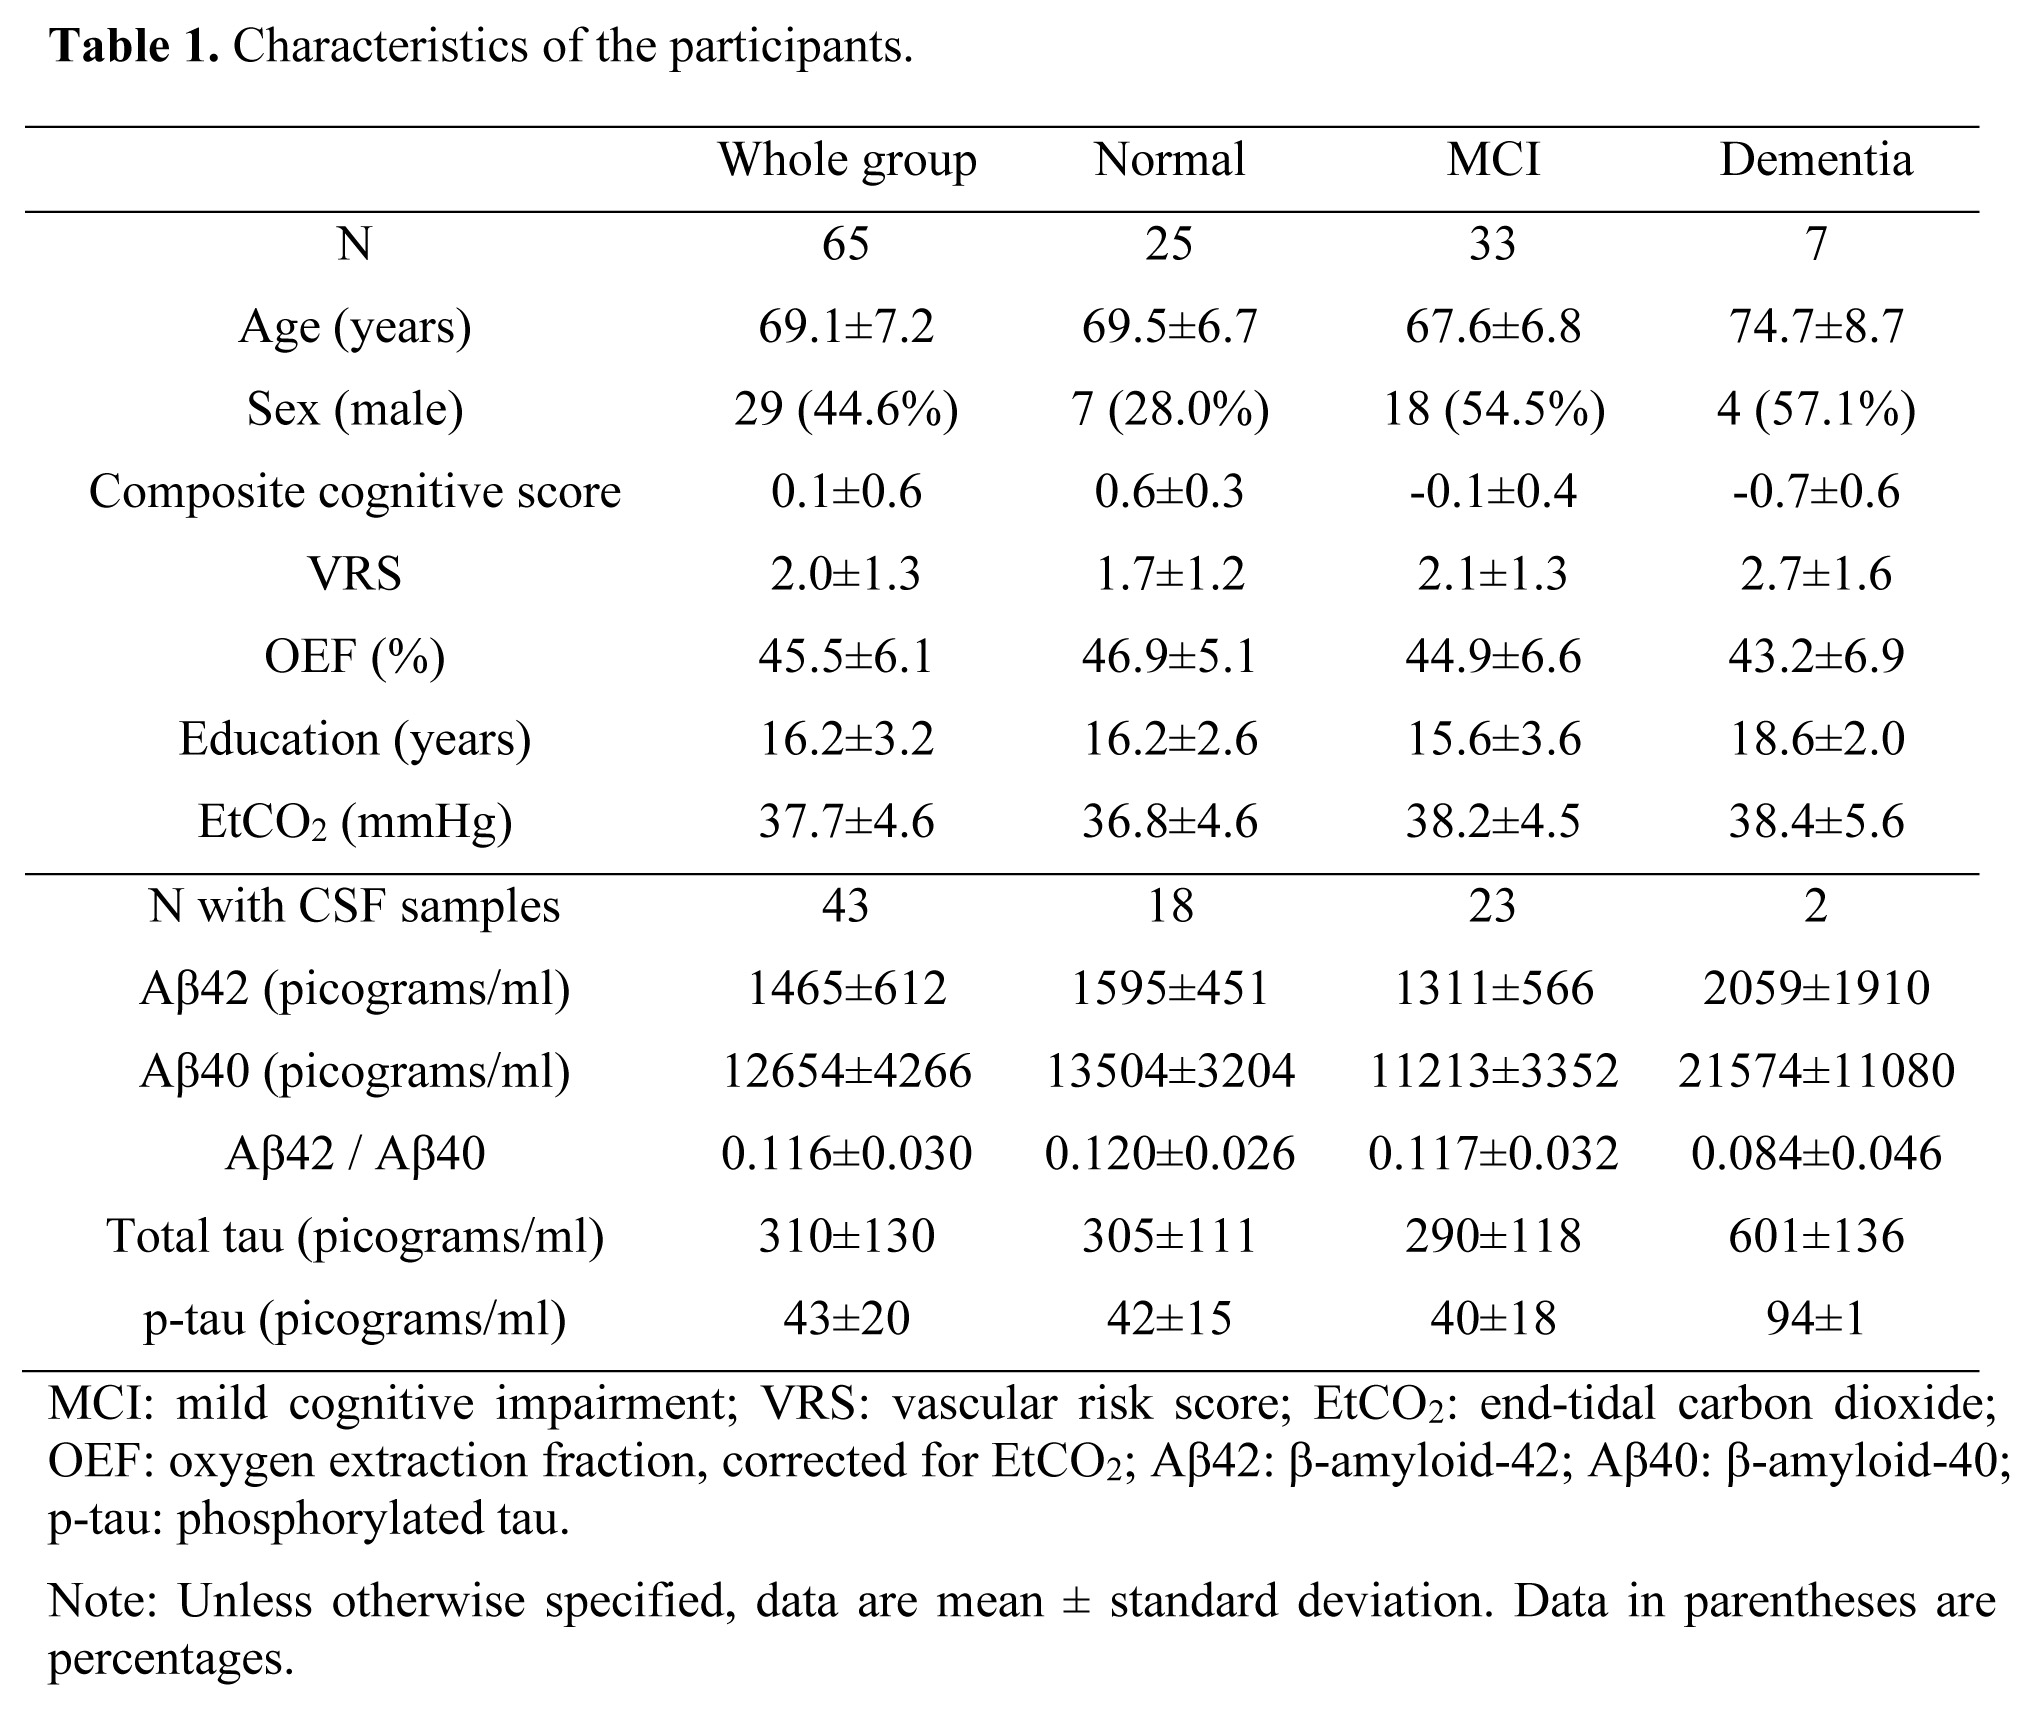
ParticipantsSixty-five elderly subjects were included. Each subject received a standard consensus diagnosis of being cognitively normal, mild-cognitive-impairment (MCI), or dementia.7 All subjects underwent neuropsychological tests covering four cognitive domains: verbal episodic memory, executive function, processing speed, and language. Z-scores of each domain were averaged to yield an overall composite cognitive score.
Based on medical histories, a vascular-risk-score (VRS) was created by summing up five elements8: hypertension (1=recent, 0=remote/absent), hypercholesterolemia (1=recent, 0=remote/absent), diabetes (1=recent, 0=remote/absent), smoking (1 if ≥100 cigarettes-smoked, 0 otherwise) and body-mass-index (1 if >30, 0 otherwise).
In a subset of 43 subjects, cerebrospinal-fluid (CSF) samples were collected through lumbar puncture. Concentrations (in picograms/ml) of CSF β-amyloid-42 (Aβ42), β-amyloid-40 (Aβ40), total tau, and phosphorylated tau (p-tau) were measured.
MRI Experiment
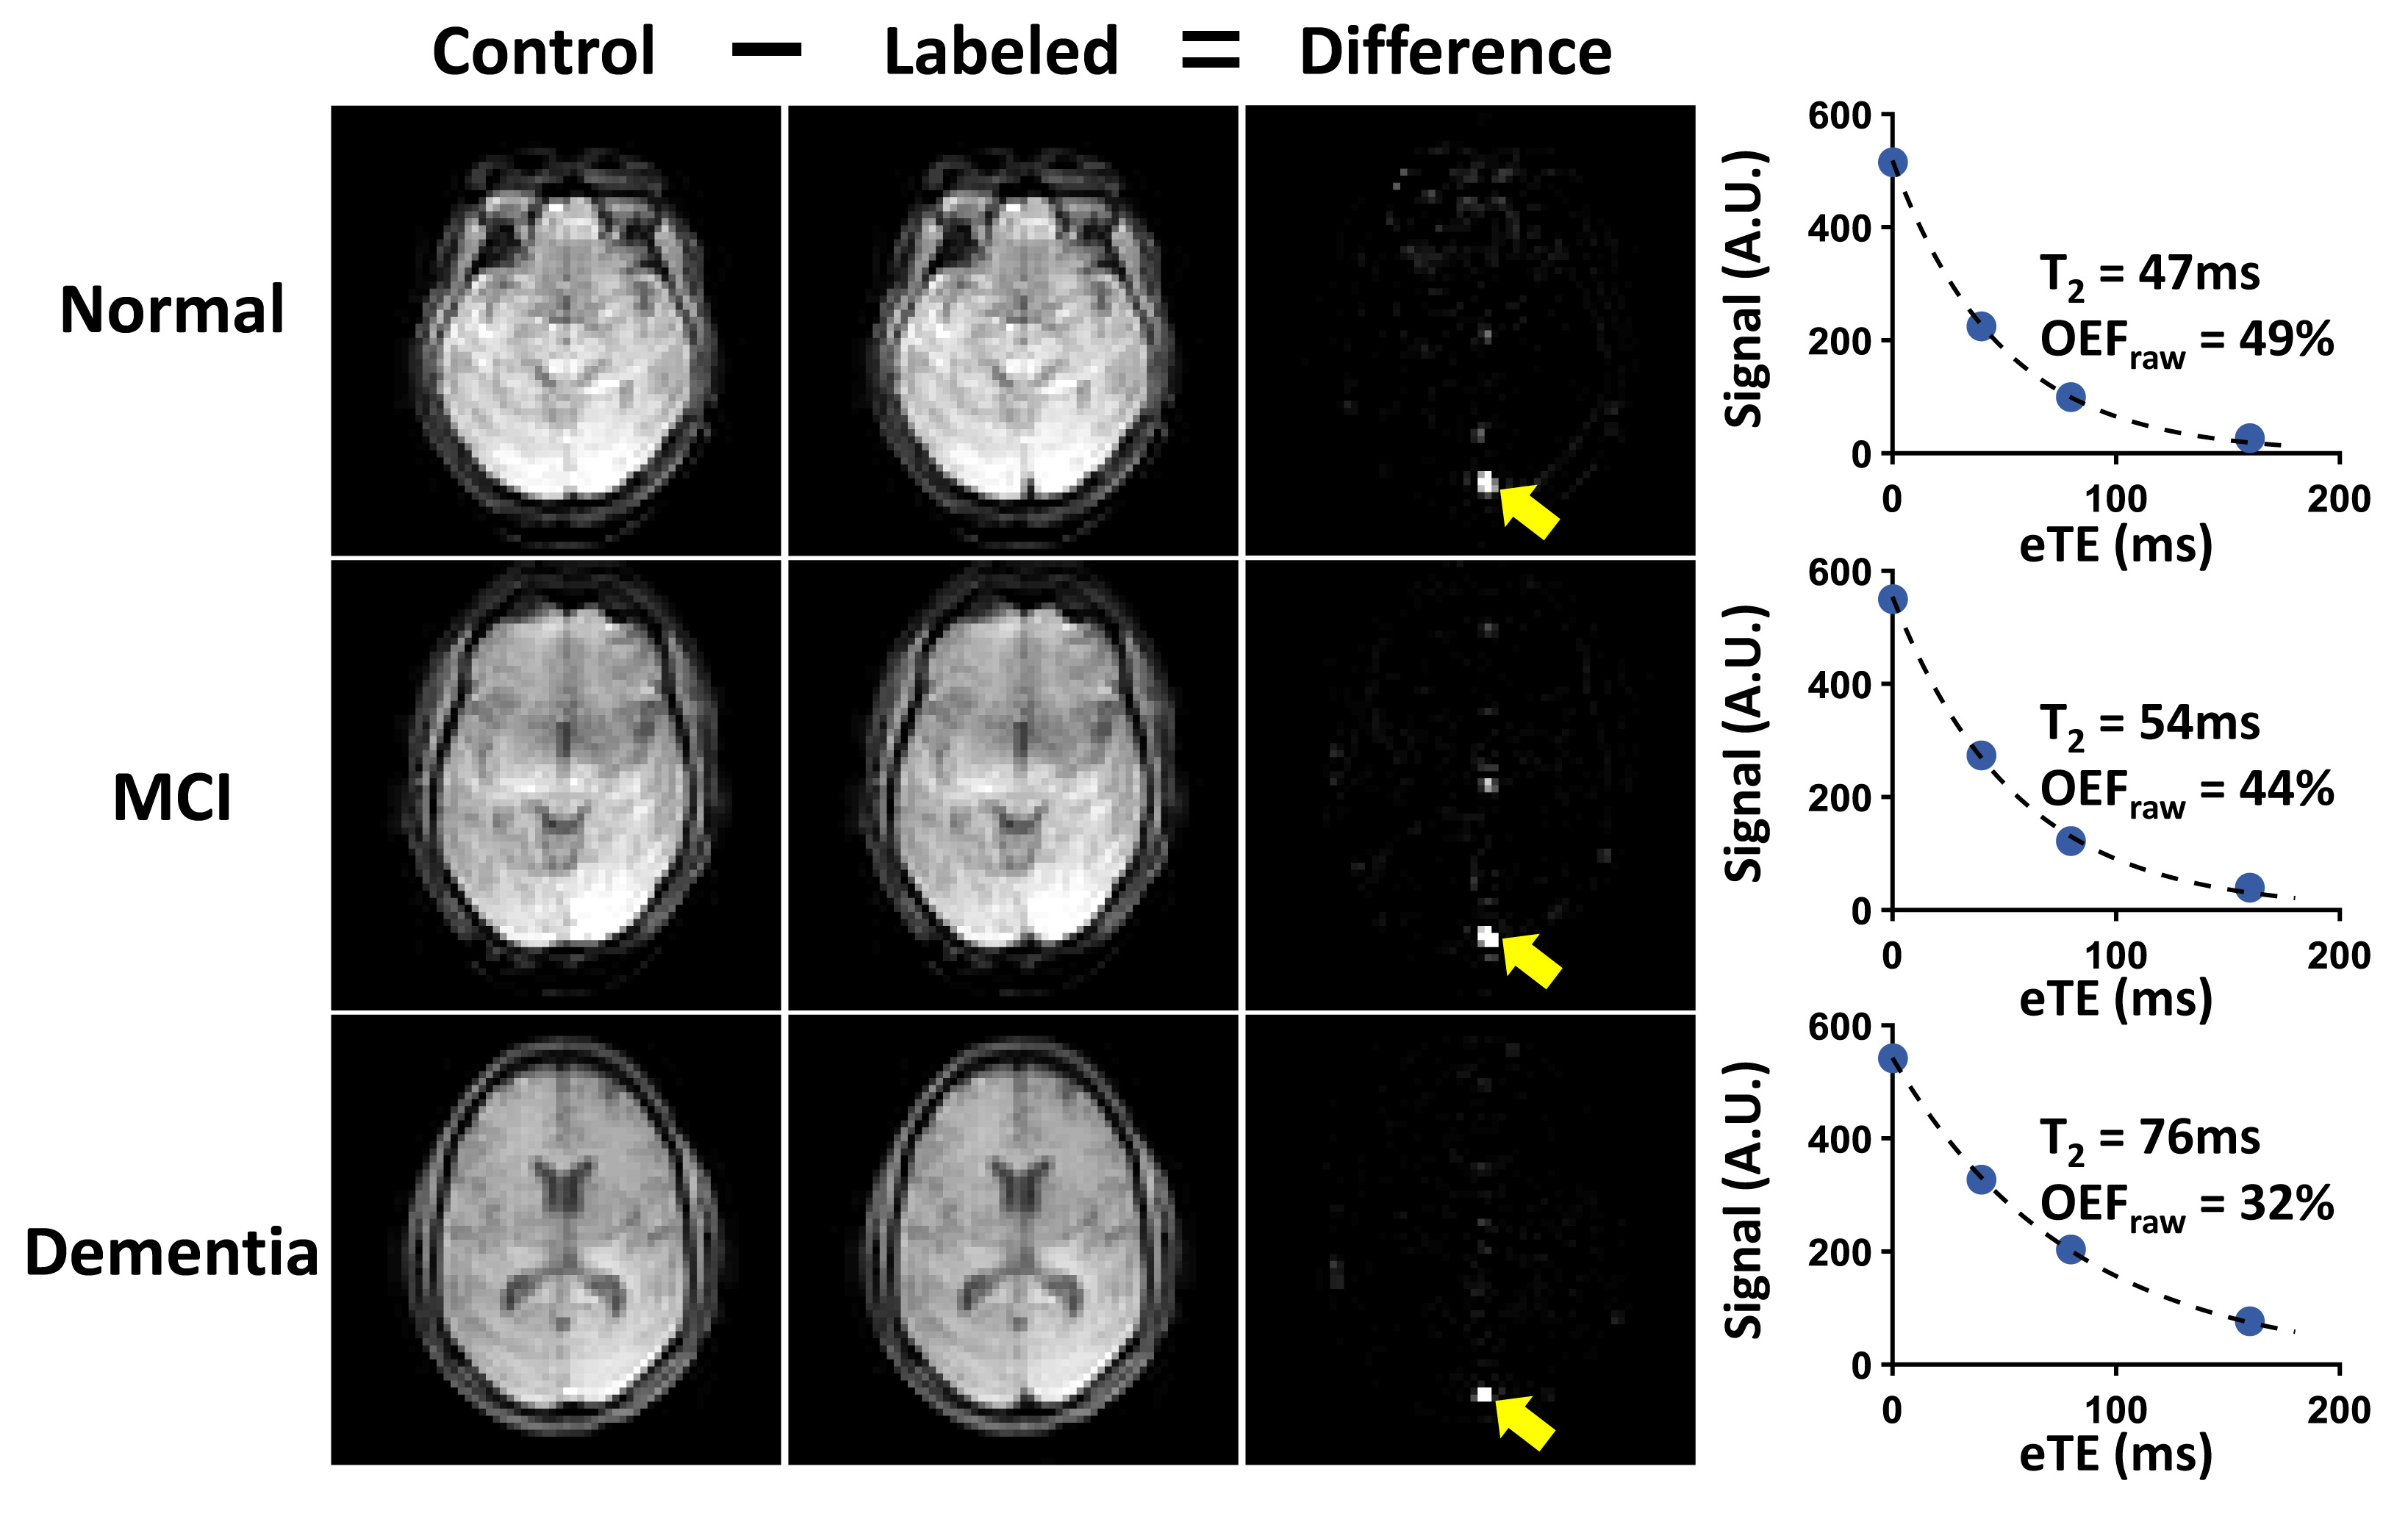
Global OEF of each subject was measured using T2-relaxation-under-spin-tagging (TRUST)5,6 MRI. Our previous works have demonstrated that TRUST provides accurate OEF quantification6 and has excellent inter-vendor scalability.9 TRUST used the following parameters: TR/TE/TI=3000/3.6/1020ms, scan time=1.2min. During the TRUST scan, end-tidal CO2 (EtCO2) of each subject was measured.
Data Processing
The processing of TRUST OEF data followed literature.5,6 We previously showed that normal OEF variations are largely (~50%) attributed to the subjects’ EtCO2 levels.10 Therefore, to reduce physiological variations, OEF was corrected for EtCO2 using:
$$ OEF=OEF_{raw}-α(EtCO_2 - \overline{EtCO_2})$$ (1)
where $$$OEF_{raw}$$$ is the OEF before correction, $$$\overline{EtCO_2}$$$ is the averaged EtCO2 across subjects. α was found to be -0.87±0.16%/mmHg.
Statistical Analysis
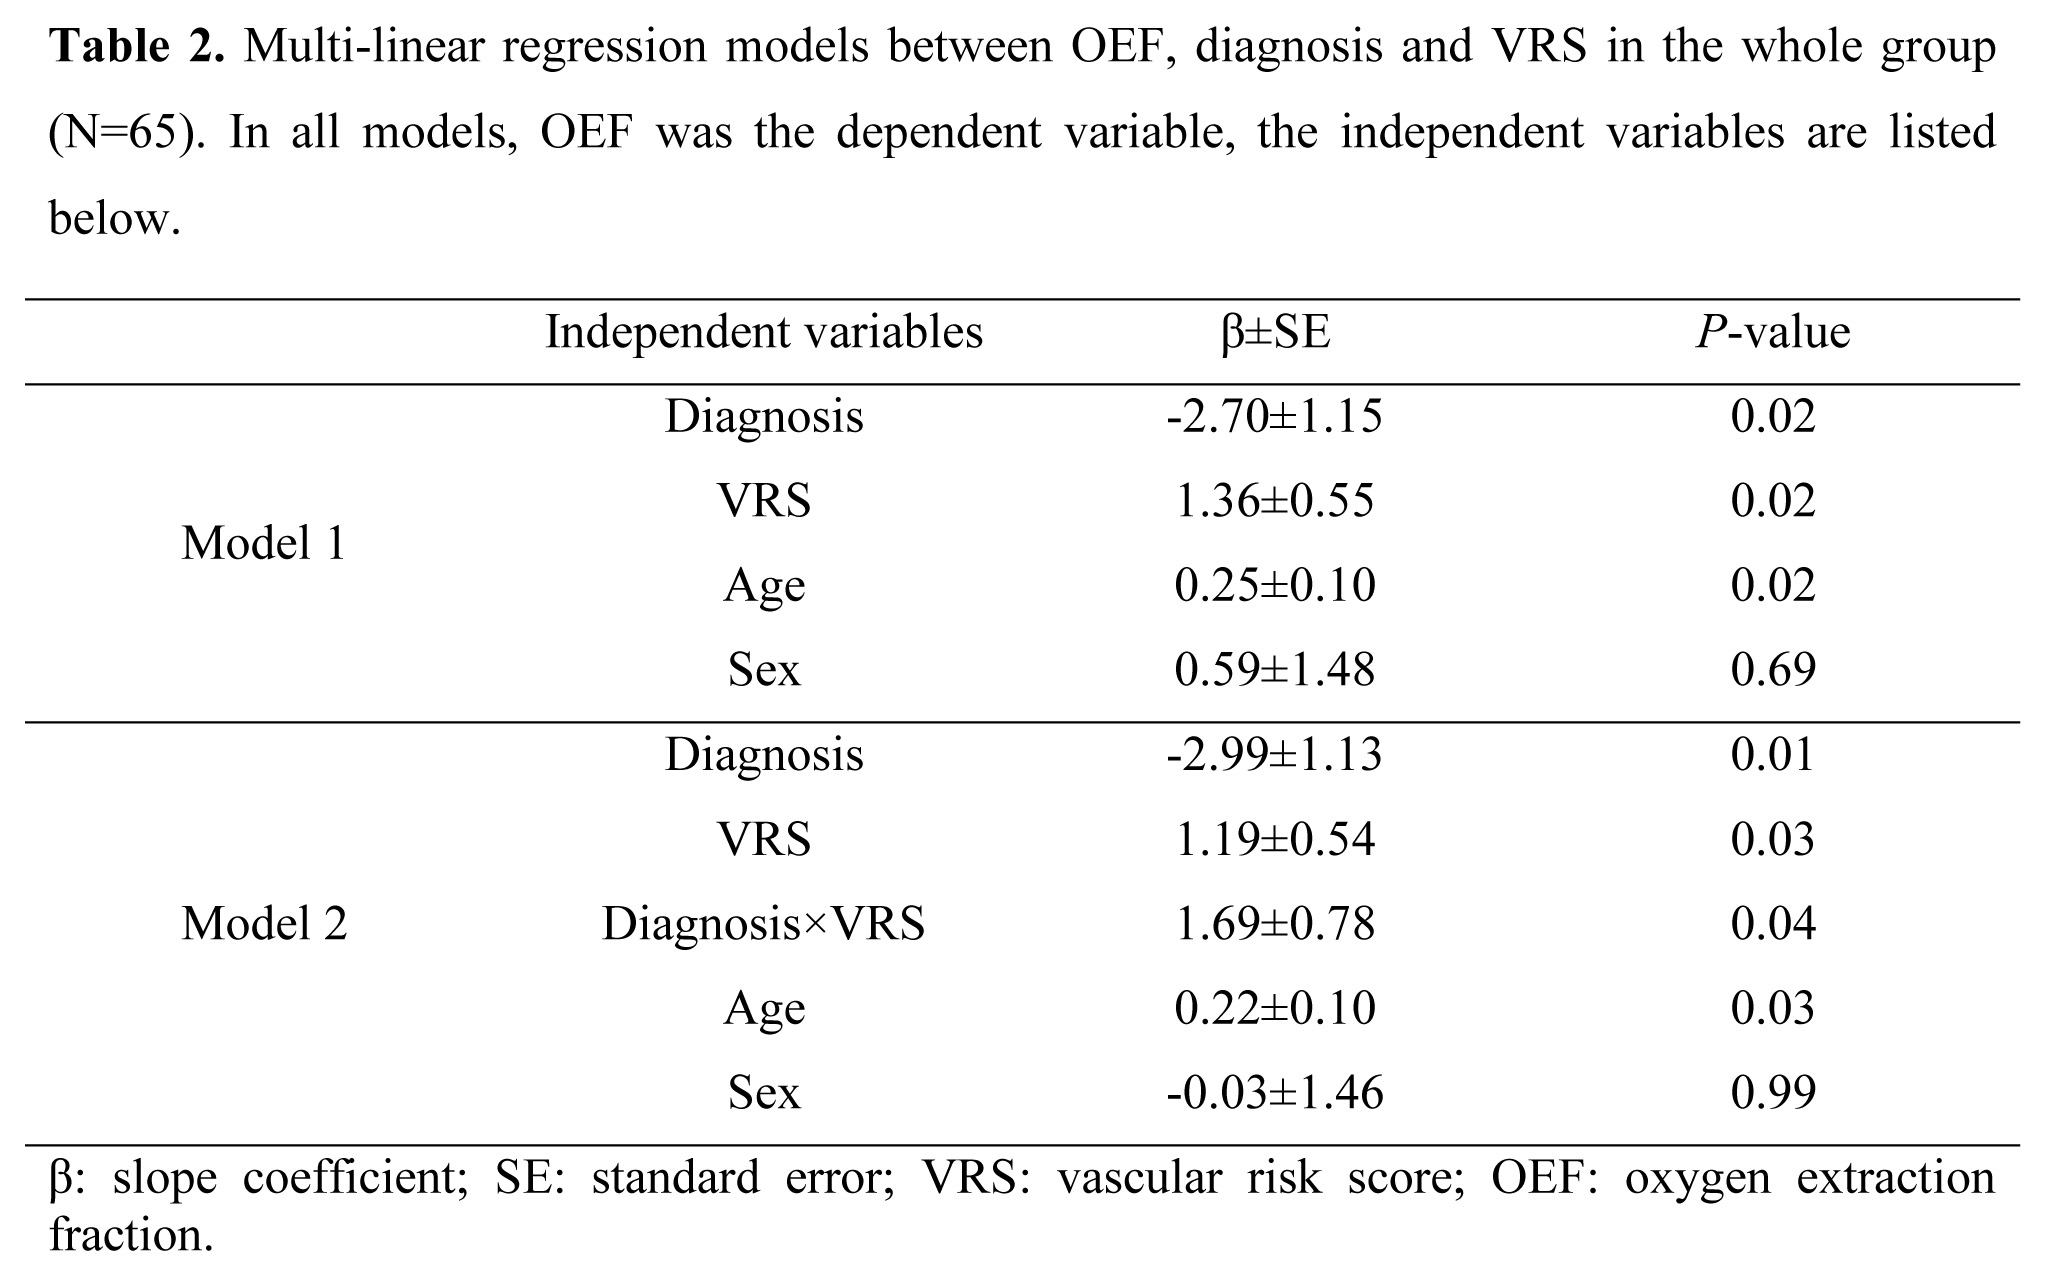
Multi-linear regression analyses were conducted in which OEF was the dependent variable while VRS and diagnosis (0=normal, 1=MCI, 2=dementia) were independent variables. A Diagnosis×VRS interaction term was also tested. If the interaction effect was significant, we then divided the subjects into subgroups: a low-VRS (≤2) subgroup and a high-VRS (>2) subgroup; or a normal subgroup and an impaired (MCI/dementia) subgroup, and examined their relationships to OEF. The associations of OEF with cognition and CSF amyloid or tau pathology were also examined. Age and sex were covariates in all analyses.
RESULTS AND DISCUSSION
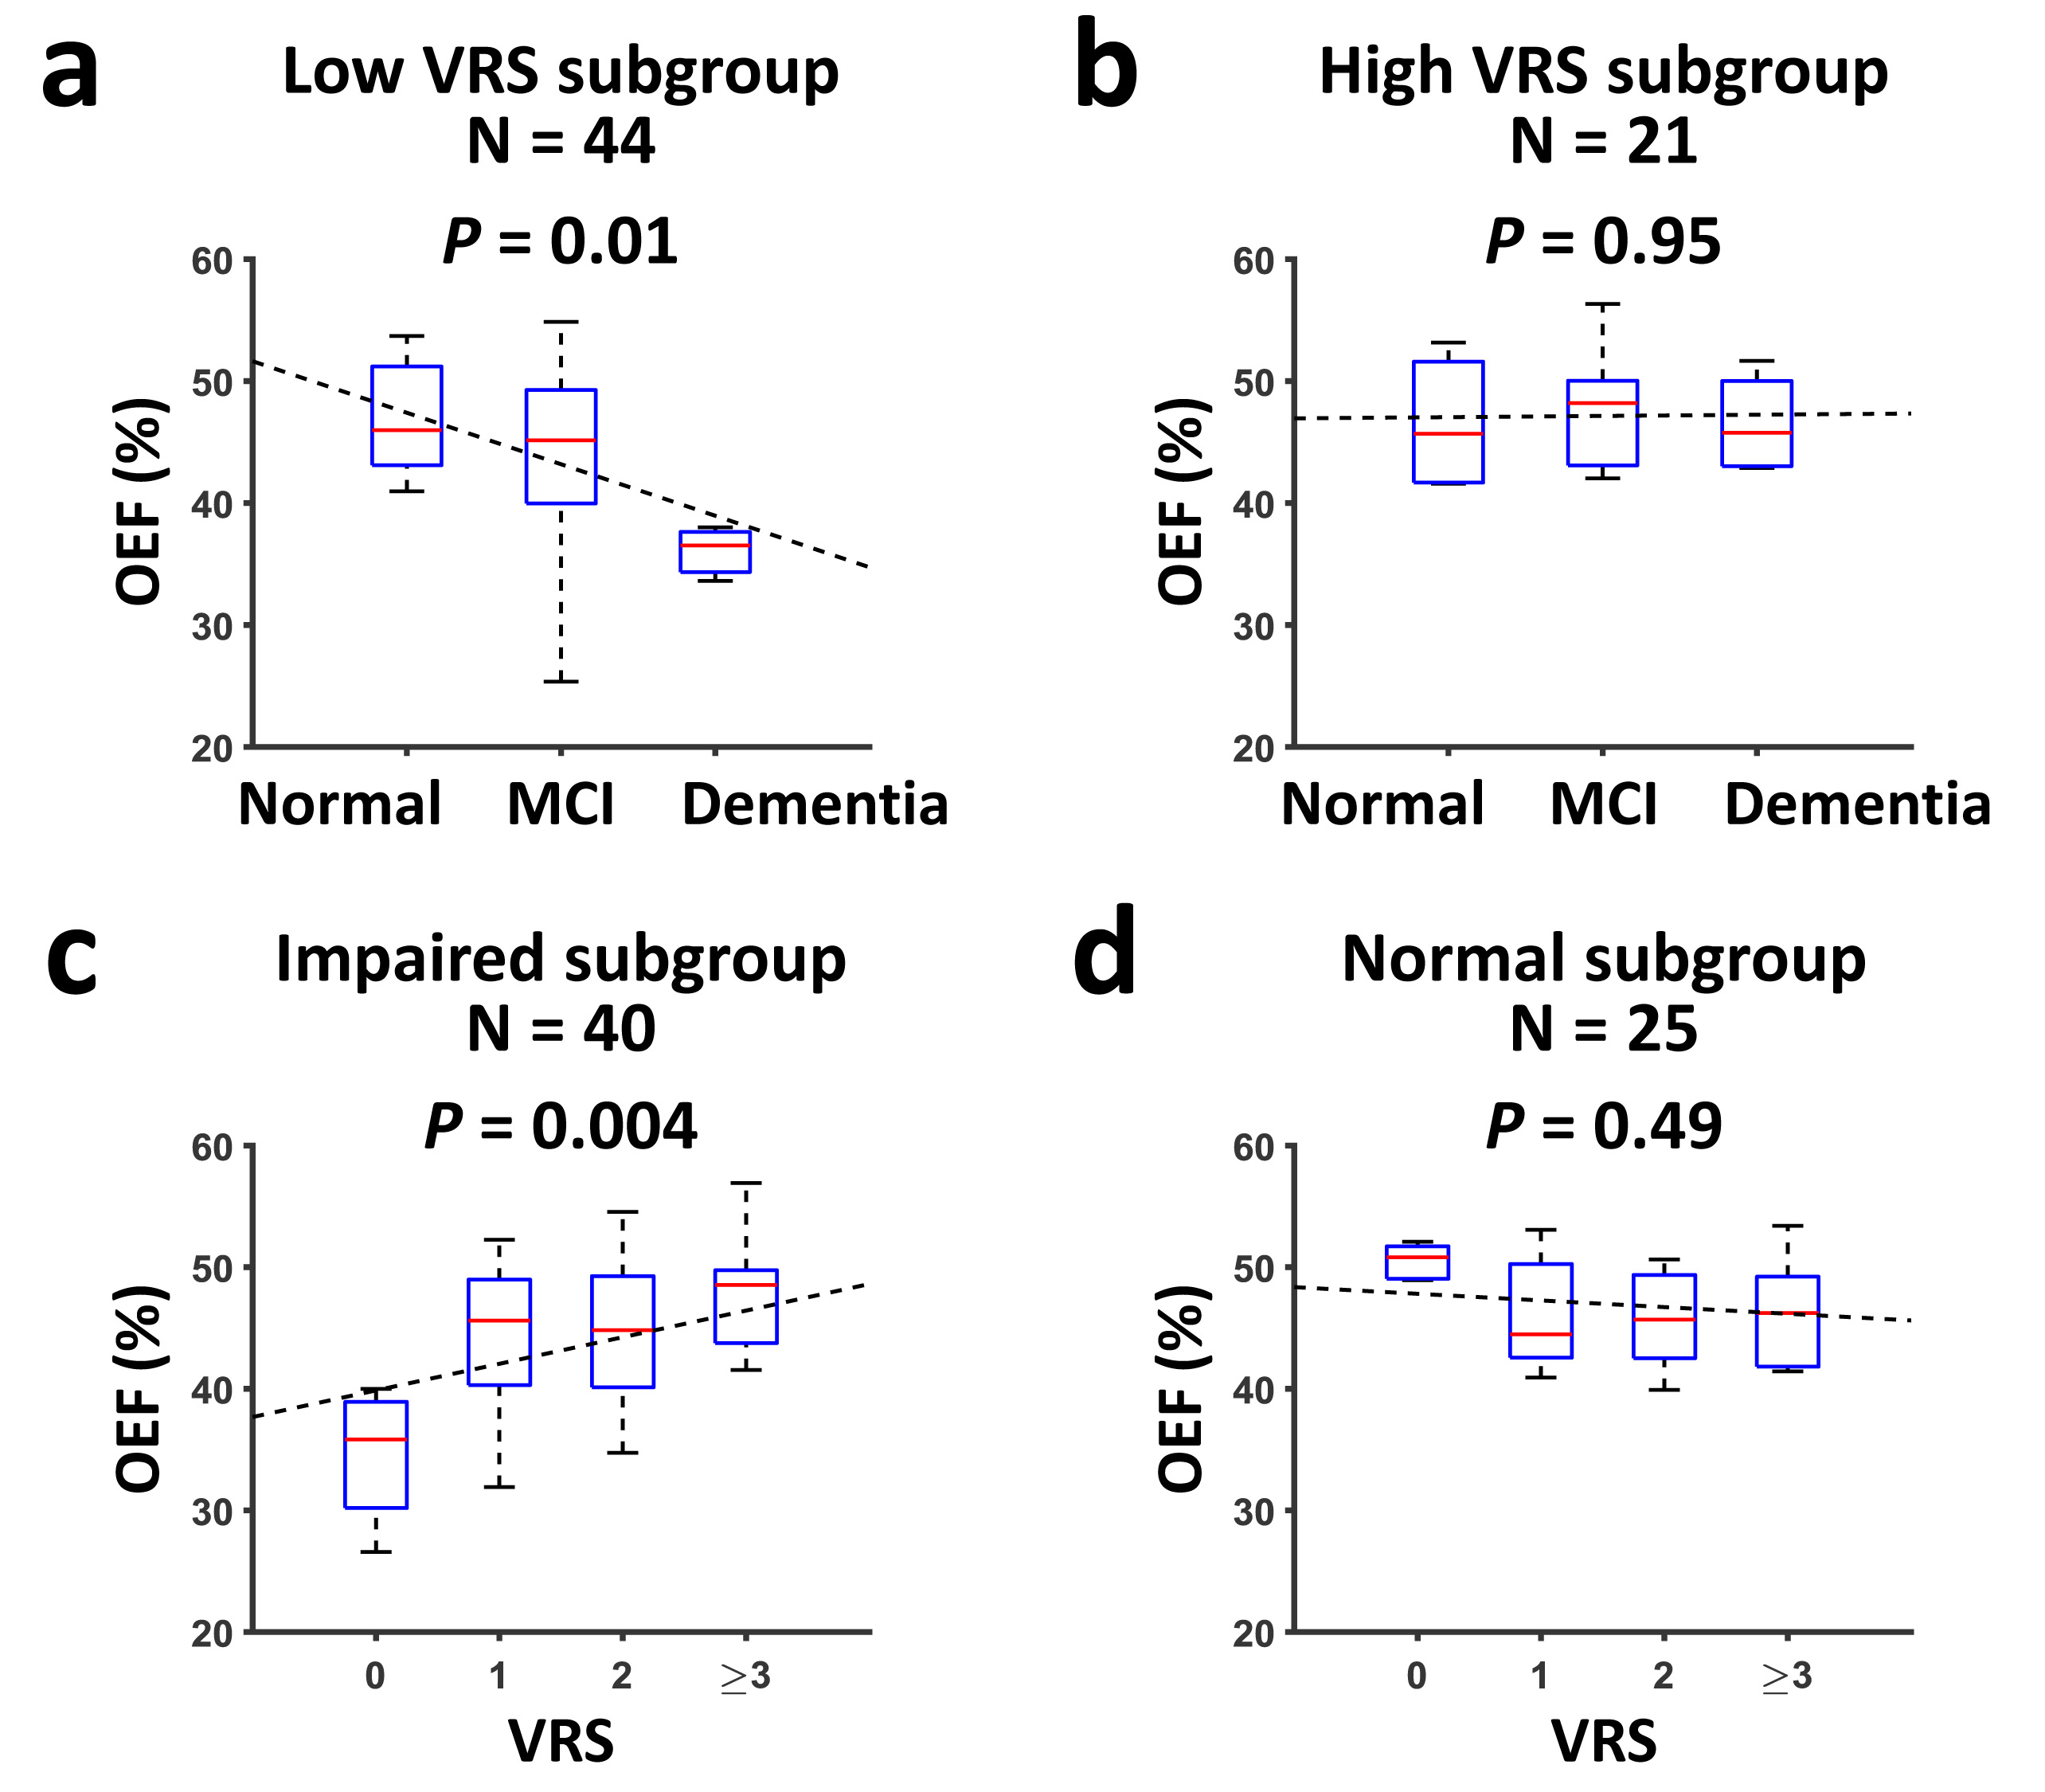
Table 1 lists the subjects’ characteristics. Figure 1 shows representative TRUST OEF data. Multi-linear regression analysis (Table 2, Model 1) revealed that OEF was negatively associated with diagnosis (P=0.02) but positively associated with VRS (P=0.02).Furthermore, a significant Diagnosis×VRS interaction effect was observed (P=0.04, Table 2, Model 2). Therefore, we divided the subjects into subgroups and conducted further analyses. We first divided the subjects by VRS. In the low-VRS subgroup (N=44), OEF was inversely associated with diagnosis (P=0.01, Figure 2a). Since the low-VRS impaired individuals are likely attributed primarily to AD, this observation supports our hypothesis that AD results in diminished OEF. On the other hand, in the high-VRS subgroup (N=21), OEF was not associated with diagnosis (P=0.95, Figure 2b).
Next, we separated the subjects by diagnosis. Among impaired individuals (MCI/dementia) (N=40), OEF was positively associated with VRS (P=0.004, Figure 2c), suggesting that in impaired patients, OEF can be used to differentiate those attributed to VCI from those attributed to AD. OEF was not associated with VRS (P=0.49) in normal subjects (N=25, Figure 2d).
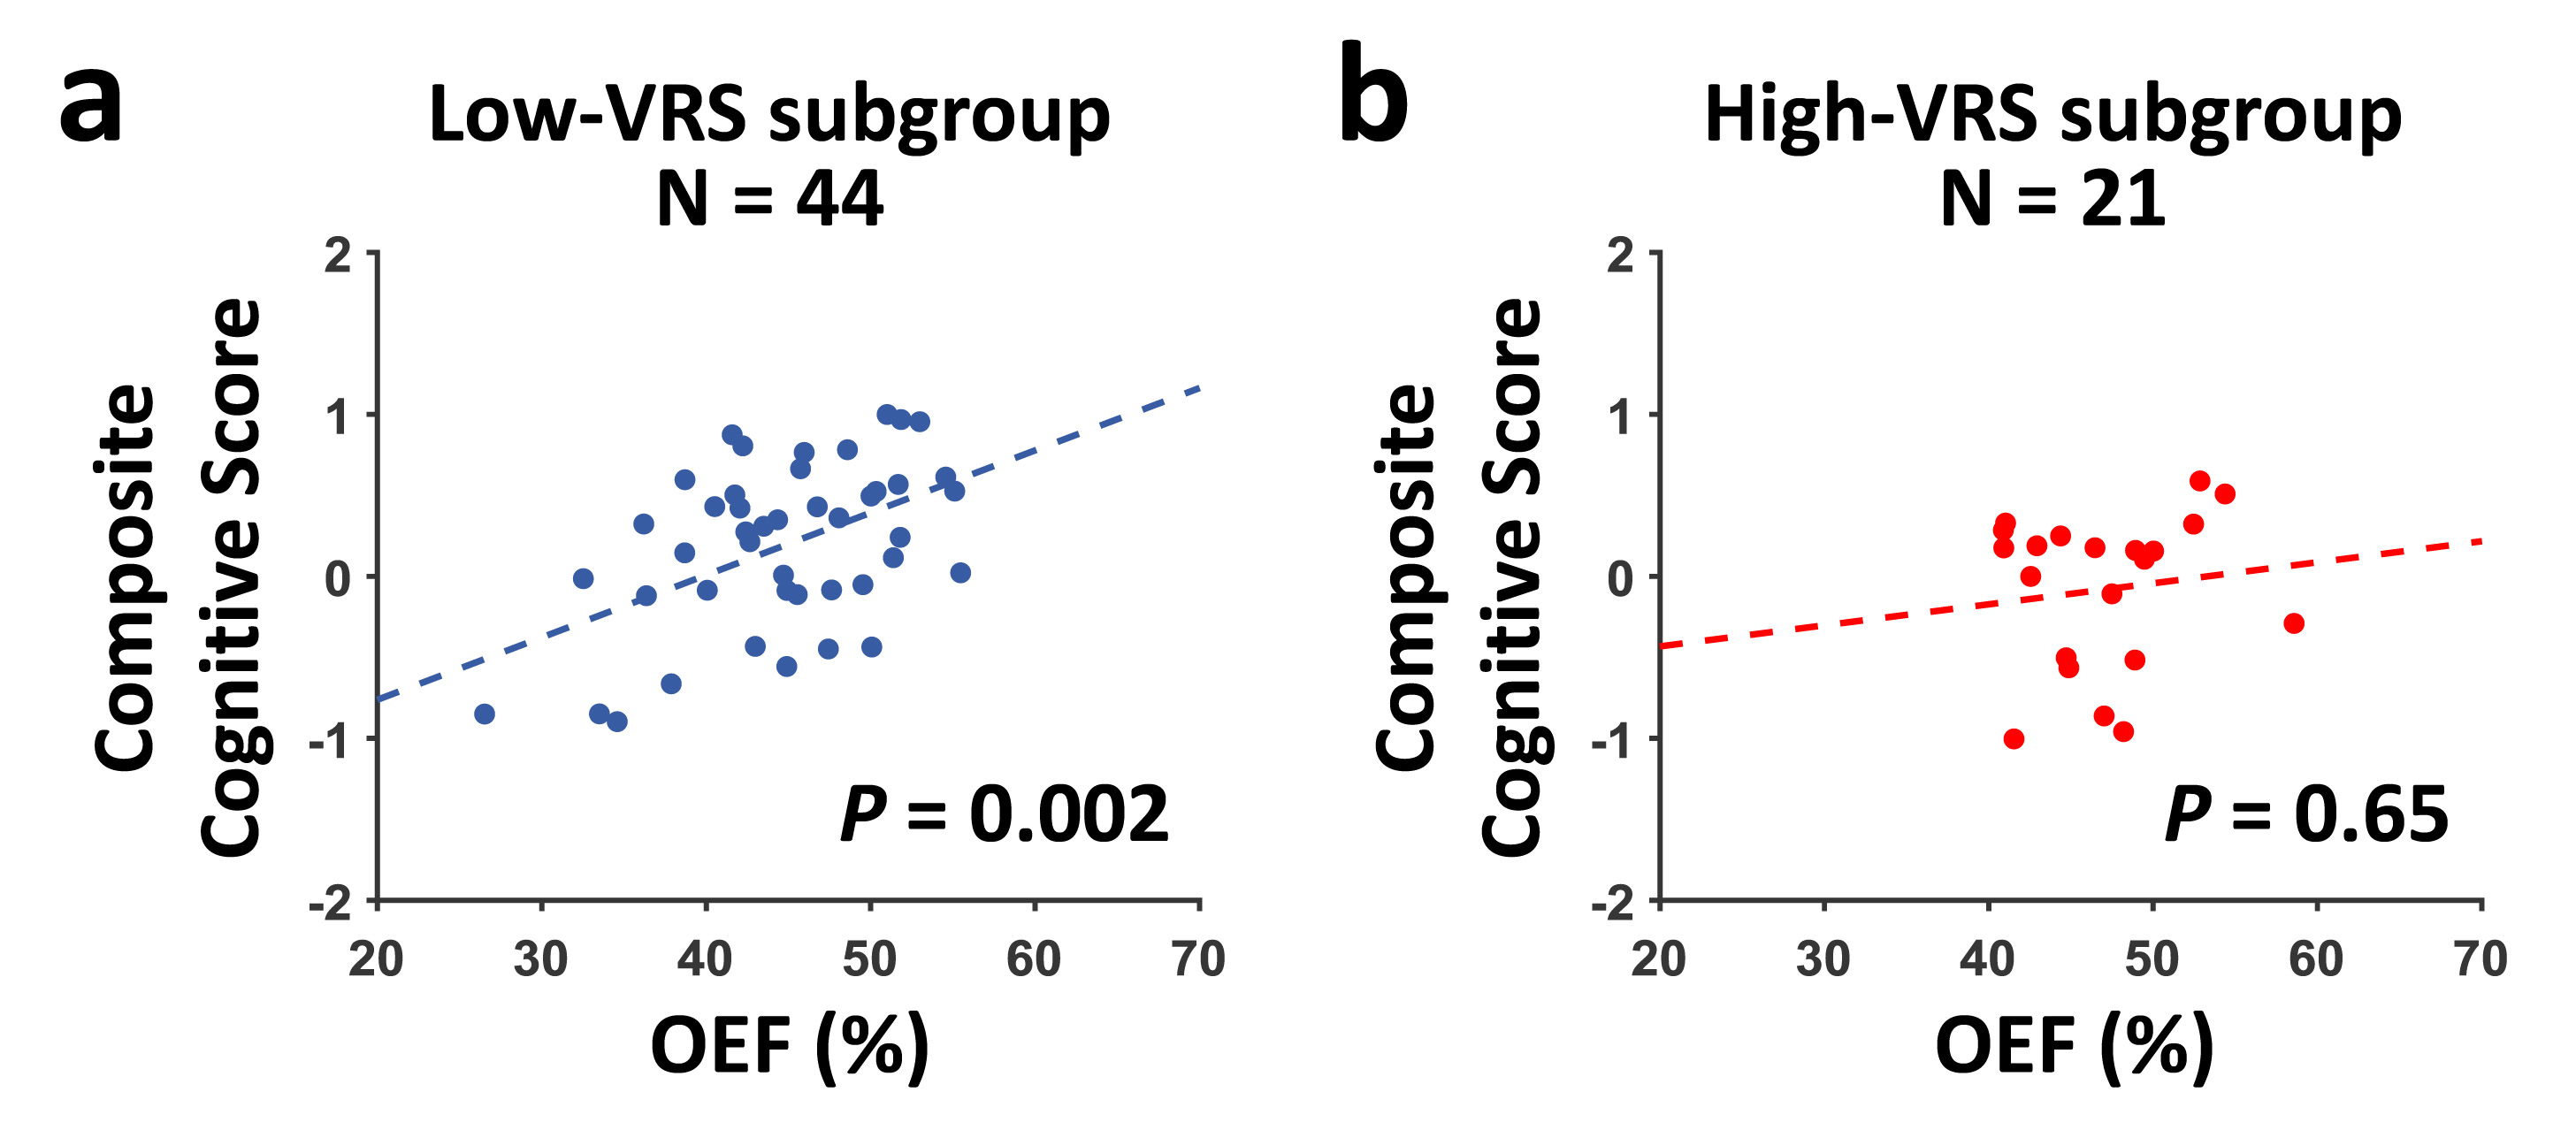
In the whole group, higher OEF was associated with better composite cognitive score (N=65, P=0.03). Further analyses showed that there was a positive association between OEF and composite cognitive score in the low-VRS subgroup (N=44, P=0.002, Figure 3a), but not in the high-VRS subgroup (N=21, P=0.65, Figure 3b).
In the subset of subjects (N=43) with CSF measurements, we found a trend of positive association between OEF and CSF Aβ42/Aβ40 ratio (P=0.06). Further analyses revealed that, OEF was positively associated with CSF Aβ42/Aβ40 ratio in the low-VRS subgroup (N=31, P=0.03). This, together with Figure 3a, strongly support that if the impairment is primarily attributed to AD, OEF is diminished due to reduced neural function. We found no association between OEF and Aβ42/Aβ40 ratio in the high-VRS subgroup (N=12, P=0.71). Similar analyses with total tau and p-tau yielded no significant effects on OEF (P>0.3).
CONCLUSION
This work showed that OEF is differentially affected by Alzheimer’s (decrease OEF) and vascular (increase OEF) pathology, suggesting that OEF may be useful in etiology-based diagnosis of cognitive impairment in elderly individuals. To further enhance the sensitivity and specificity of OEF to cognitive impairment, development of regional OEF measurement is underway.11,12Acknowledgements
No acknowledgement found.References
- Stevens T, Livingston G, Kitchen G, Manela M, Walker Z, Katona C. Islington study of dementia subtypes in the community. Br J Psychiatry 2002;180:270-276.
- Rosenberg GA, Wallin A, Wardlaw JM et al. Consensus statement for diagnosis of subcortical small vessel disease. Journal of Cerebral Blood Flow & Metabolism 2016;36:6-25.
- Roman GC, Erkinjuntti T, Wallin A, Pantoni L, Chui HC. Subcortical ischaemic vascular dementia. Lancet Neurol 2002;1:426-436.
- Buxton RB, Uludag K, Dubowitz DJ, Liu TT. Modeling the hemodynamic response to brain activation. Neuroimage 2004;23:S220-S233.
- Lu H, Ge Y. Quantitative evaluation of oxygenation in venous vessels using T2-Relaxation-Under-Spin-Tagging MRI. Magn Reson Med 2008;60:357-363.
- Jiang D, Deng S, Franklin CG, O'Boyle M, Zhang W, Heyl BL, Pan L, Jerabek PA, Fox PT, Lu H. Validation of T2 -based oxygen extraction fraction measurement with (15) O positron emission tomography. Magn Reson Med 2021;85:290-297.
- Albert MS, DeKosky ST, Dickson D, Dubois B, Feldman HH, Fox NC, Gamst A, Holtzman DM, Jagust WJ, Petersen RC. The diagnosis of mild cognitive impairment due to Alzheimer's disease: recommendations from the National Institute on Aging‐Alzheimer's Association workgroups on diagnostic guidelines for Alzheimer's disease. Alzheimer's & dementia 2011;7:270-279.
- Gottesman RF, Schneider AL, Zhou Y et al. Association Between Midlife Vascular Risk Factors and Estimated Brain Amyloid Deposition. JAMA 2017;317:1443-1450.
- Jiang D, Liu P, Li Y, Mao D, Xu C, Lu H. Cross-vendor harmonization of T2 -relaxation-under-spin-tagging (TRUST) MRI for the assessment of cerebral venous oxygenation. Magn Reson Med 2018;80:1125-1131.
- Jiang D, Lin Z, Liu P et al. Normal variations in brain oxygen extraction fraction are partly attributed to differences in end-tidal CO2. J Cereb Blood Flow Metab 2020;40:1492-1500.
- Jiang D, Lu H, Parkinson C, Su P, Wei Z, Pan L, Tekes A, Huisman T, Golden WC, Liu P. Vessel-specific quantification of neonatal cerebral venous oxygenation. Magn Reson Med 2019;82:1129-1139.
- Jiang D, Koehler R, Liu X, Kulikowicz E, Lee J, Lu H, Liu P. Quantitative validation of MRI mapping of cerebral venous oxygenation with direct blood sampling: a graded-O2 study in piglets. Magn Reson Med 2021. (Accepted).
Figures