0113
Estimation of fractional myocardial blood volume and water exchange using ferumoxytol-enhanced MRI1Physics and Biology in Medicine Graduate Program, David Geffen School of Medicine at UCLA, Los Angeles, CA, United States, 2Division of Cardiology, UCLA David Geffen School of Medicine, Los Angeles, CA, United States, 3Department of Radiology, UCLA David Geffen School of Medicine, Los Angeles, CA, United States, 4Institute of Cardiovascular & Medical Sciences, College of Medical, Veterinary and Life Sciences, University of Glasgow, Glasgow, United Kingdom, 5Diagnostic Cardiovascular Imaging Laboratory, Department of Radiological Sciences, UCLA David Geffen School of Medicine, Los Angeles, CA, United States
Synopsis
We optimized and tested a two-compartment water exchange model for fractional myocardial blood volume (fMBV) quantification. Nine healthy swine and one swine model with single-vessel coronary stenosis underwent MOLLI T1 imaging at 3.0 T following multiple individual ferumoxytol infusions. Healthy normal swine showed a mean mid-ventricular fMBV of 7.2 ± 1.4% and water exchange rate of 11.3 ± 5.1 s-1. In one swine model with artificially‑induced single-vessel coronary stenosis, quantitative pixel-wise fMBV showed regional differences in hypoperfused relative to perfused regions. This study demonstrates the feasibility of fMBV estimation using multi-dose ferumoxytol‑enhanced MRI with a two-compartment water exchange model.
Introduction
Fractional myocardial blood volume (fMBV) provides insight into myocardial ischemia severity beyond what is provided by myocardial blood flow (MBF) alone.1,2 Multi-compartmental modelling can be used to quantify fMBV from contrast‑enhanced cardiac MRI.3,4 True intravascular contrast agents eliminate the need to model contrast leakage into the extravascular space.5,6 One such agent is ferumoxytol, an ultrasmall superparamagnetic iron-oxide nanoparticle approved for the treatment of iron deficiency anemia and can be used off-label for diagnostic MRI. We hypothesize that ferumoxytol-enhanced (FE) T1 MRI can be combined with a two-compartment model to quantify fMBV as a proxy for myocardial perfusion. We optimized and tested a two-compartment water exchange model for fMBV quantification and to compared it to other proposed T1 MRI proxies of blood volume estimation.Methods
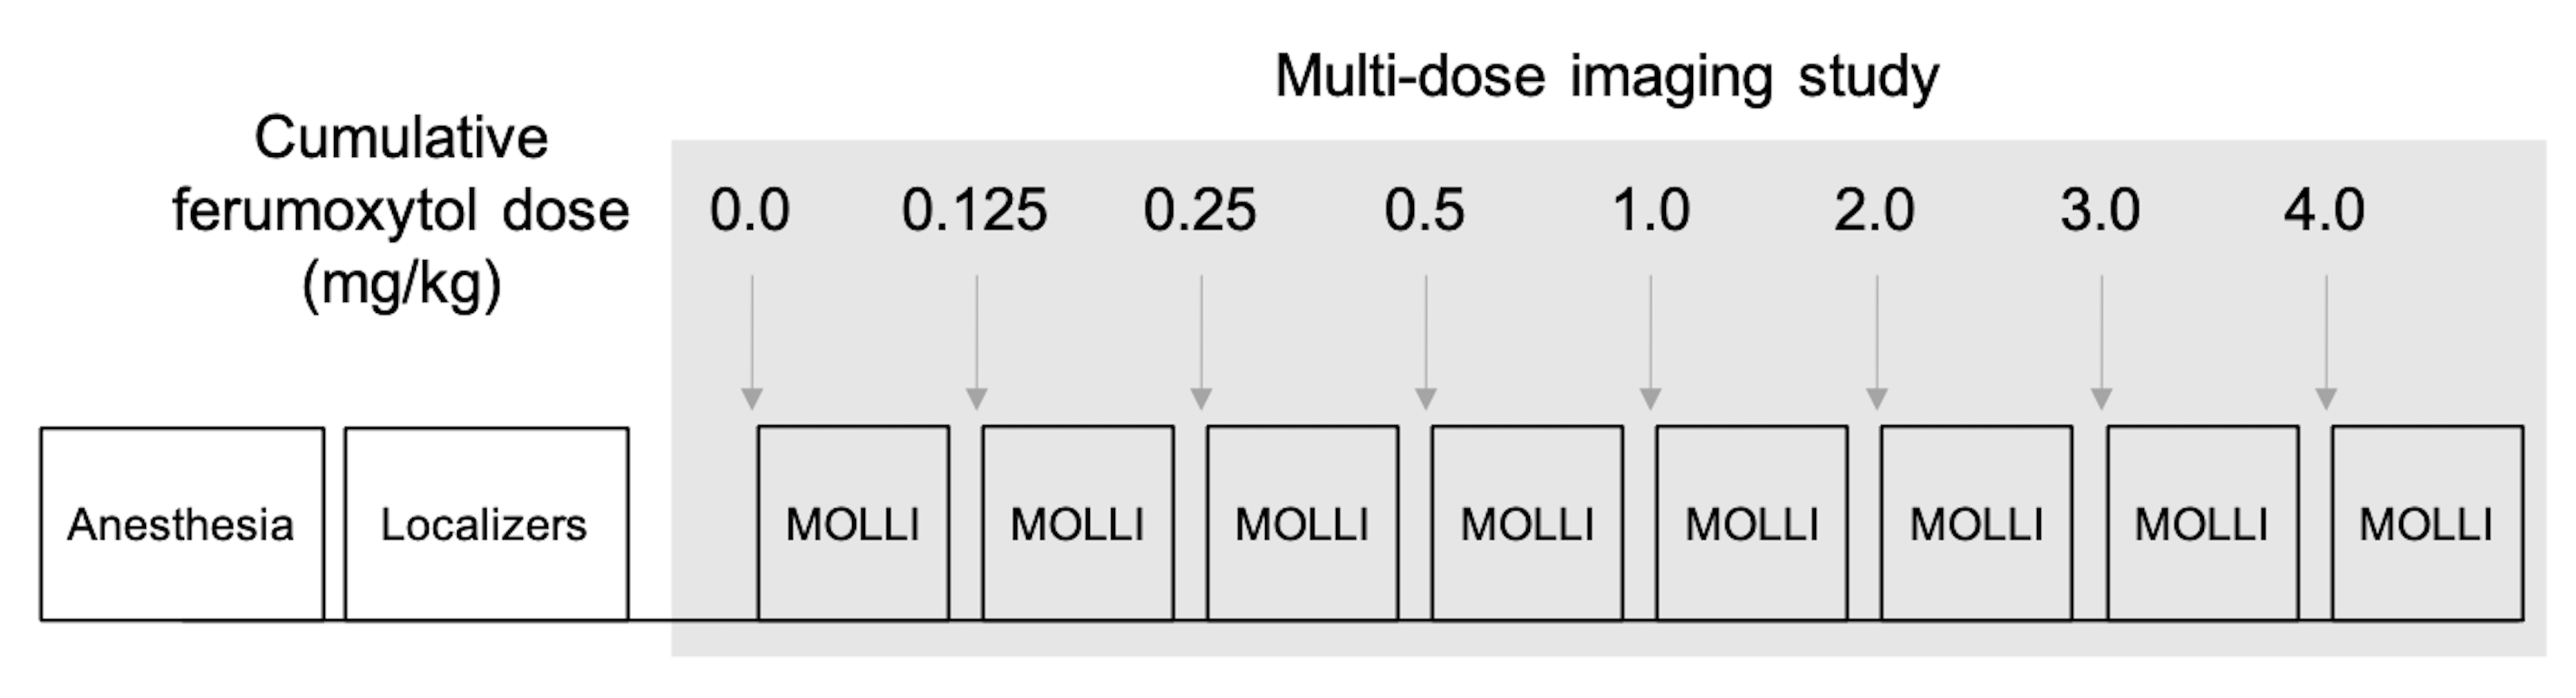
Nine healthy, normal swine and one swine model with artificially‑induced single-vessel coronary stenosis7,8 underwent MRI on a whole body clinical 3.0 T magnet (Prisma®, Siemens Medical Solutions USA, Malvern, PA). Myocardial longitudinal spin-lattice relaxation rate (R1) was measured using the 5(3)3(3)3 MOLLI sequence before and at contrast steady state following seven ferumoxytol infusions (0.125 – 4.0 mg/kg, Figure 1) for a cumulative ferumoxytol dose of 4mg/kg. fMBV and water exchange were estimated using a two-compartment model. Model-fitted fMBV was compared to the simple fast‑exchange fMBV approximation. Dose under-sampling schemes were investigated to reduce acquisition duration. Variation in fMBV was assessed with a one-way analysis of variance (ANOVA). Fast-exchange fMBV and ferumoxytol dose under-sampling were evaluated using Bland-Altman analysis.Results
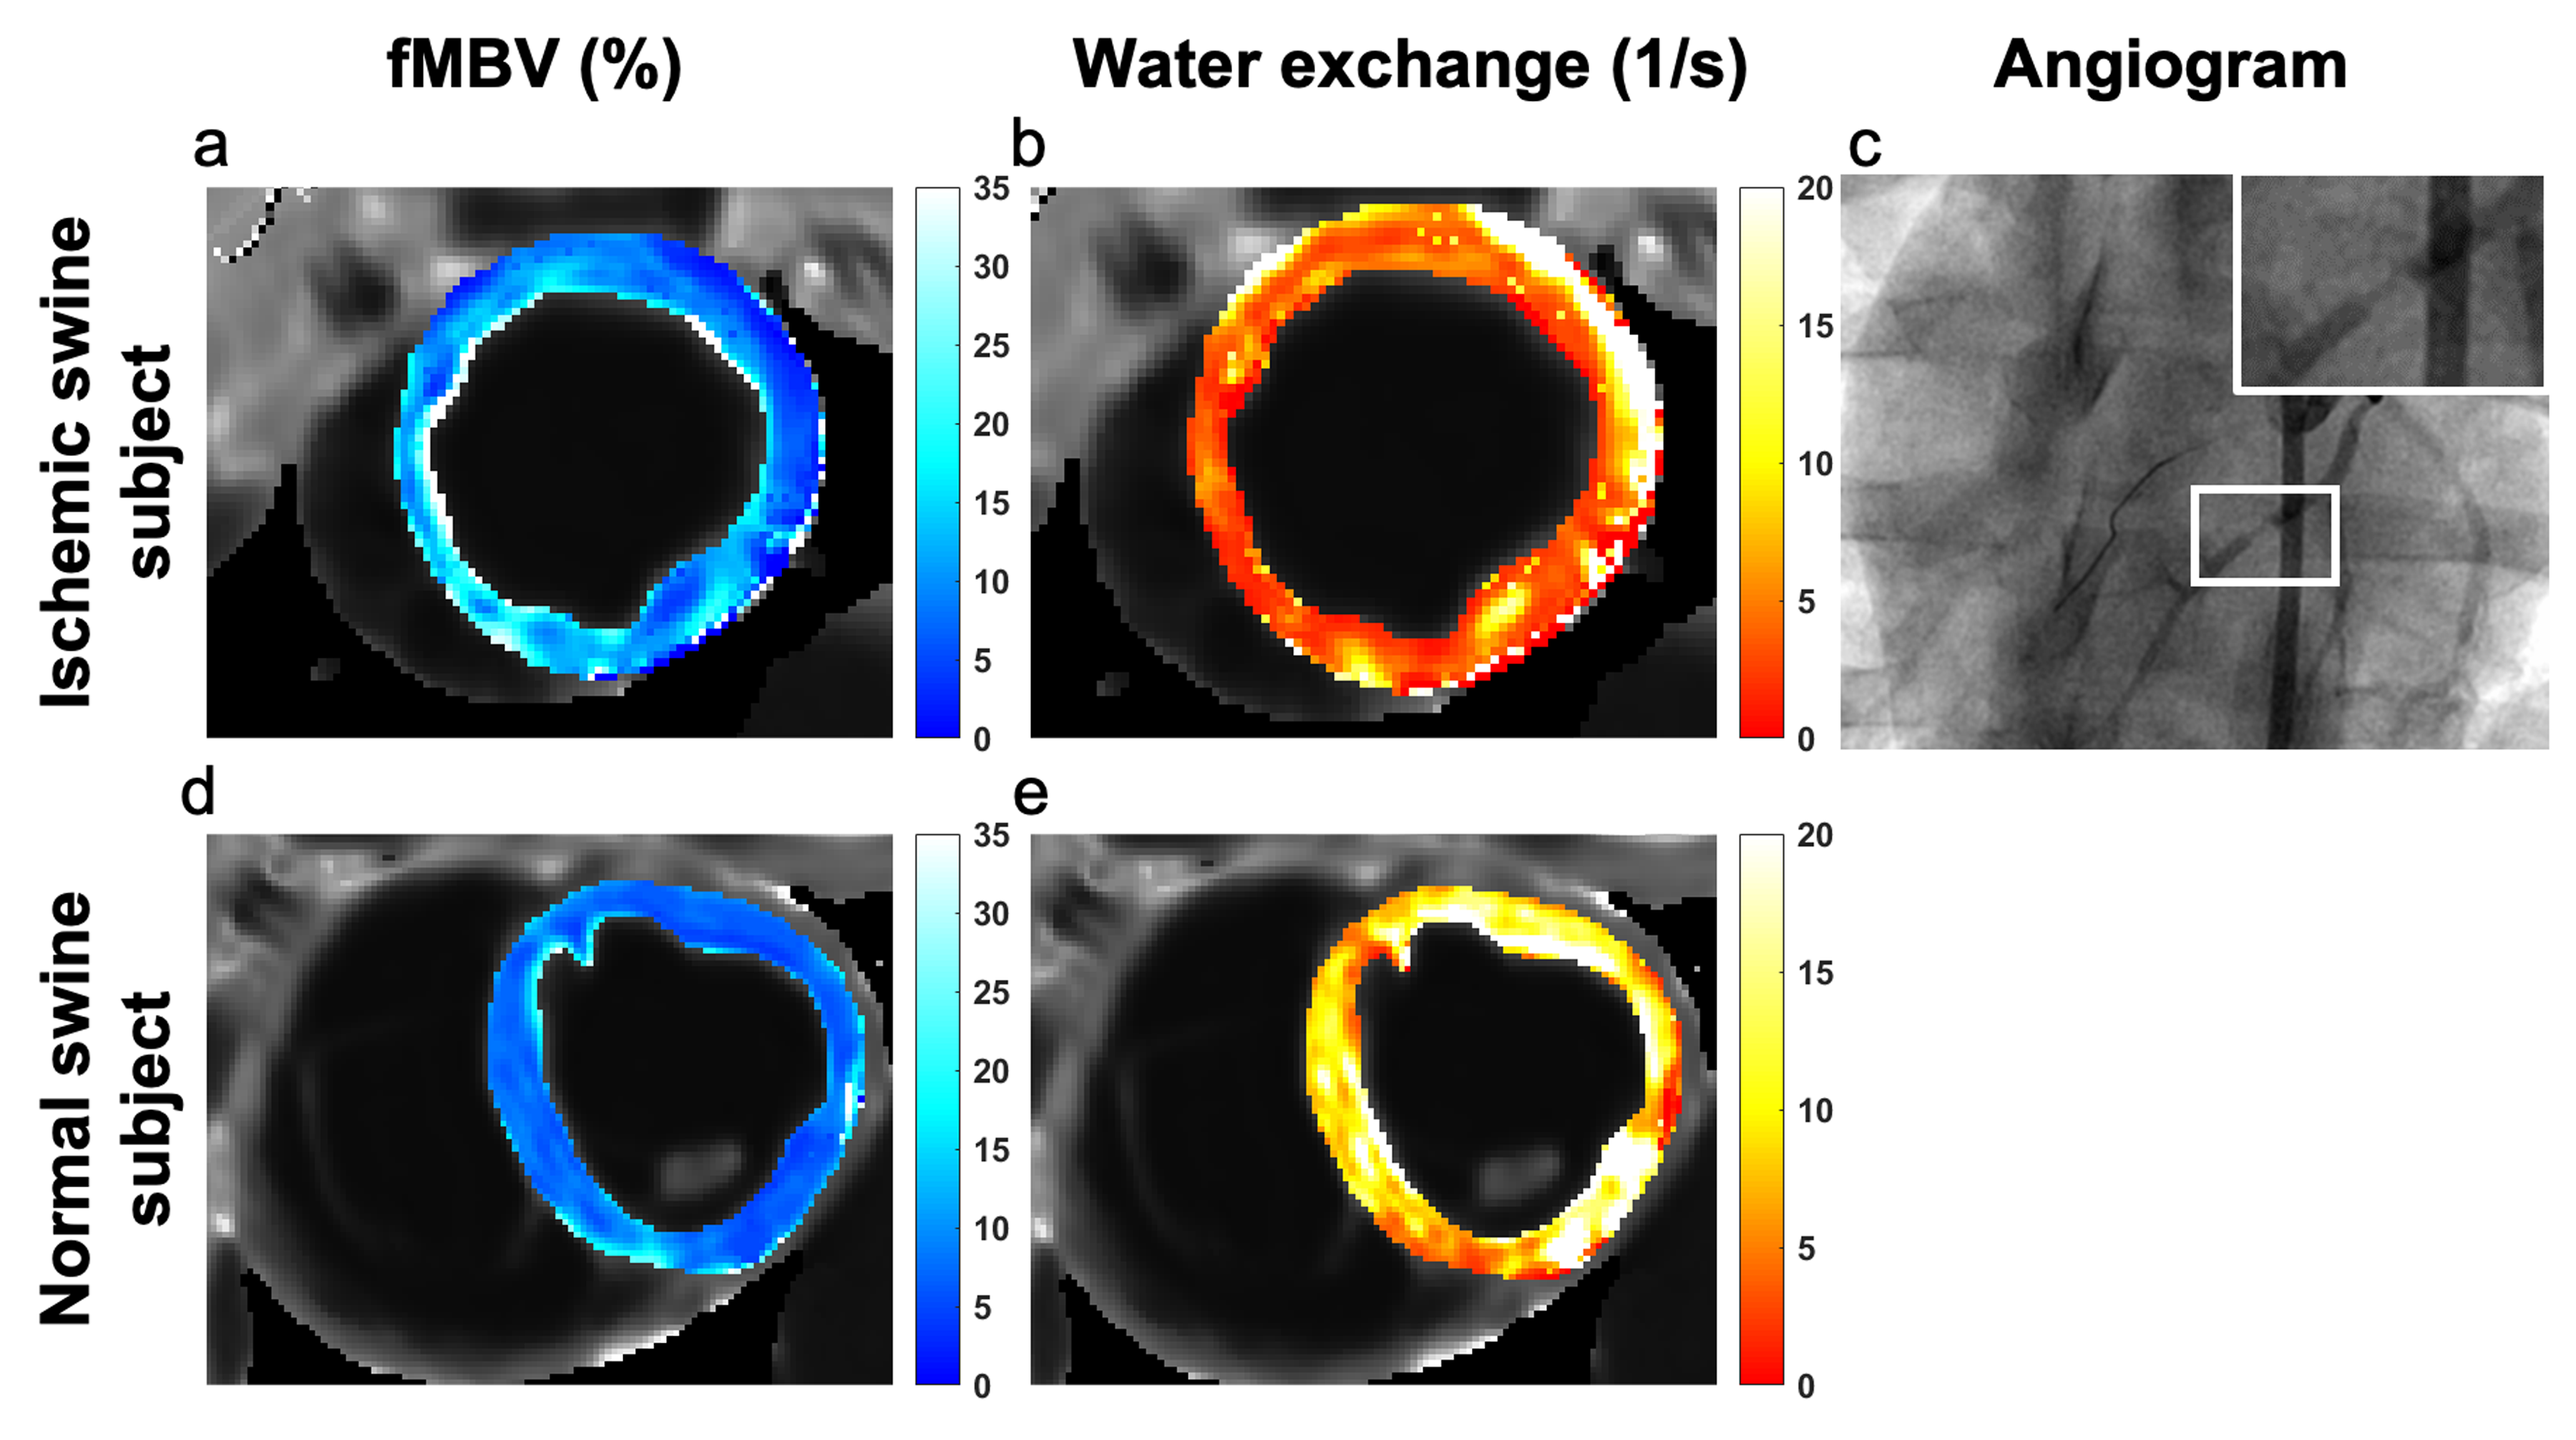
No ferumoxytol-related adverse events occurred. Prior to ferumoxytol infusion, the mid-ventricular myocardium and LV blood pool showed a mean native T1 of 1389 ± 23 ms and 1846 ± 73 ms, respectively. Following the cumulative infusion of 4.0 mg/kg, we found a steady state mean myocardial and blood pool T1 of 832 ± 26 ms and 115 ± 10 ms, respectively. Healthy normal swine showed a mean mid-ventricular fMBV of 7.2 ± 1.4% and water exchange rate of 11.3 ± 5.1 s-1. While we observed notable inter-subject variation in fMBV (p<0.05), we did not find a significant variation in fMBV among myocardial coronary territories on one-way ANOVA (p=0.387). Linear regression analysis showed a moderate correlation between fast-exchange fMBV at 2.0 mg/kg and model-fitted fMBV (r=0.71, p <0.05). fMBV derived from eight-dose and four-dose sampling schemes showed no significant bias (mean difference=0.07, p=0.541, limits of agreement ‑1.04% [-1.45, -0.62%] to 1.18% [0.77, 1.59%]). We used our two-compartment water exchange model to generate a pixel-wise fMBV map for a swine subject with myocardial hypoperfusion in the LAD coronary territory (Figure 2). We found a mean pixelwise fMBV of 11.90 ± 4.00%, 16.10 ± 5.71%, 9.59 ± 3.35%, and 9.38 ± 2.35% in the anterior, septal, inferior and lateral segments respectively. Quantitative pixel-wise fMBV showed regional differences in hypoperfused relative to perfused segments.Discussion
Our results demonstrate the feasibility of fMBV quantification from FE‑MRI using a two-compartment water exchange model in nine healthy, normal swine subjects and a single swine with artificially‑induced coronary stenosis. These findings have important clinical implications for the characterization of tissue perfusion. Several other approaches have been proposed to estimate fMBV, including simple fast-exchange fMBV. Although our calculations showed a significant correlation between simple fast-exchange fMBV and model-fitted fMBV, wide limits of agreement may obscure subtle changes in regional myocardial hypoperfusion.Published fMBV values range from 5% to 12% in human, swine and canine studies using the iron-based intravascular contrast agents ferumoxytol and NC100150.9,10 Our fMBV results in nine healthy swine models fall within this published range. Our fMBV values using a two-compartment water exchange model based on FE‑MRI are hypothesis-generating. We observed increased pixel-wise fMBV in the myocardial segment perfused by the stenosed left anterior descending (LAD) coronary artery relative to remote segments. Elevated fMBV has been proposed as a compensatory response in the setting of regional myocardial hypoperfusion downstream from a significant coronary stenosis.2
This study has some notable limitations. While we obtained a mean fMBV within the range of published values for similar studies conducted in humans and large animals, the broad range of published contrast doses, imaging pulse sequences and fitting algorithms complicate head‑to‑head comparisons of methodologies. Our preliminary observation of elevated fMBV in the myocardial territory perfused by the LAD provides very early evidence that tissue blood volume could potentially be used to discriminate between hypoperfused relative to perfused tissues.2,9 However, these findings clearly require further study and validation.
Conclusions
Two-compartment modelling for estimation of fMBV is feasible using steady-state MOLLI T1 mapping over multiple doses of the clinically available iron-based intravascular agent, ferumoxytol. fMBV derived from FE‑MRI may have the potential to provide a unique means of assessing myocardial perfusion.Acknowledgements
No acknowledgement found.References
1. McCommis KS, Goldstein TA, Abendschein DR, et al. Roles of myocardial blood volume and flow in coronary artery disease: an experimental MRI study at rest and during hyperemia. Eur Radiol. 2010;20(8):2005-2012. doi:10.1007/s00330-010-1740-8
2. Lindner JR, Skyba DM, Goodman NC, Jayaweera AR, Kaul S. Changes in myocardial blood volume with graded coronary stenosis. Am J Physiol. 1997;272(1 Pt 2):H567-75. http://www.ncbi.nlm.nih.gov/pubmed/9038980
3. Hazlewood CF, Chang DC, Nichols BL, Woessner DE. Nuclear Magnetic Resonance Transverse Relaxation Times of Water Protons in Skeletal Muscle. Biophys J. 1974;14(3):583-606.
4. Donahue KM, Weisskoff RM, Chesler DA, et al. Improving MR quantification of regional blood volume with intravascular T1 contrast agents: Accuracy, precision, and water exchange. Magn Reson Med. 1996;36(6):858-867. doi:10.1002/mrm.1910360608
5. Peters AM. Fundamentals of tracer kinetics for radiologists. Br J Radiol. 1998;71(NOV.):1116-1129. doi:10.1259/bjr.71.851.10434905
6. Koh TS, Bisdas S, Koh DM, Thng CH. Fundamentals of tracer kinetics for dynamic contrast-enhanced MRI. J Magn Reson Imaging. 2011;34(6):1262-1276. doi:10.1002/jmri.22795
7. Colbert CM, Shao J, Hollowed JJ, et al. 3D-Printed Coronary Implants Are Effective for Percutaneous Creation of Swine Models with Focal Coronary Stenosis. J Cardiovasc Transl Res. Published online May 11, 2020:1-11. doi:10.1007/s12265-020-10018-3
8. Hollowed JJ, Colbert CM, Currier JW, Nguyen K-L. Novel Percutaneous Approach for Deployment of 3D Printed Coronary Stenosis Implants in Swine Models of Ischemic Heart Disease. J Vis Exp. Published online 2020:e60729. doi:10.3791/60729
9. Bane O, Lee DC, Benefield BC, et al. Leakage and water exchange characterization of gadofosveset in the myocardium. Magn Reson Imaging. 2014;32(3):224-235. doi:10.1016/j.mri.2013.10.014
10. Bjørnerud A, Bjerner T, Johansson LO, Ahlström HK. Assessment of myocardial blood volume and water exchange: Theoretical considerations and in vivo results. Magn Reson Med. 2003;49(5):828-837. doi:10.1002/mrm.10430
Figures