0109
High-resolution visualization of isotropically restricted diffusion in brain by strong spherical dMRI and super-resolution reconstruction1Diagnostic Radiology, Clinical Sciences Lund, Lund University, Lund, Sweden
Synopsis
Strong spherical diffusion encoding enables visualization of isotropically restricted regions in the human brain, believed to resemble densely packed cells. As this forces imaging in a low SNR regime, visualization has been limited to a low resolution to avoid deleterious signal bias caused by the noise floor. In this work, we propose a novel method based on super-resolution reconstruction to enable high-resolution visualization of isotropically restricted diffusion in human brain in vivo. We show that our method is superior over conventional methods with acquisition times that are compatible with clinical routine.
Introduction
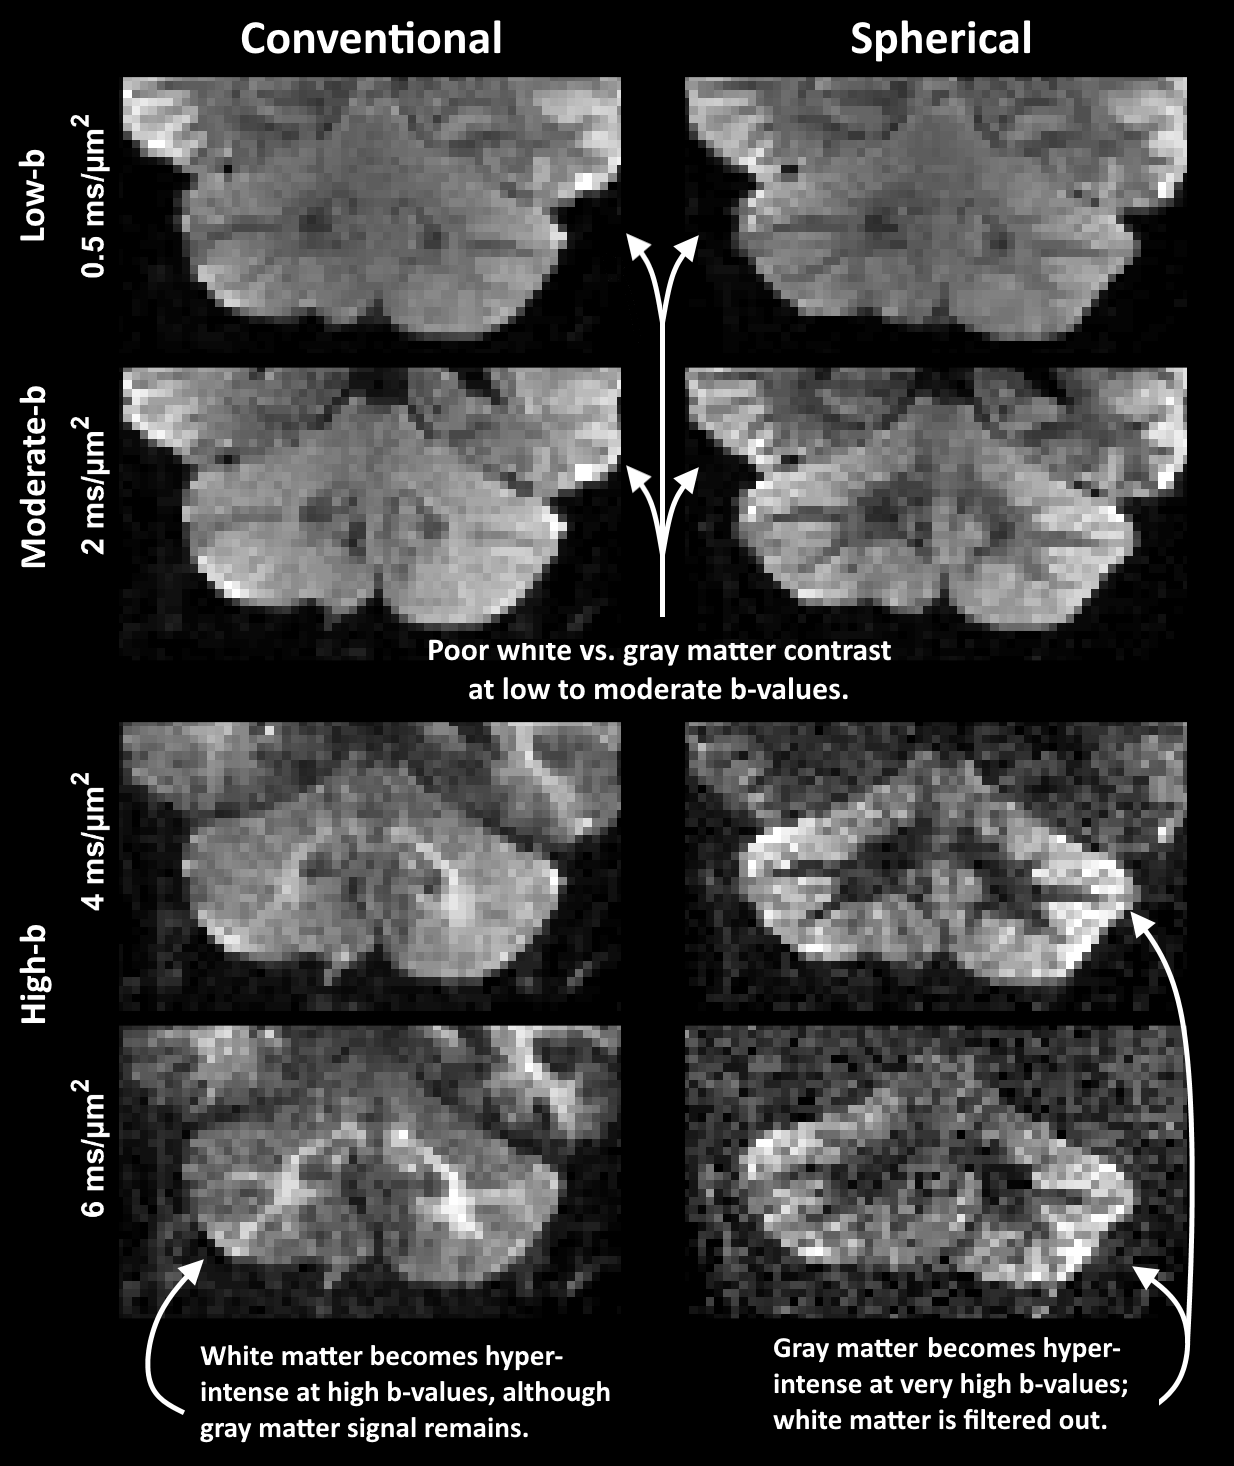
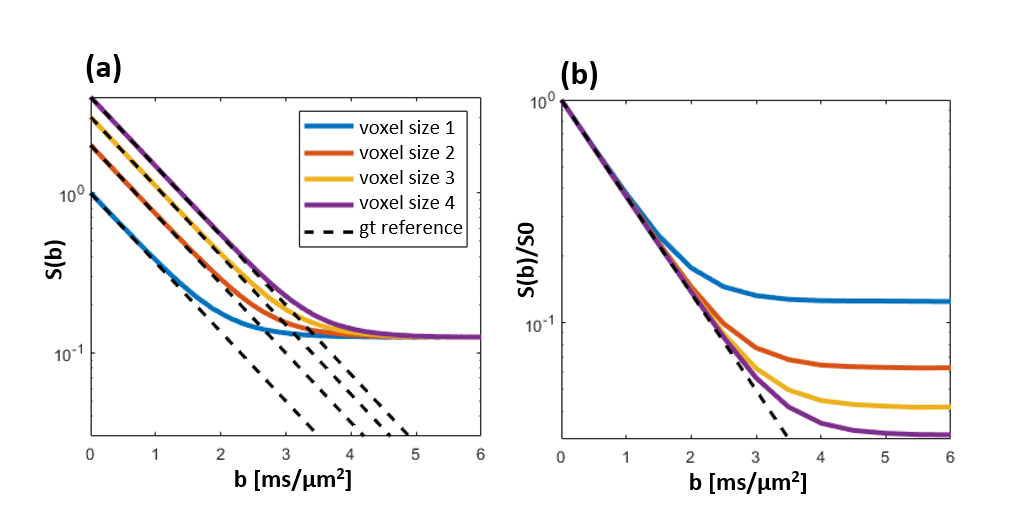
Diffusion MRI with spherical tensor encoding at ultrahigh b-values emphasizes regions that are isotropically restricted (Fig. 1). Brain imaging shows such regions in the cerebellar cortex, which are affected in diseases as spinocerebellar ataxis and Alzheimer disease1,2. However, imaging with ultrahigh b-values causes low SNR which can bias the signal due to the rectified noise floor. This problem cannot be alleviated by averaging multiple magnitude images3. Current methods employing ultrahigh b-values resort to low spatial resolution to avoid the noise floor (Fig. 2). In this work, we demonstrate unprecedented spatial resolution with spherical diffusion encoding at ultrahigh b-values by the use of super-resolution reconstruction. Results show that it is vastly superior compared to direct sampling in terms of contrast and accuracy.Principle
When diffusion encoding is performed at very high b-values, the signal that remains can be attributed to restrictions that cause the apparent diffusivity to approach zero4,5. For conventional diffusion encoding (along a single direction at a time) the remaining signal may originate from any structure that happens to be restricted along the diffusion encoding direction, including water trapped in cell bodies or inside axons. However, with spherical diffusion encoding only signal from compartments restricted in all directions remains (Fig.1). Therefore, whatever signal remains for spherical encoding at high b-values, must be isotopically restricted, and we refer to it as the “dot fraction” 6,7.Methods
Imaging the dot fractionWe assume a compartment with signal fraction $$$f_{\mathrm{dot}}$$$ and isotropic diffusivity $$$D_{\mathrm{dot}}$$$ close to zero, accompanied by a fraction of other tissue $$$(f_{\mathrm{other}} = 1 - f_{\mathrm{dot}})$$$ with non-zero isotropic diffusivity. The diffusion weighted signal $$$S(b)$$$ when using spherical tensor encoding is then given by $$S(b) = S0\cdot(f_{\mathrm{dot}}\exp(-b\cdot D_\mathrm{dot}) + f_\mathrm{other}\exp(-b\cdot D_\mathrm{other})),\qquad(1) $$ where $$$S0$$$ is the non-diffusion weighted signal. When approaching ultrahigh b-values, the contribution from other compartments is suppressed $$$(\exp(-b_{\mathrm{high}}\cdot D_{\mathrm{other}}) \approx 0)$$$ whereas signal in the dot compartment remains $$$(b_{\mathrm{high}}\cdot D_{\mathrm{dot}} \approx 0 \rightarrow \exp(-b_{\mathrm{high}}\cdot D_{\mathrm{dot}}) \approx 1),$$$which simplifies Eq. 1 to6,7 $$S(b) \approx S0\cdot f_{\mathrm{dot}}.\qquad(2) $$ The resulting map is weighted by both T2 and $$$f_{\mathrm{dot}}$$$, and will show high intensity where diffusivity is isotropically restricted. It should be noted that $$$f_{\mathrm{dot}}$$$ only sets an upper limit on the dot fraction7.
Data acquisition
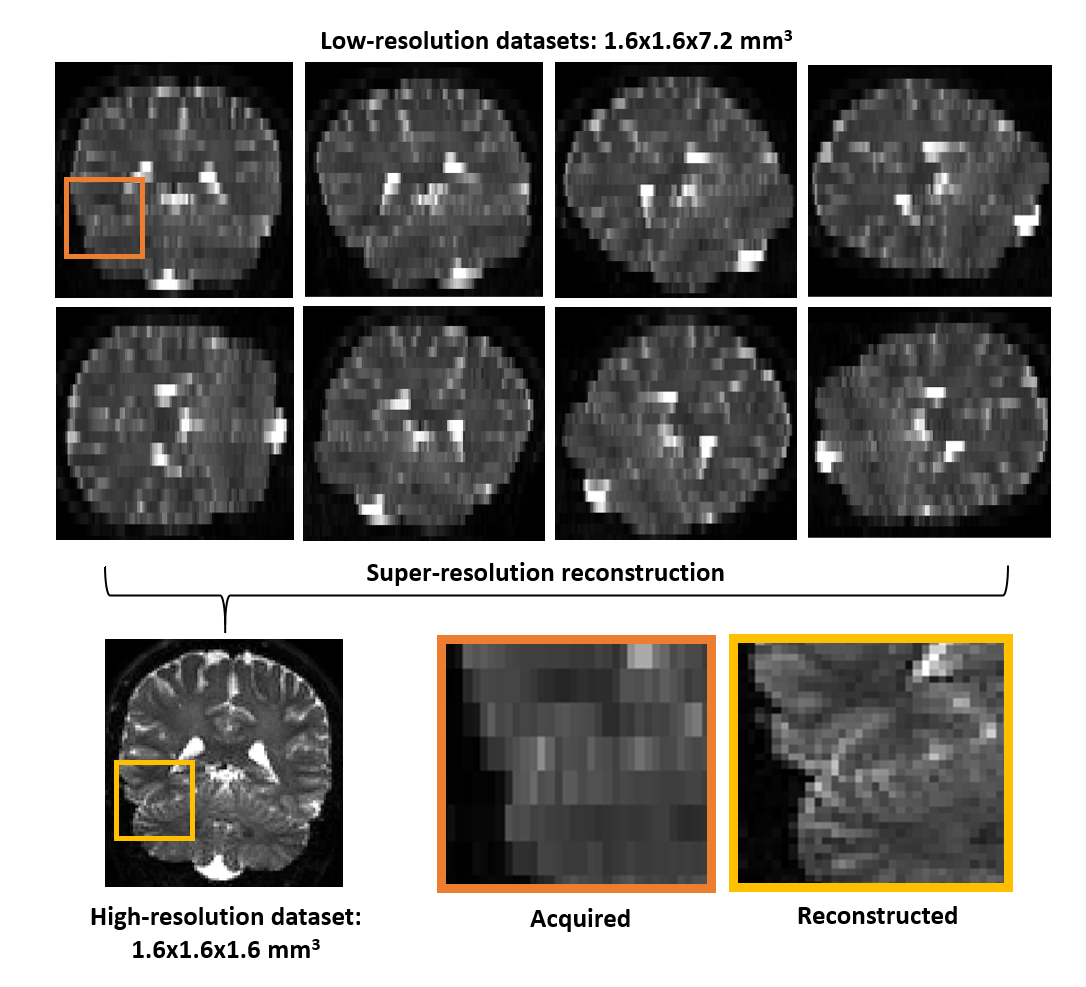
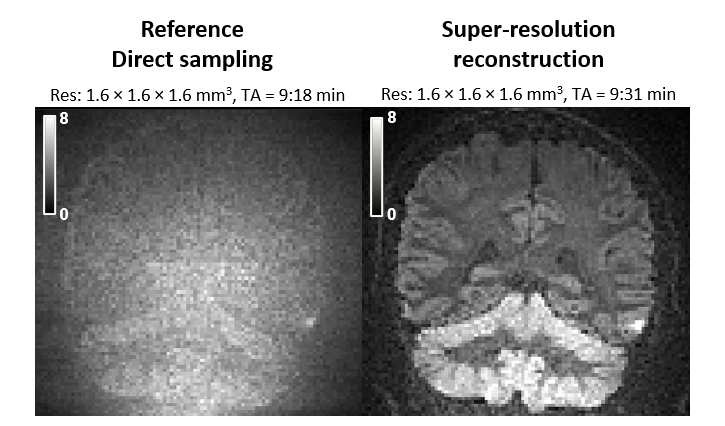
A healthy volunteer was scanned on a Siemens 3T-Prisma (Siemens Healthineers, Germany) using a 20-channel head and neck coil. We used a prototype spin-echo EPI pulse sequence enabling spherical tensor encoding8-10. To enable super-resolution reconstruction, we performed imaging with eight rotations of the FOV at resolution 1.6x1.6x7.2 mm3 (all shared the same phase encoding direction, Fig. 3). For each FOV rotation, we acquired 13 repetitions of spherical b-tensors at b = 4 ms/μm2. We used TR/TE=4.2s/120ms, giving a total acquisition time of 9:31 min. For reference, 15 repetitions of the same b-tensors were acquired directly at 1.6x1.6x1.6 mm3 at TR/TE=14.2s/120ms with an acquisition time of 9:18 min. All data were denoised using Marchenko-Pastur PCA11,12, averaged over repetitions and assessed qualitatively. The gray-to-white matter signal ratio was calculated between gray matter voxels in the cerebellar cortex and white matter voxels in the cerebellum.
Super-resolution reconstruction
We reconstructed the acquired images to a resolution of 1.6x1.6x1.6 mm3 using super-resolution reconstruction. This approach produces a high-resolution image from multiple low-resolution images, which boosts SNR and thereby suppresses noise-floor effects (Fig. 3). We used a regularized least-squares solution using the pseudo-inverse13,14 $$ \mathbf{x = ( A^{T}A + \lambda I)^{-1}A^{T}} \qquad(3)$$ where $$$\bf x$$$ is the high-resolution image to recover, $$$\bf y$$$ are the measured low-resolution signal samples, $$$\bf I$$$ is the identity matrix, $$$\lambda$$$ is a scalar weight determining the regularization strength set to 0.05 and $$$\bf A$$$ is the sampling matrix, which was constructed from the geometric imaging parameters.
Results
Super-resolution reconstruction shows a marked improvement over direct sampling in visualization of the cerebellar cortex at high b-values and high resolution, for similar acquisition times (Fig. 4). Direct sampling leads to poor image contrast throughout the brain, whereas the super-resolution reconstruction exhibits vastly improved contrast. Most prominent are the tightly packed granule cells of the cerebellar cortex, where the gray-to-white matter signal ratio is 1.06 for direct sampling and 1.82 for super-resolution reconstruction.Discussion and conclusions
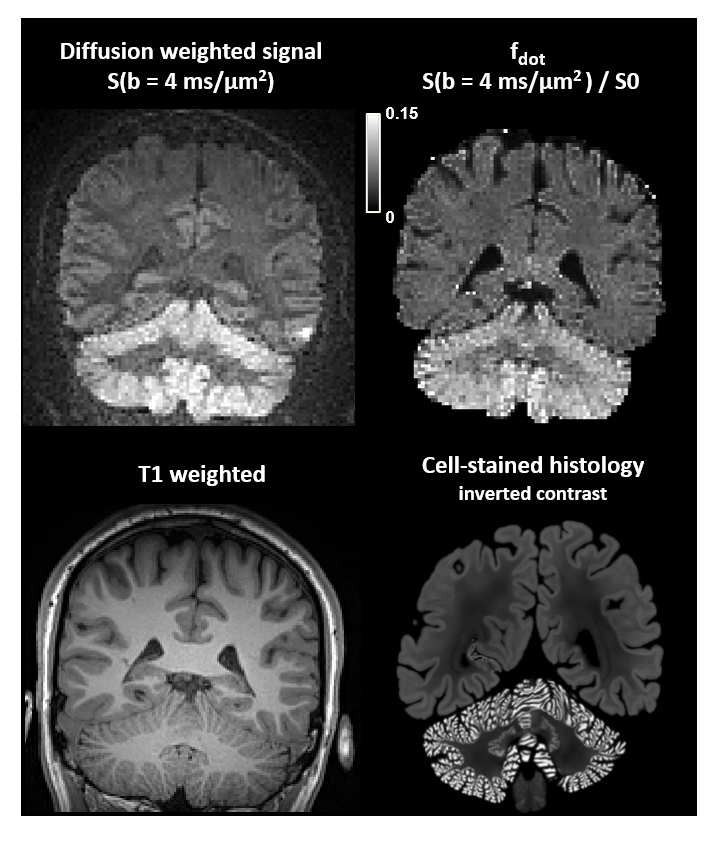
Combining spherical tensor encoding, ultrahigh b-values, and super-resolution reconstruction enables high-resolution imaging of the dot fraction with improved contrast compared to conventional imaging. We demonstrated this in whole-brain in vivo at a resolution of 1.6x1.6x1.6 mm3 on a clinical scanner. Previous acquisitions with spherical encoding and ultra-high b-values were done at a resolution of 4.0x4.0x4.0 mm3 on a connectome scanner7.Most strikingly, a high signal can be observed in the cerebellar cortex which is populated by densely packed granule cells (Fig. 5)7,15. This observation supports the hypothesis that granule cells and/or their extracellular space is highly restrictive to diffusion in all spatial directions. Therefore, we speculate that the proposed image contrast may be used to detect diseases affecting these cells. However, the contrast may be confounded by T2 shine-through (compare S(b=4) vs. $$$f_{\mathrm{dot}}$$$ in Fig. 5), which warrants further investigation.
In conclusion, we have presented and demonstrated a novel methodology that facilitates isotropically restricted fraction imaging at unprecedented spatial resolution, clinically relevant acquisition times and clinical MRI hardware.
Acknowledgements
We thank Siemens Healthcare (Erlangen, Germany) for access to the pulse sequence programming environment.References
[1] G. Xia, K. N. McFarland, K. Wang, P. S. Sarkar, A. T. Yachnis, and T. Ashizawa, “Purkinje cell loss is the major brain pathology of spinocerebellar ataxia type 10.,” Journal of neurology, neurosurgery, and psychiatry, vol. 84, no. 12. pp. 1409–1411, Dec. 2013, doi: 10.1136/jnnp-2013-305080.
[2] Y. Fukutani, N. J. Cairns, M. N. Rossor, and P. L. Lantos, “Purkinje cell loss and astrocytosis in the cerebellum in familial and sporadic Alzheimer’s disease.,” Neurosci. Lett., vol. 214, no. 1, pp. 33–36, Aug. 1996, doi: 10.1016/0304-3940(96)12875-5.
[3] H. Gudbjartsson and S. Patz, “The Rician distribution of noisy MRI data.,” Magn. Reson. Med., vol. 34, no. 6, pp. 910–914, Dec. 1995, doi: 10.1002/mrm.1910340618.
[4] D. C. Alexander, “Axon radius measurements in vivo from diffusion MRI: A feasibility study,” Proc. IEEE Int. Conf. Comput. Vis., 2007, doi: 10.1109/ICCV.2007.4409141.
[5] G. J. Stanisz, G. A. Wright, R. M. Henkelman, and A. Szafer, “An analytical model of restricted diffusion in bovine optic nerve,” Magn. Reson. Med., vol. 37, no. 1, pp. 103–111, 1997, doi: 10.1002/mrm.1910370115.
[6] B. Dhital, E. Kellner, V. G. Kiselev, and M. Reisert, “The absence of restricted water pool in brain white matter.,” Neuroimage, vol. 182, pp. 398–406, Nov. 2018, doi: 10.1016/j.neuroimage.2017.10.051.
[7] C. M. W. Tax, F. Szczepankiewicz, M. Nilsson, and D. K. Jones, “The dot-compartment revealed? Diffusion MRI with ultra-strong gradients and spherical tensor encoding in the living human brain,” Neuroimage, vol. 210, p. 116534, 2020, doi: https://doi.org/10.1016/j.neuroimage.2020.116534.
[8] F. Szczepankiewicz, J. Sjölund, F. Ståhlberg, J. Lätt, and M. Nilsson, “Tensor-valued diffusion encoding for diffusional variance decomposition (DIVIDE): Technical feasibility in clinical MRI systems,” PLoS One, vol. 14, no. 3, p. e0214238, Mar. 2019, [Online]. Available: https://doi.org/10.1371/journal.pone.0214238.
[9] F. Szczepankiewicz, C.-F. Westin, and M. Nilsson, “Maxwell-compensated design of asymmetric gradient waveforms for tensor-valued diffusion encoding,” Magn. Reson. Med., vol. 82, no. 4, pp. 1424–1437, Oct. 2019, doi: https://doi.org/10.1002/mrm.27828.
[10] J. Sjölund, F. Szczepankiewicz, M. Nilsson, D. Topgaard, C. F. Westin, and H. Knutsson, “Constrained optimization of gradient waveforms for generalized diffusion encoding,” J. Magn. Reson., vol. 261, pp. 157–168, 2015, doi: 10.1016/j.jmr.2015.10.012.
[11] L. Cordero-Grande, D. Christiaens, J. Hutter, A. N. Price, and J. V Hajnal, “Complex diffusion-weighted image estimation via matrix recovery under general noise models,” Neuroimage, vol. 200, pp. 391–404, 2019, doi: https://doi.org/10.1016/j.neuroimage.2019.06.039.
[12] J.-D. Tournier et al., “MRtrix3: A fast, flexible and open software framework for medical image processing and visualisation.,” Neuroimage, vol. 202, p. 116137, Nov. 2019, doi: 10.1016/j.neuroimage.2019.116137.
[13] M. Elad and A. Feuer, “Restoration of a single superresolution image from several blurred, noisy, and undersampled measured images,” IEEE Trans. Image Process., vol. 6, no. 12, pp. 1646–1658, 1997, doi: 10.1109/83.650118.
[14] A. N. Tikhonov and V. Y. Arsenin, Solutions of ill-posed problems. 1977.
[15] K. Amunts et al., “BigBrain: An
ultrahigh-resolution 3D human brain model,” Science (80-. )., vol. 340,
no. 6139, pp. 1472–1475, 2013, doi: 10.1126/science.1235381.
Figures