0105
Nonparametric 6D D-R1-R2 distribution imaging of the human brain: Initial results on healthy volunteers1Lund University, Lund, Sweden, 2Random Walk Imaging AB, Lund, Sweden, 3Institute of Radiology, University Hospital Erlangen, Friedrich-Alexander-Universität Erlangen-Nürnberg (FAU), Erlangen, Germany
Synopsis
Diffusion-relaxation correlation NMR methods have recently received attention from the medical MRI community for their ability to characterize microstructure and local chemical composition in complex tissues containing multiple subvoxel pools of water. We here implement 6D $$$\bf{D}$$$-$$$R_1$$$-$$$R_2$$$ distribution imaging of the human brain using a 20-min acquisition protocol combining EPI signal read-out and tensor-valued diffusion encoding with varying repetition- and echo times. Monte Carlo data inversion yields nonparametric distributions, statistical descriptors, and orientation-resolved diffusion and relaxation properties of white matter fiber bundles that are in good agreement with previous results from less exhaustive 4D and 5D protocols.
Introduction
Diffusion-relaxation correlation NMR1-5 resolves information on the translational motion of water molecules and the local chemical composition of the aqueous phase. Recently, these methods were combined with spatially resolved measurements6-8 and applied in vivo using data analysis with model-based9-12 and nonparametric approaches13,14. However, early nonparametric studies were limited to scalar diffusivity measures, which are not satisfactory for orientationally disordered anisotropic materials.We have incorporated the concepts of diffusion tensor distributions15-17, tensor-valued encoding18-20, and Monte Carlo inversion21,22 into the framework of diffusion-relaxation correlation NMR. Mapping statistical descriptors of these distributions onto orientation distribution functions (ODFs) allows resolving fiber-specific subvoxel components. Building on experiences from previous 5D $$$\bf{D}$$$-$$$R_1$$$ and $$$\bf{D}$$$-$$$R_2$$$ in vivo studies23,24, we here adapt our 6D $$$\bf{D}$$$-$$$R_1$$$-$$$R_2$$$ NMR spectroscopy method25 to a 20-min in vivo acquisition protocol and perform proof-of-principle brain imaging on healthy volunteers.
Methods
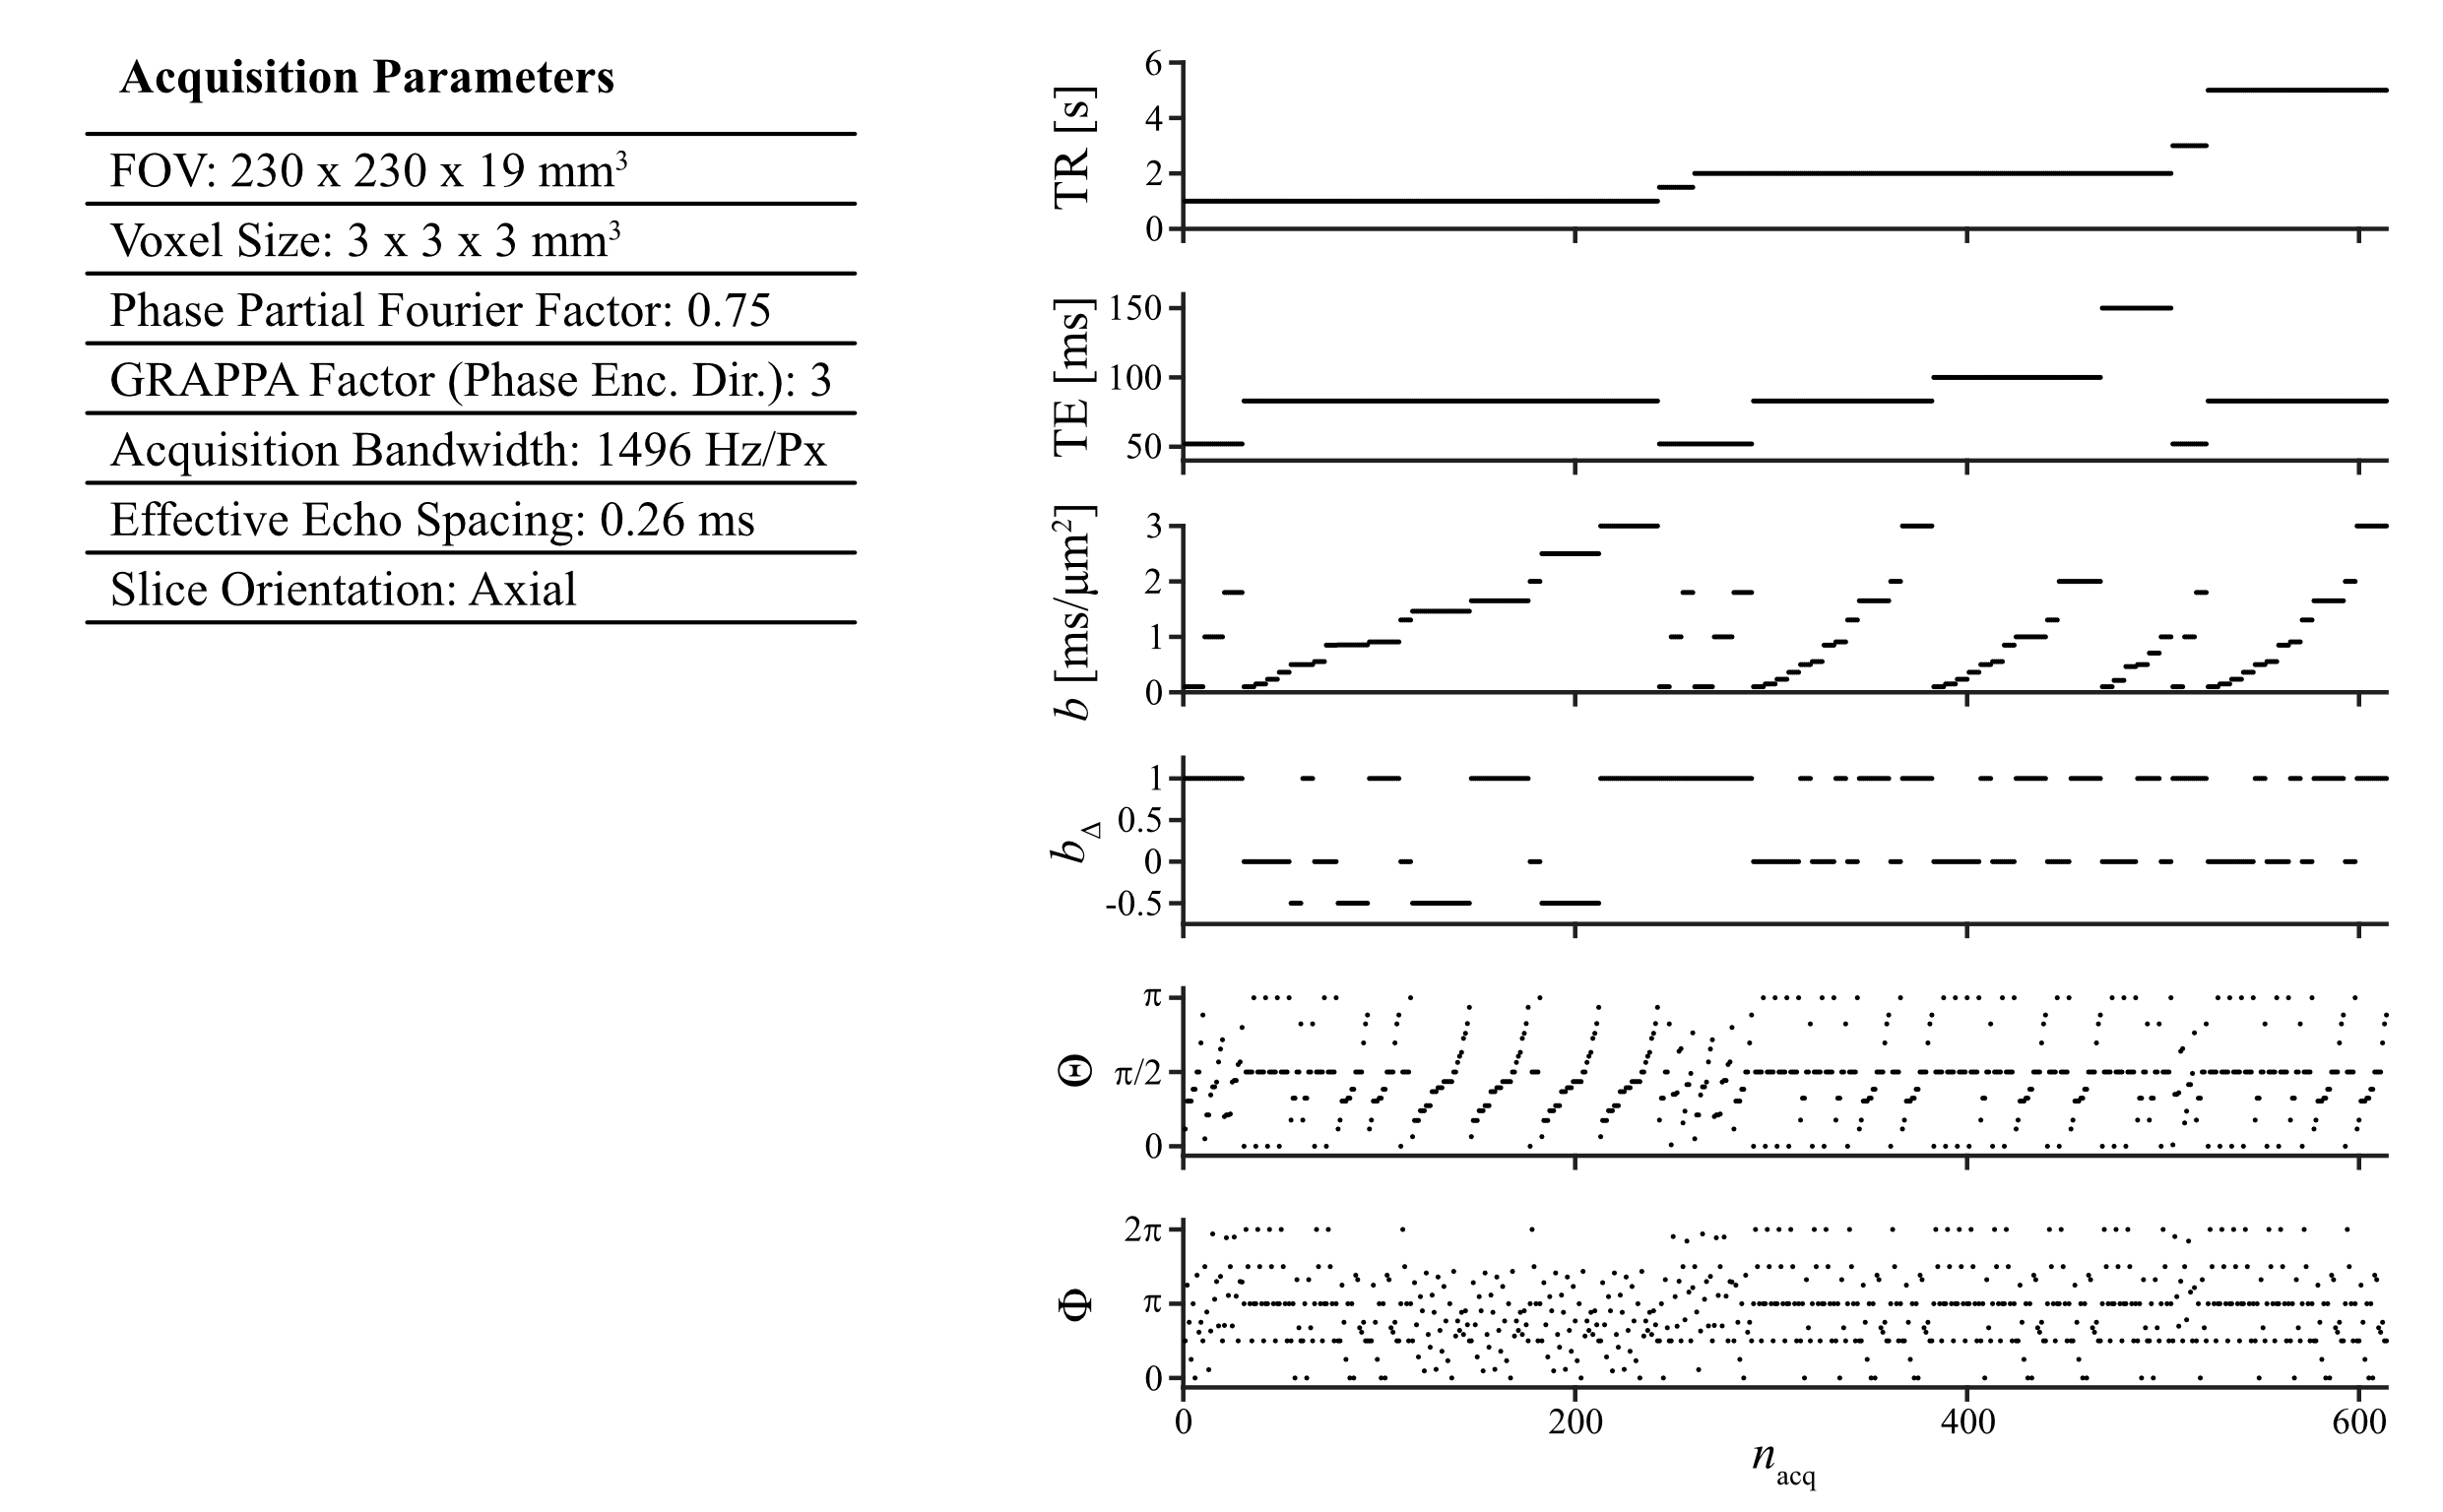
The study was approved by the local institutional review board. Three healthy volunteers were measured on a 3T system (MAGNETOM Prisma, Siemens Healthcare AG, Erlangen, Germany) with a 20-channel head coil. Data were acquired using an in-house developed single-shot spin-echo EPI sequence modified for tensor-valued diffusion encoding26. Numerically optimized27 linear, planar, and spherical b-tensors were employed with b-values ranging between 0.1 and 3 ms/mm2. Sensitivity to $$$R_1$$$ and $$$R_2$$$ was achieved by acquiring data with different combinations of repetition- and echo times. Total protocol duration was 20 min. Figure 1 provides a detailed overview of acquisition parameters.The data were subsequently processed in Matlab R2019b (MathWorks, Natick, MA) using the 6D Monte Carlo inversion algorithm25 as implemented in the multidimensional diffusion MRI toolbox28 available at https://github.com/daniel-topgaard/md-dmri (last accessed November 23rd, 2020). The components of the inversion, i.e. axial diffusivity $$$D_{||}$$$, radial diffusivity $$$D_{\bot}$$$, azimuthal angle $$$\Theta$$$, polar angle $$$\Phi$$$, longitudinal relaxation rate $$$R_1$$$, and transversal relaxation rate $$$R_2$$$, were sampled in the following ranges: $$$D_{||},D_\bot\in\left[0.05,5\right]$$$ μm2/ms, $$$\Theta\in [0,π)$$$, $$$\Phi\in [0,2π)$$$, $$$R_1\in [0.2,1]$$$ s-1, $$$R_2\in [1,30]$$$ s-1. Following the nomenclature in 25 we employed $$$N_{in}=200$$$ input components, $$$N_{p}=20$$$ proliferation steps, $$$N_{m}=20$$$ mutation steps, and $$$N_{out}=10$$$ output components. For each voxel, $$$N_{bs}=100$$$ plausible solutions were obtained by way of bootstrapping with replacement.
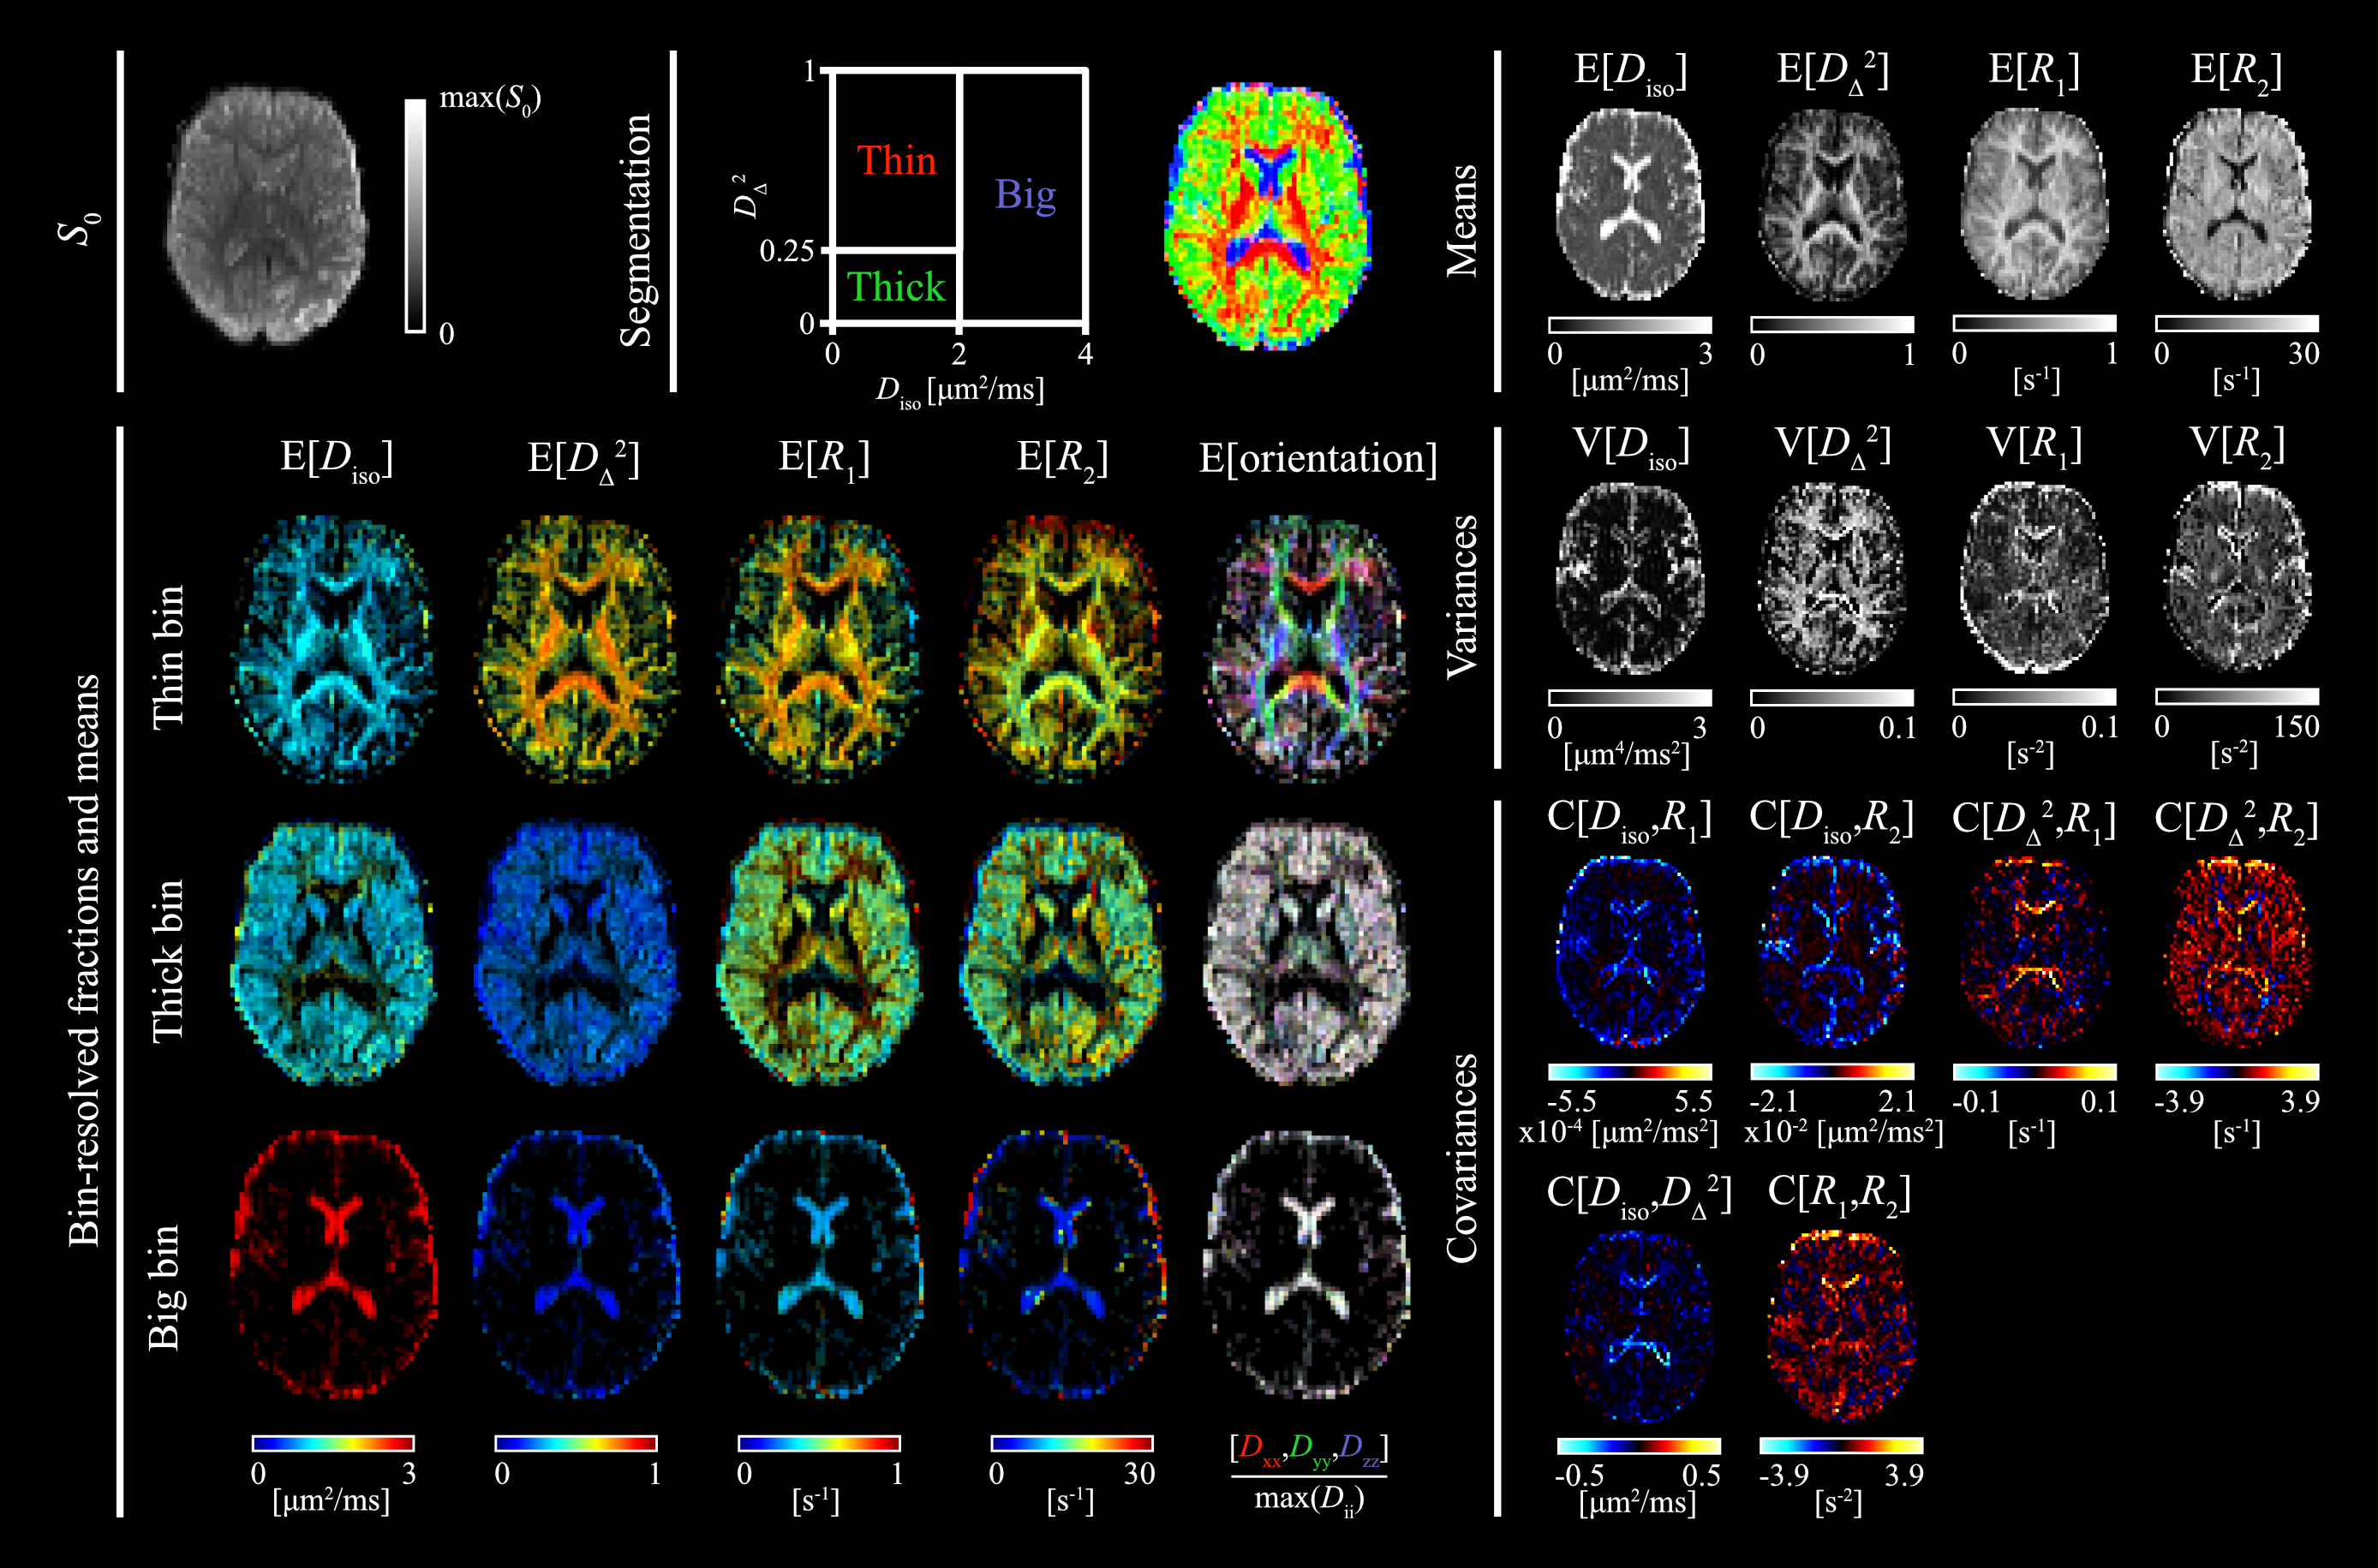
We quantified our results in terms of the median across all bootstraps. For the sake of simplicity, the median operator is omitted and the mean, variance, and covariance of two given components $$$x,y$$$ are denoted as $$$\mathrm{E}[x]$$$, $$$\mathrm{V}[x]$$$, and $$$\mathrm{C}[x, y]$$$, respectively. The 6D parameter space was separated into three bins to obtain tissue-specific statistical descriptors23. The bin dimensions are shown in Figure 3 and were chosen to effectively isolate white matter (WM, "thin"), gray matter (GM, "thick"), and cerebrospinal fluid (CSF, "big"). Besides $$$D_{||}$$$ and $$$D_\bot$$$, we also characterize $$$\bf{D}$$$ in terms of its isotropic diffusivity $$$D_{iso}=(D_{||}+2D_\bot)/3$$$ and normalized anisotropy $$$D_\Delta=(D_{||}-D_\bot)/D_{iso}$$$29.
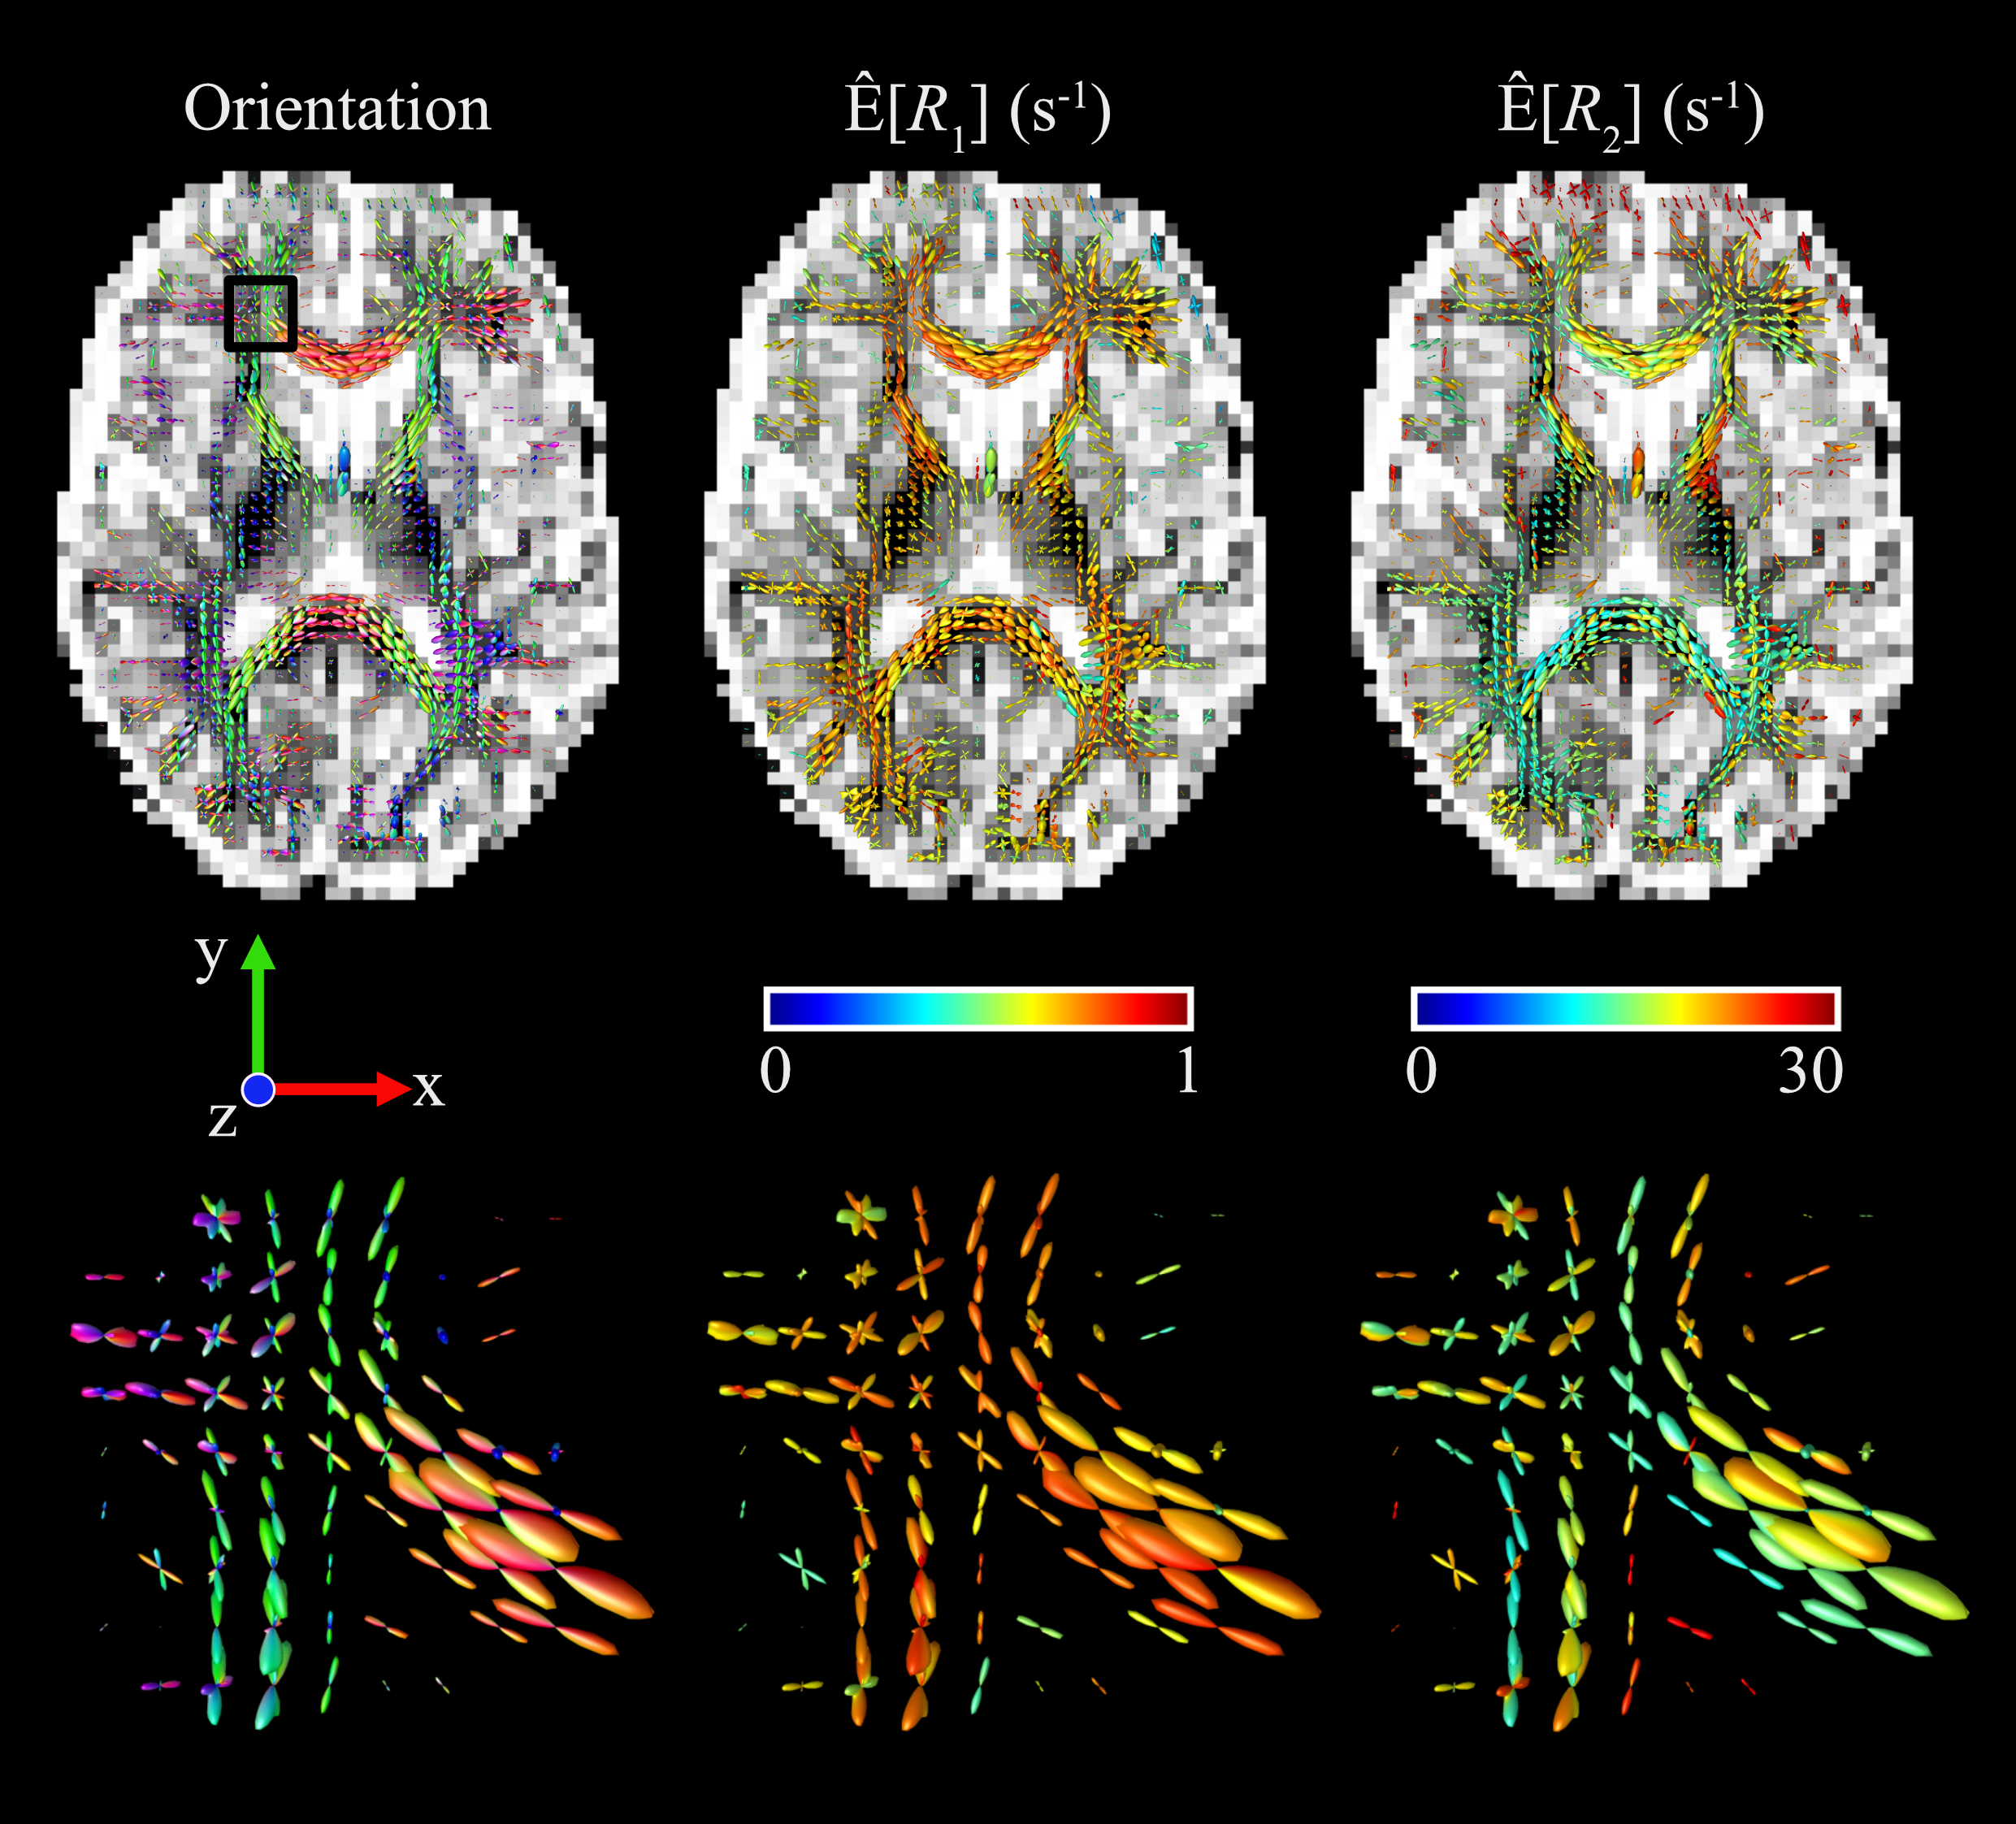
ODFs were computed for the thin-bin fraction of the bootstrap solutions by mapping the orientation specific mean $$$Ê[x]$$$ onto a dense spherical mesh grid30. The ODF radii represent the thin-bin components' weight and orientation.
Results
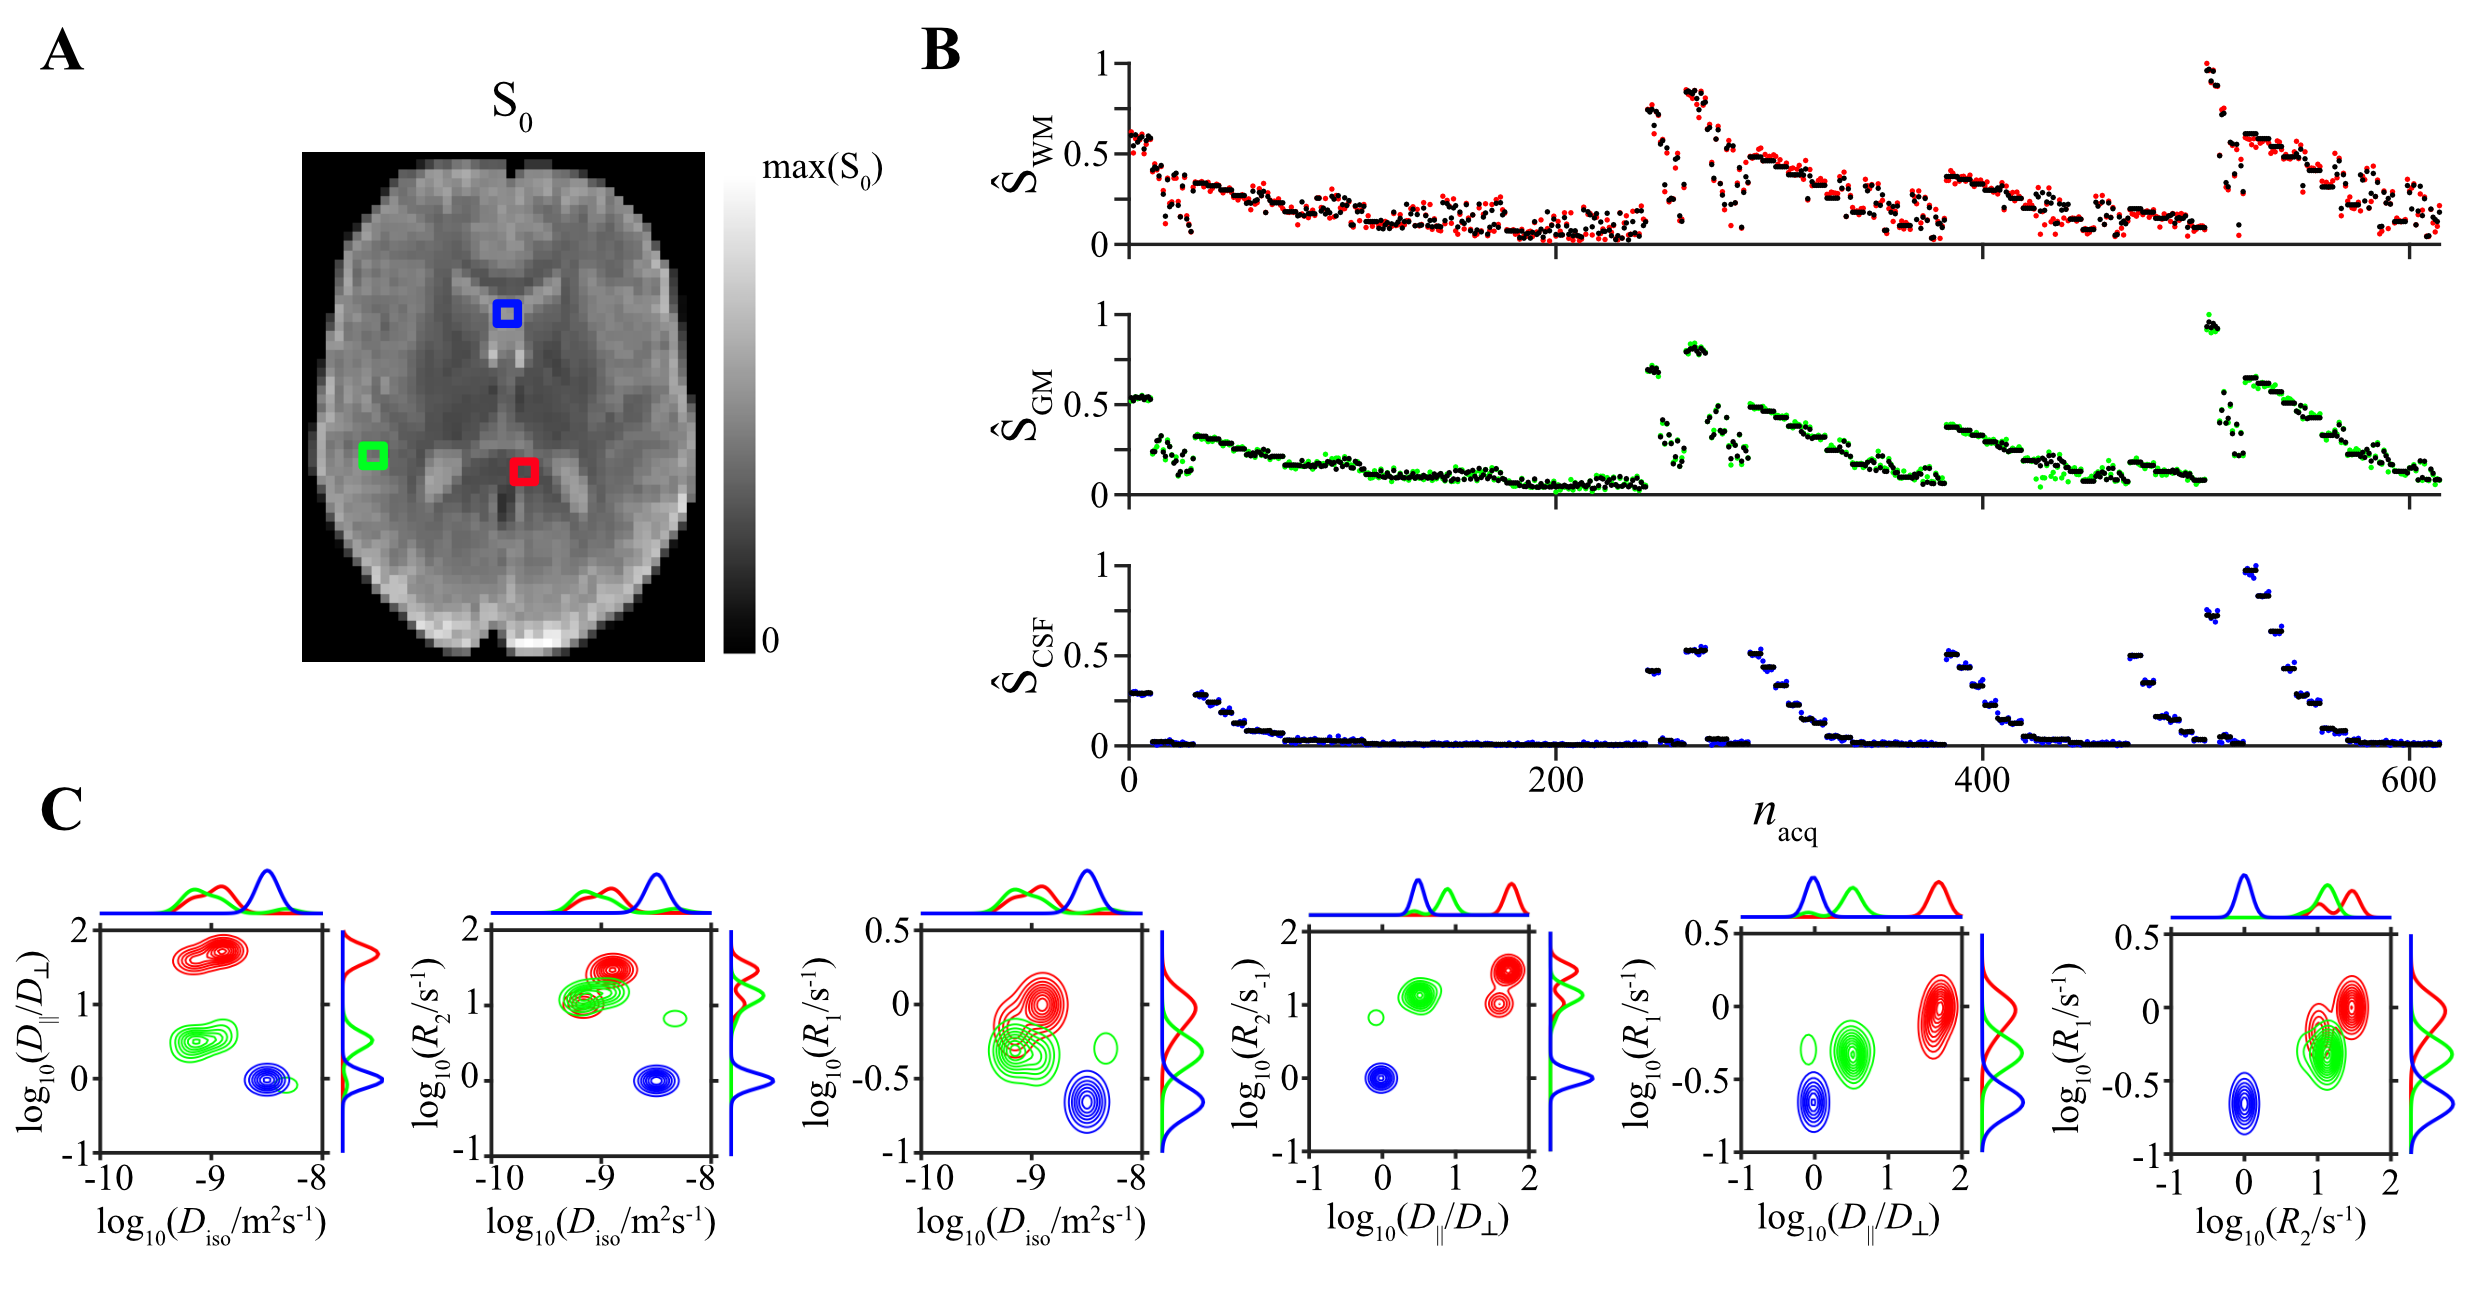
Figure 2 shows experimental and fitted signals and corresponding distributions $$$\mathcal{P}(\bf{D}\it,R_1,R_2)$$$ in three representative voxels associated with WM in the corpus callosum, cortical GM, and CSF in the frontal ventricles. The parameter distributions reflect familiar aspects of the respective tissue type: $$$D_{||}/D_\bot$$$ is high in WM but low in GM and CSF. WM and GM have similar $$$D_{iso}$$$, while $$$D_{iso}$$$ in CSF is notably higher. $$$R_1$$$ and $$$R_2$$$ are lowest in CSF, followed by GM, and highest in WM.Figure 3 displays axial maps of global and bin-specific statistical descriptors of $$$\mathcal{P}(\bf{D}\it,R_1,R_2)$$$. Maps of the mean values are consistent with the distributions shown in Figure 2. The contrasts are in good agreement with previously published data that were analyzed with 4D and 5D Monte Carlo inversion algorithms23,24,31.
Figure 4 presents thin-bin ODFs with color-coding based on orientation, $$$Ê[R_1]$$$, and $$$Ê[R_2]$$$ for a representative axial slice. Local orientations captured in the ODFs are consistent with known anatomy. In both $$$Ê[R_1]$$$ and $$$Ê[R_2]$$$ gradual changes are noticeable at interfaces between WM and either CSF or GM, as well as between the genu and splenium of the corpus callosum.
Discussion
In this work we demonstrated that 6D $$$\bf{D}$$$-$$$R_1$$$-$$$R_2$$$ MRI is feasible on a clinical system using a single 20-min acquisition protocol that is comparable to previous 5D $$$\bf{D}$$$-$$$R_1$$$ (20 min) and $$$\bf{D}$$$-$$$R_2$$$ (15 or 45 min) measurements23,24. However, advanced contrasts such as variances and covariances require careful optimization of the acquisition protocol. We consciously neglected the possibly confounding impact of eddy current32 and diffusion time dependence33,34 in favor of a broader sampling space to stabilize the nonparametric Monte Carlo inversion. Limited by the design of the sequence we were only able to acquire five slices. More efficient acquisition schemes are possible with advanced sequence designs such as slice shuffling35,36. Further improvements include pre-processing steps such as denoising37,38 and correcting for Rician bias39,40. Nonetheless, our results show that 6D $$$\bf{D}$$$-$$$R_1$$$-$$$R_2$$$ MRI provides abundant information on subvoxel tissue microstructure that may benefit clinical MRI in the future.Acknowledgements
This work was financially supported by the Swedish Foundation for Strategic Research (ITM17-0267) and the Swedish Research Council (2018-03697). D. Topgaard owns shares in Random Walk Imaging AB (Lund, Sweden, http://www.rwi.se/), holding patents related to the described methods.
Funding for the position of F. B. Laun by the DFG is gratefully acknowledged (LA 2804/12-1). We thank the Imaging Science Institute (Erlangen, Germany) for providing us with measurement time.
References
1 Galvosas, P. and P.T. Callaghan, Multi-dimensional inverse Laplace spectroscopy in the NMR of porous media. Comptes Rendus Physique, 2010. 11(2): p. 172-180
2 Bernin, D. and D. Topgaard, NMR diffusion and relaxation correlation methods: New insights in heterogeneous materials. Current Opinion in Colloid & Interface Science, 2013. 18(3): p. 166-172
3 Song, Y.-Q., et al., Chapter 4: Two-dimensional NMR of Diffusion and Relaxation, in Diffusion NMR of Confined Systems: Fluid Transport in Porous Solids and Heterogeneous Materials. 2017, The Royal Society of Chemistry. p. 111-155
4 Tax, C.M., Estimating Chemical and Microstructural Heterogeneity by Correlating Relaxation and Diffusion. Advanced Diffusion Encoding Methods in MRI, 2020. 24: p. 186
5 Benjamini, D. and P.J. Basser, Multidimensional correlation MRI. NMR in Biomedicine, 2020. 33(12): p. e4226
6 Zhang, Y. and B. Blümich, Spatially resolved D–T2 correlation NMR of porous media. Journal of Magnetic Resonance, 2014. 242: p. 41-48
7 Kim, D., et al., Diffusion-relaxation correlation spectroscopic imaging: A multidimensional approach for probing microstructure. Magnetic Resonance in Medicine, 2017. 78(6): p. 2236-2249
8 Benjamini, D. and P.J. Basser, Magnetic resonance microdynamic imaging reveals distinct tissue microenvironments. NeuroImage, 2017. 163: p. 183-196
9 De Santis, S., et al., T1 relaxometry of crossing fibres in the human brain. NeuroImage, 2016. 141: p. 133-142
10 De Santis, S., et al., Resolving relaxometry and diffusion properties within the same voxel in the presence of crossing fibres by combining inversion recovery and diffusion-weighted acquisitions. Magnetic Resonance in Medicine, 2016. 75(1): p. 372-380
11 Veraart, J., D.S. Novikov, and E. Fieremans, TE dependent Diffusion Imaging (TEdDI) distinguishes between compartmental T2 relaxation times. NeuroImage, 2018. 182: p. 360-369
12 Veraart, J., et al., Model-based Analysis of Advanced Diffusion Data. Advanced Diffusion Encoding Methods in MRI, 2020. 24: p. 317
13 Slator, P.J., et al., Combined diffusion-relaxometry MRI to identify dysfunction in the human placenta. Magnetic Resonance in Medicine, 2019. 82(1): p. 95-106
14 Benjamini, D., Nonparametric Inversion of Relaxation and Diffusion Correlation Data. Advanced Diffusion Encoding Methods in MRI, 2020. 24: p. 278.
15 Basser, P.J. and S. Pajevic, A normal distribution for tensor-valued random variables: applications to diffusion tensor MRI. IEEE Transactions on Medical Imaging, 2003. 22(7): p. 785-794
16 Jian, B., et al., A novel tensor distribution model for the diffusion-weighted MR signal. NeuroImage, 2007. 37(1): p. 164-176
17 Topgaard, D., Diffusion tensor distribution imaging. NMR in Biomedicine, 2019. 32(5): p. e4066
18 Westin, C.-F., et al. Measurement Tensors in Diffusion MRI: Generalizing the Concept of Diffusion Encoding. 2014. Cham: Springer International Publishing
19 Topgaard, D., Multidimensional diffusion MRI. Journal of Magnetic Resonance, 2017. 275: p. 98-113
20 Reymbaut, A., Diffusion Anisotropy and Tensor-valued Encoding. Advanced Diffusion Encoding Methods in MRI, 2020. 4: p. 68
21 Prange, M. and Y.-Q. Song, Quantifying uncertainty in NMR T2 spectra using Monte Carlo inversion. Journal of Magnetic Resonance, 2009. 196(1): p. 54-60
22 de Kort, D.W., et al., NMR Nanoparticle Diffusometry in Hydrogels: Enhancing Sensitivity and Selectivity. Analytical Chemistry, 2014. 86(18): p. 9229-9235
23 de Almeida Martins, J.P., et al., Transferring principles of solid-state and Laplace NMR to the field of in vivo brain MRI. Magn. Reson., 2020. 1(1): p. 27-43
24 Reymbaut, A., et al., Towards non-parametric diffusion-T1 characterization of crossing fibers in the human brain. arXiv:2006.07881, 2020
25 de Almeida Martins, J.P. and D. Topgaard, Multidimensional correlation of nuclear relaxation rates and diffusion tensors for model-free investigations of heterogeneous anisotropic porous materials. Scientific Reports, 2018. 8(1): p. 2488
26 Martin, J., et al., Contrast-to-noise ratio analysis of microscopic diffusion anisotropy indices in q-space trajectory imaging. Zeitschrift für Medizinische Physik, 2020. 30(1): p. 4-16
27 Sjölund, J., et al., Constrained optimization of gradient waveforms for generalized diffusion encoding. Journal of Magnetic Resonance, 2015. 261: p. 157-168
28 Nilsson, M., et al. An open-source framework for analysis of multidimensional diffusion MRI data implemented in MATLAB. in Proc Intl Soc Mag Reson Med. 2018
29 Conturo, T.E., et al., Encoding of anisotropic diffusion with tetrahedral gradients: A general mathematical diffusion formalism and experimental results. Magnetic Resonance in Medicine, 1996. 35(3): p. 399-412
30 de Almeida Martins, J.P., et al., Computing and visualising intra-voxel orientation-specific relaxation–diffusion features in the human brain. Human Brain Mapping
31 Yon, M., et al., Diffusion tensor distribution imaging of an in vivo mouse brain at ultrahigh magnetic field by spatiotemporal encoding. NMR in Biomedicine, 2020. 33(11): p. e4355
32 Yang, G. and J.A. McNab, Eddy current nulled constrained optimization of isotropic diffusion encoding gradient waveforms. Magnetic Resonance in Medicine, 2019. 81(3): p. 1818-1832
33 Baron, C.A. and C. Beaulieu, Oscillating gradient spin-echo (OGSE) diffusion tensor imaging of the human brain. Magnetic Resonance in Medicine, 2014. 72(3): p. 726-736
34 Arbabi, A., et al., Diffusion dispersion imaging: Mapping oscillating gradient spin-echo frequency dependence in the human brain. Magnetic Resonance in Medicine, 2020. 83(6): p. 2197-2208
35 Hutter, J., et al., Integrated and efficient diffusion-relaxometry using ZEBRA. Scientific Reports, 2018. 8(1): p. 15138
36 Hutter, J., J.D. Tournier, and J. Hajnal, Chapter 9: Pulse Sequences Combining Advanced Diffusion Encoding and Image Read-out, in Advanced Diffusion Encoding Methods in MRI. 2020, The Royal Society of Chemistry. p. 249-277
37 Veraart, J., et al., Denoising of diffusion MRI using random matrix theory. NeuroImage, 2016. 142: p. 394-406
38 Cordero-Grande, L., et al., Complex diffusion-weighted image estimation via matrix recovery under general noise models. NeuroImage, 2019. 200: p. 391-404
39 Gudbjartsson, H. and S. Patz, The rician distribution of noisy mri data. Magnetic Resonance in Medicine, 1995. 34(6): p. 910-914
40 Koay, C.G. and P.J. Basser, Analytically exact correction scheme for signal extraction from noisy magnitude MR signals. Journal of Magnetic Resonance, 2006. 179(2): p. 317-322
41
Eriksson, S., et al., NMR diffusion-encoding with axial symmetry
and variable anisotropy: Distinguishing between prolate and oblate microscopic
diffusion tensors with unknown orientation distribution. The Journal of
Chemical Physics, 2015. 142(10): p.
104201
Figures