0104
High-Fidelity Diffusion Tensor Imaging of the Thoracic Spinal Cord Using Point-Spread-Function Encoded EPI (PSF-EPI)1Center for Biomedical Imaging Research, Beijing, China, 2Philips Healthcare, Beijing, China, 3GE Healthcare, MR Research China, Beijing, China, 4China National Clinical Research Center for Neurological Diseases, Beijing Tiantan Hospital, Capital Medical University, Beijing, China
Synopsis
Diffusion tensor imaging (DTI) holds great potential to aid the diagnosis of spinal cord pathologies. Single shot EPI (SS-EPI) is mostly implemented for DTI but is significantly limited in clinics by susceptibility inhomogeneity-induced distortions. This is especially problematic in the thoracic region for increased inhomogeneities near lungs. To solve this problem, multi-shot EPI and reduced-FOV methods have been proposed. However, these methods cannot remove distortions completely. In this study, we achieved high-fidelity DTI of the thoracic spinal cord using a distortion-free MS-EPI technique, Point-Spread-Function Encoded EPI (PSF-EPI). Both the efficacy of PSF-EPI in distortion correction and quantitative reproducibility were evaluated.
Introduction
Diffusion tensor imaging (DTI) of the spinal cord holds great potential in the detection and evaluation of diverse spinal cord pathologies1-4. However, this can be technically challenging due to the small size of the cord, physiological motions and field inhomogeneity surrounding the spine. In particular, this is further confounded in the thoracic region by the more complicated susceptibility inhomogeneities due to air-bone interfaces near the pulmonary parenchyma1 as well as increased motions including cardiac, respiratory and CSF flow5. These factors necessitate a robust high-fidelity technique with high resolution and practical acquisition efficiency for thoracic DTI.The traditional scheme for DTI is single shot EPI (SS-EPI) which is prone to susceptibility-induced distortions. This is especially problematic for cases with spinal canal narrowing, such as disk herniation, spondylolisthesis and trauma1. To remedy this problem, advanced EPI-based methods, including multi-shot EPI (MS-EPI) methods such as readout-segmented EPI (RS-EPI)6, interleaved EPI (iEPI)7 and reduced FOV (rFOV) methods such as zonal oblique multislice EPI (ZOOM-EPI)8 have been proposed. However, these methods still cannot remove distortions completely and might sacrifice the scan time or spatial coverage. To further reduce the distortions, ZOOM-EPI and RS-EPI were combined and implemented for thoracic DTI by using 7 blinds with 1/3 FOV 9.
This study aimed to achieve high-fidelity, fast DTI of the thoracic spinal cord using a distortion-free multi-shot EPI technique, Point-Spread-Function-Encoded EPI (PSF-EPI)10-12. By using 8 shots, the acquisition time can be reduced to 6 minutes with 6 diffusion directions and 2 number of signal averages.
Methods
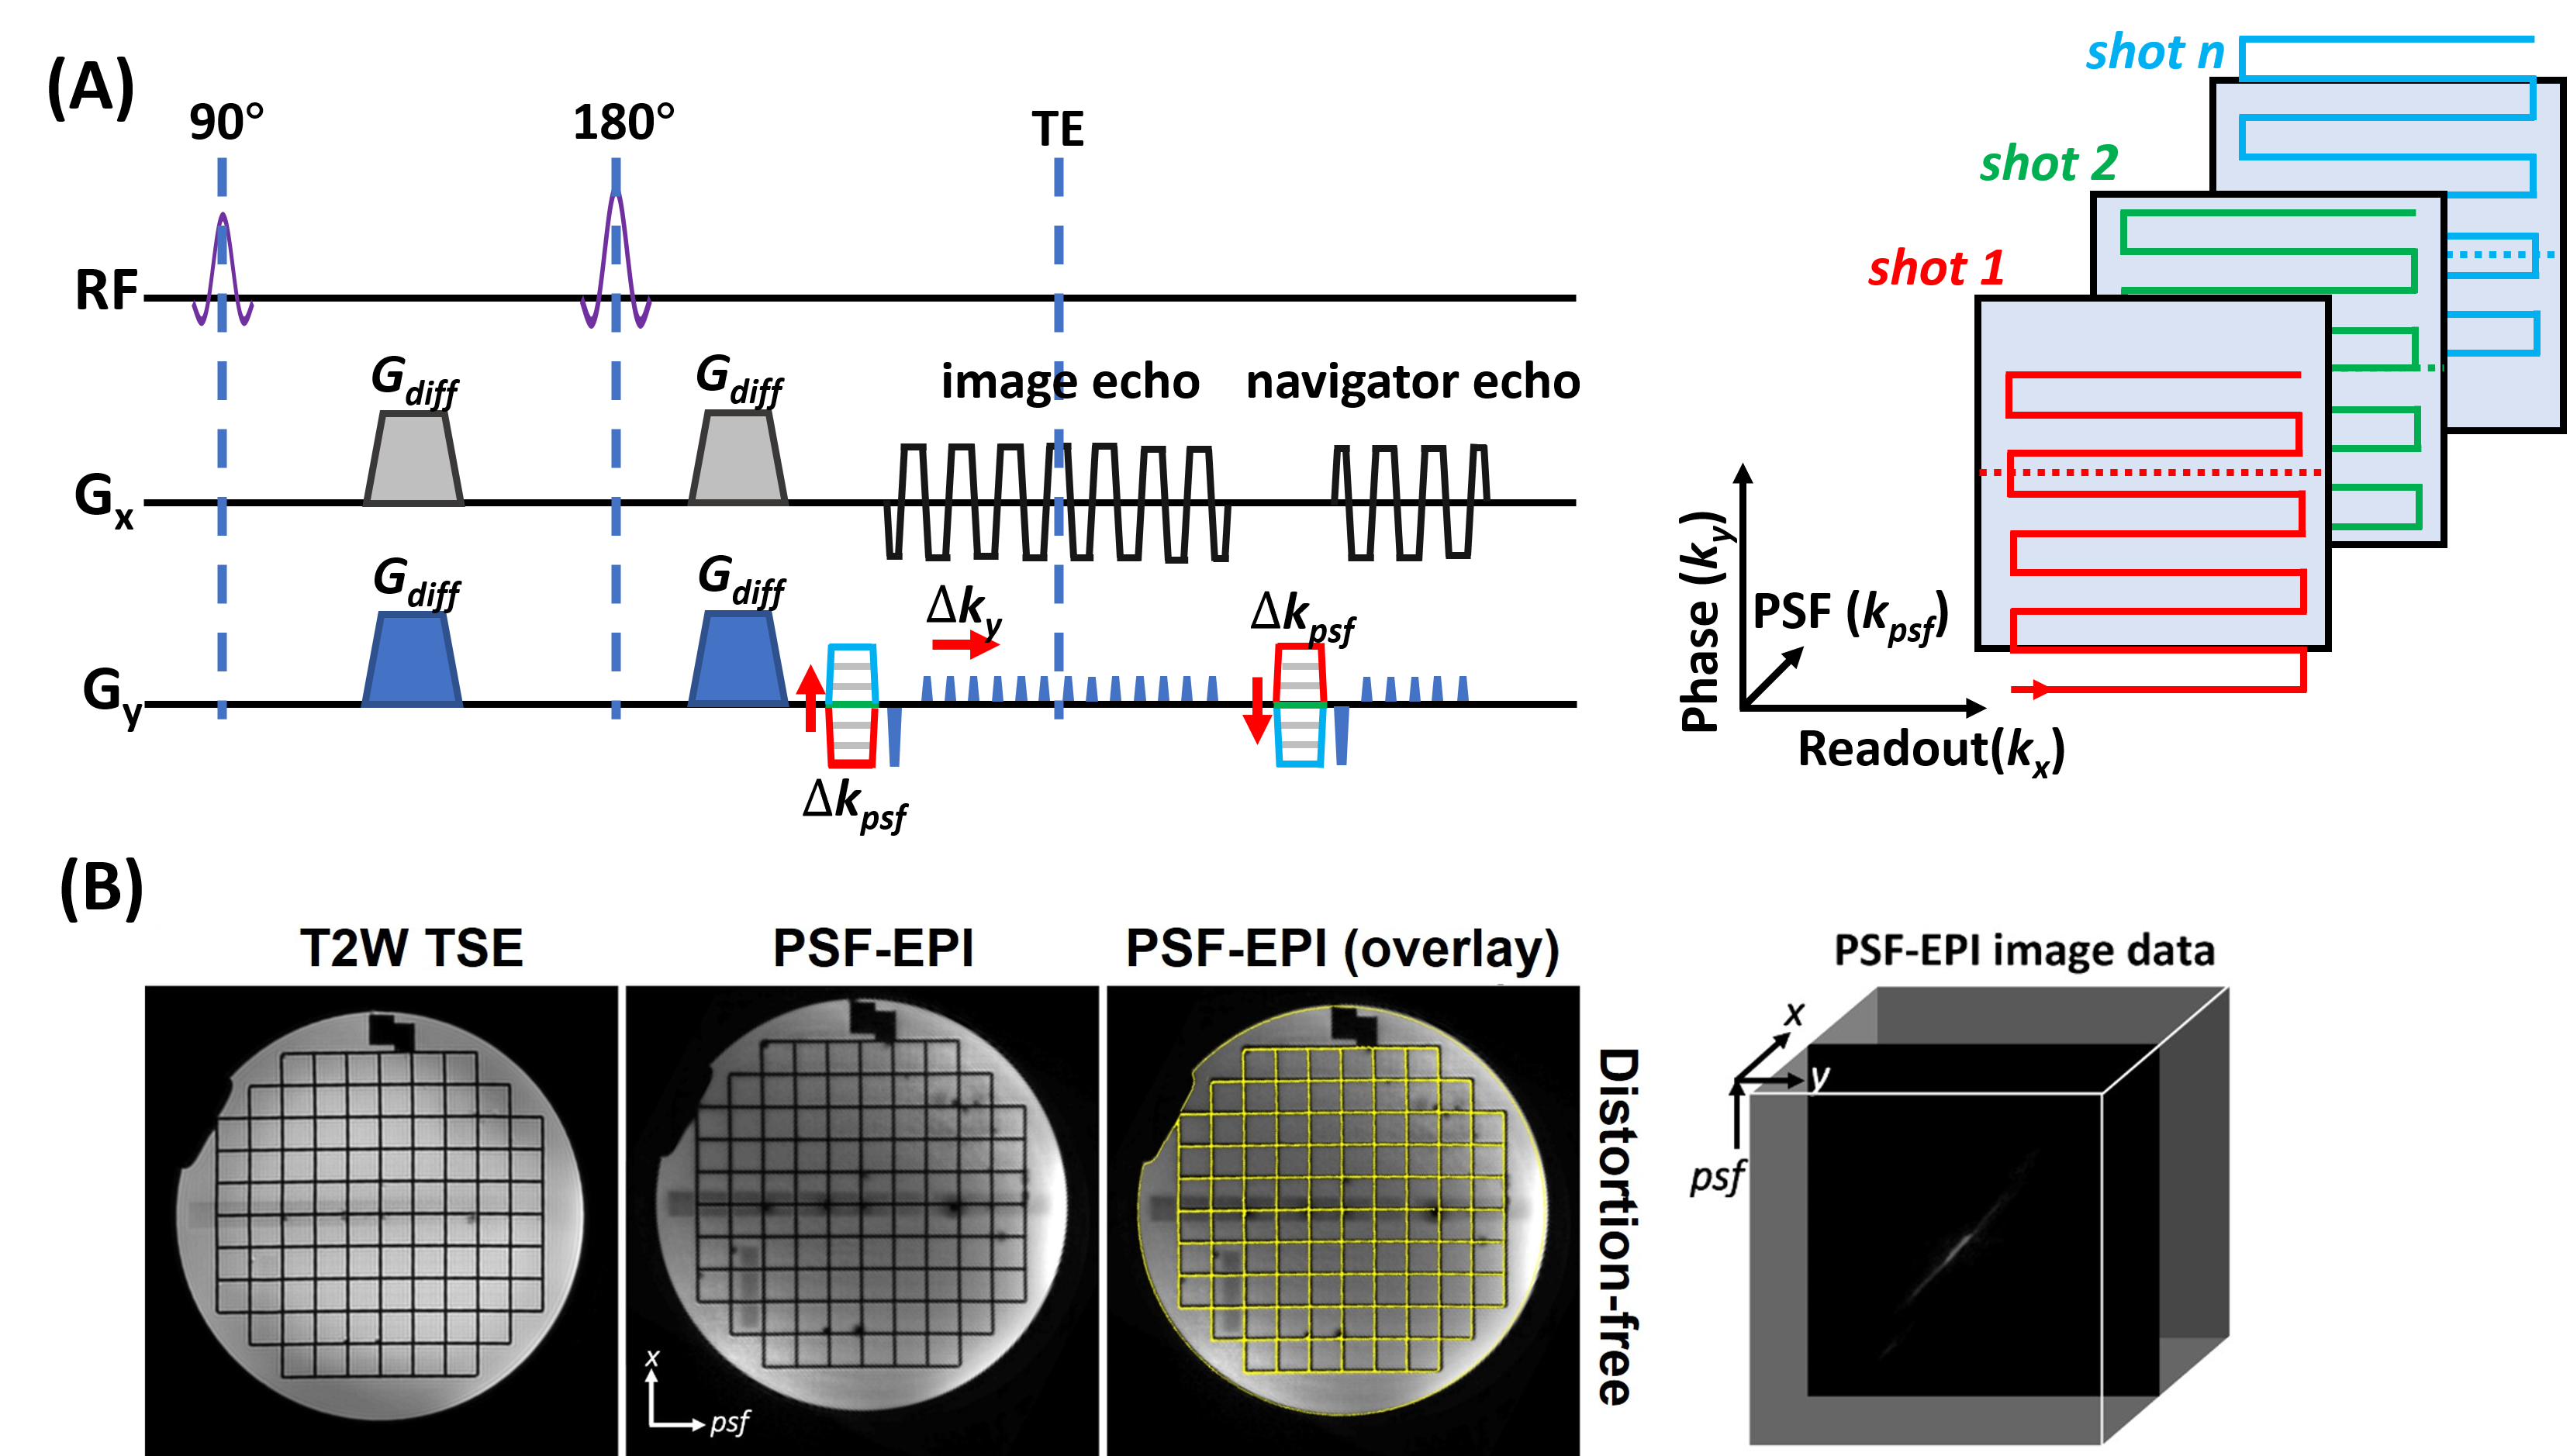
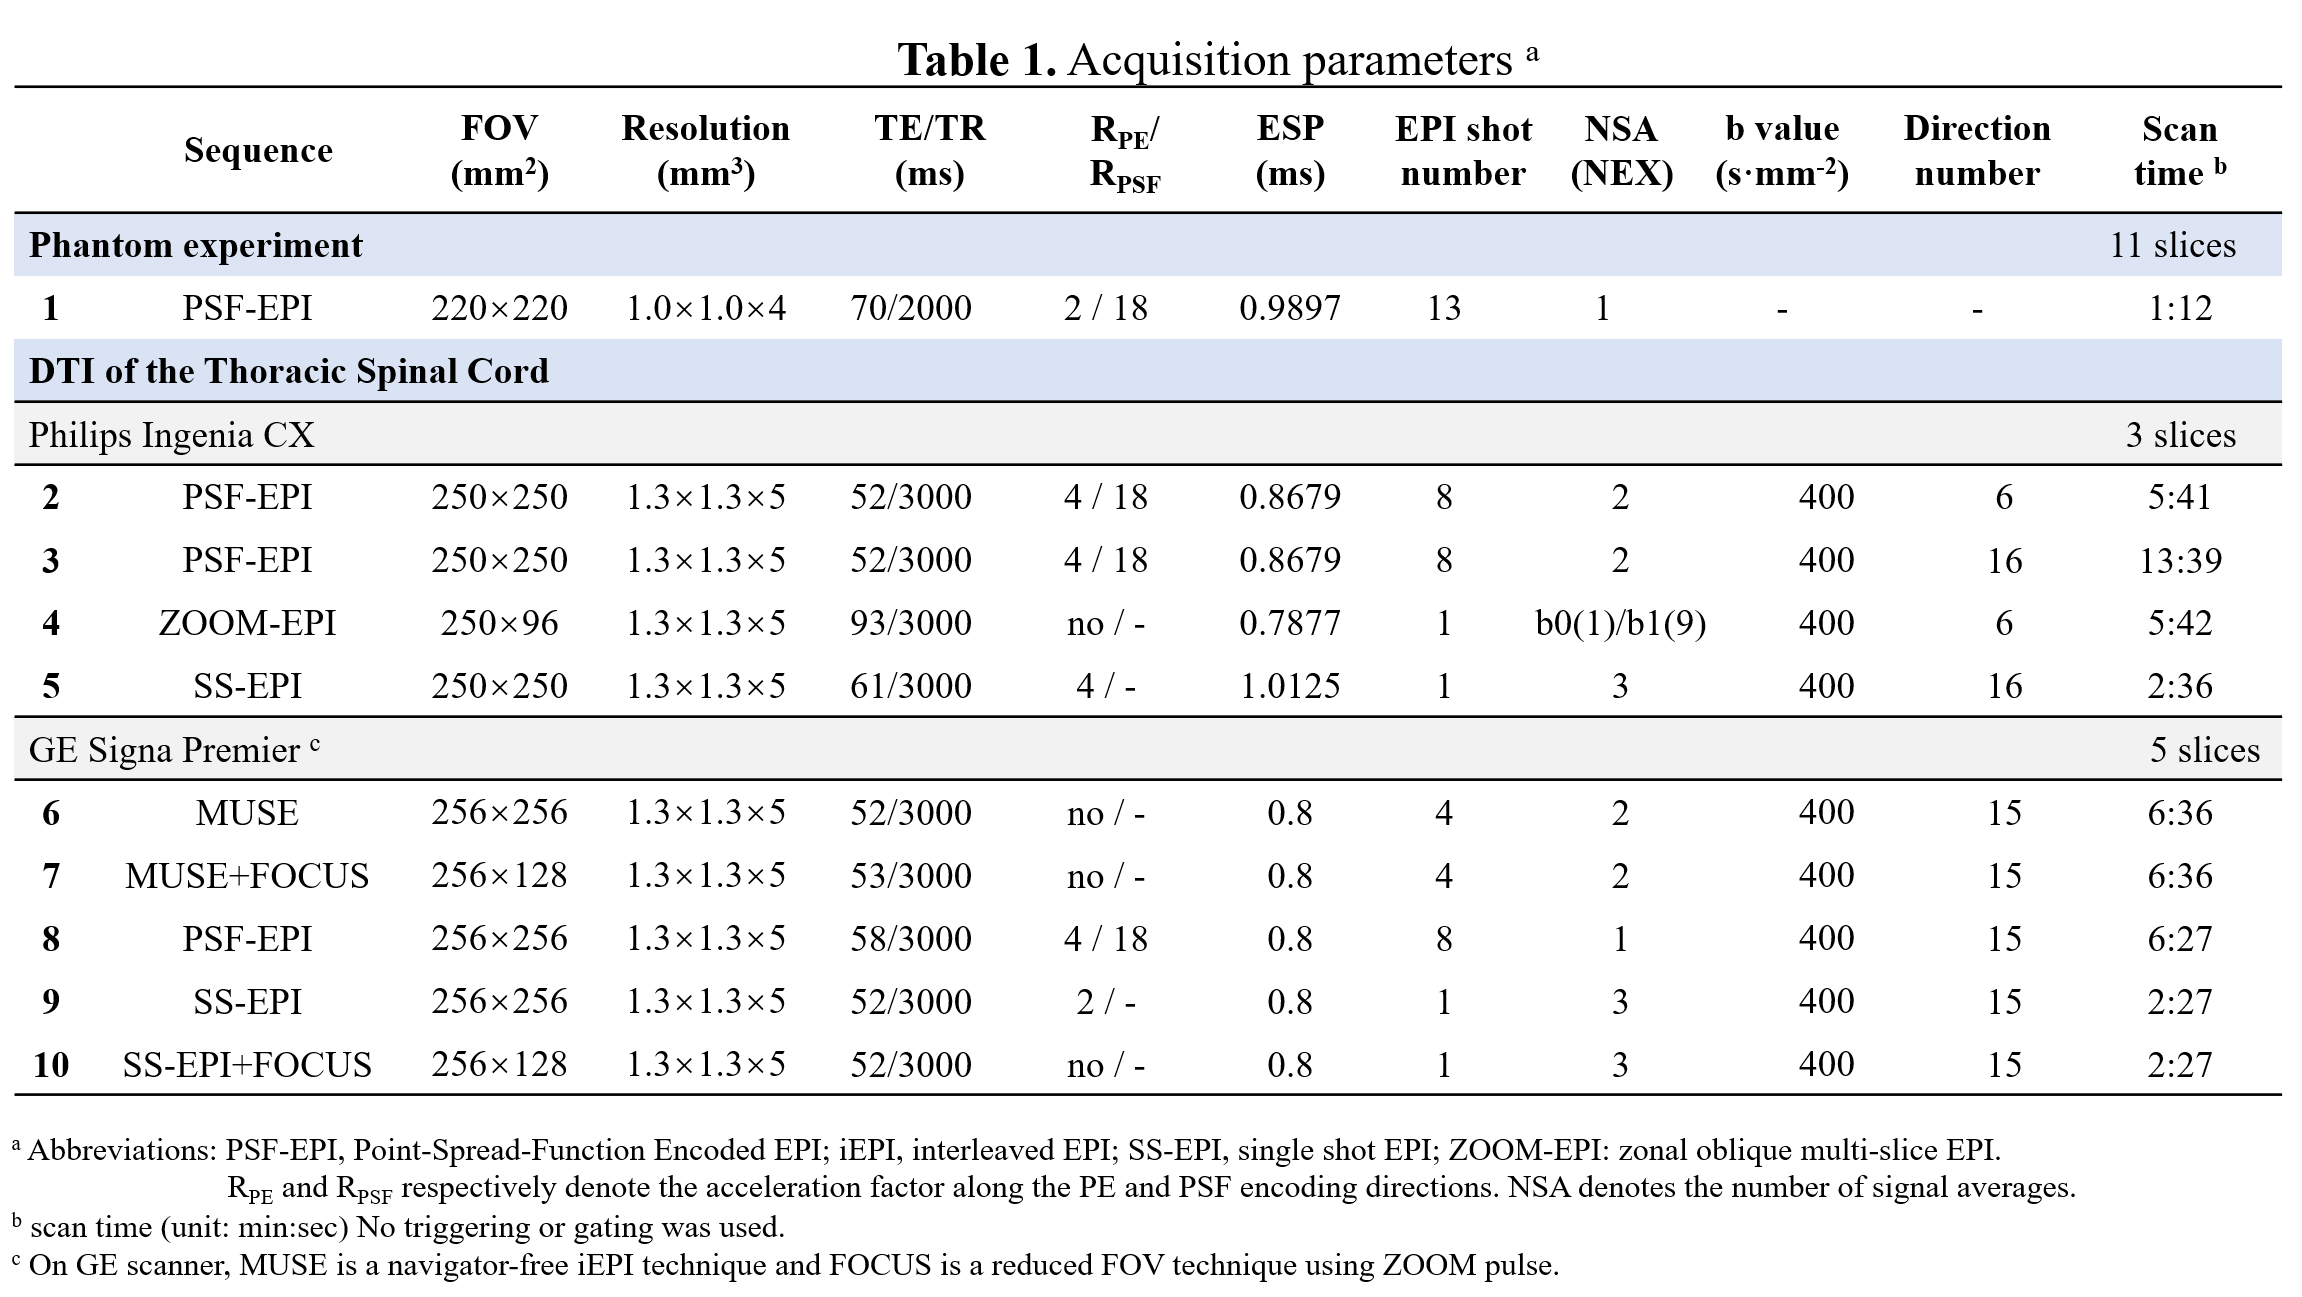
In PSF-EPI, an additional phase encoding gradient is exerted to the conventional phase encoding (PE) direction of 2D EPI in a multi-shot manner (Fig.1A). This generates a 3D k-space dataset consisting of $$$k_x$$$, $$$k_y$$$ and $$$k_{psf}$$$. At a given $$$k_y$$$ encoding step, all signals across the PSF encoding dimension share the same echo time. Thus images from $$$k_x$$$-$$$k_{psf}$$$ are distortion-free. Validation of distortion-free imaging are shown in Fig.1B. Here, tilted-CAIPI acquisition scheme and parital Fourier undersampling were also integrated for high acceleration (>20×).The scans were performed on a Philips 3T Ingenia CX scanner (Philips Healthcare, Best, The Netherlands) and a GE 3T Signa Premier scanner (GE Healthcare, Waukesha, Wisconsin). To evaluate the efficacy of various EPI-based methods in distortion reduction, comparison experiments were performed on both scanners. On the Philips scanner, PSF-EPI was compared with ZOOM-EPI using similar scan time as well as SS-EPI (Table 1, scan 2-5). On the GE scanner, PSF-EPI was compared with MUSE, MUSE+FOCUS, SS-EPI+FOCUS and SS-EPI with parallel imaging (Table 1, scan 6-10), where MUSE is a navigator-free iEPI technique and FOCUS is a rFOV technique using ZOOM pulse. The specific imaging parameters are summarized in Table 1. The time of the calibration scan for PSF-EPI was excluded, which took about 30s. No triggering or gating was used for any of the sequences. Seven healthy volunteers were recruited. This study was approved by the Institutional Review Board and written informed consent was obtained from each participant.
The tensor fitting and measurement of DTI metrics were performed in FSL (FMRIB, Oxford, UK) and DTI studio13. We also used Bland-Altman plots to test the quantitative reproducibility through two repeated scans.
Results
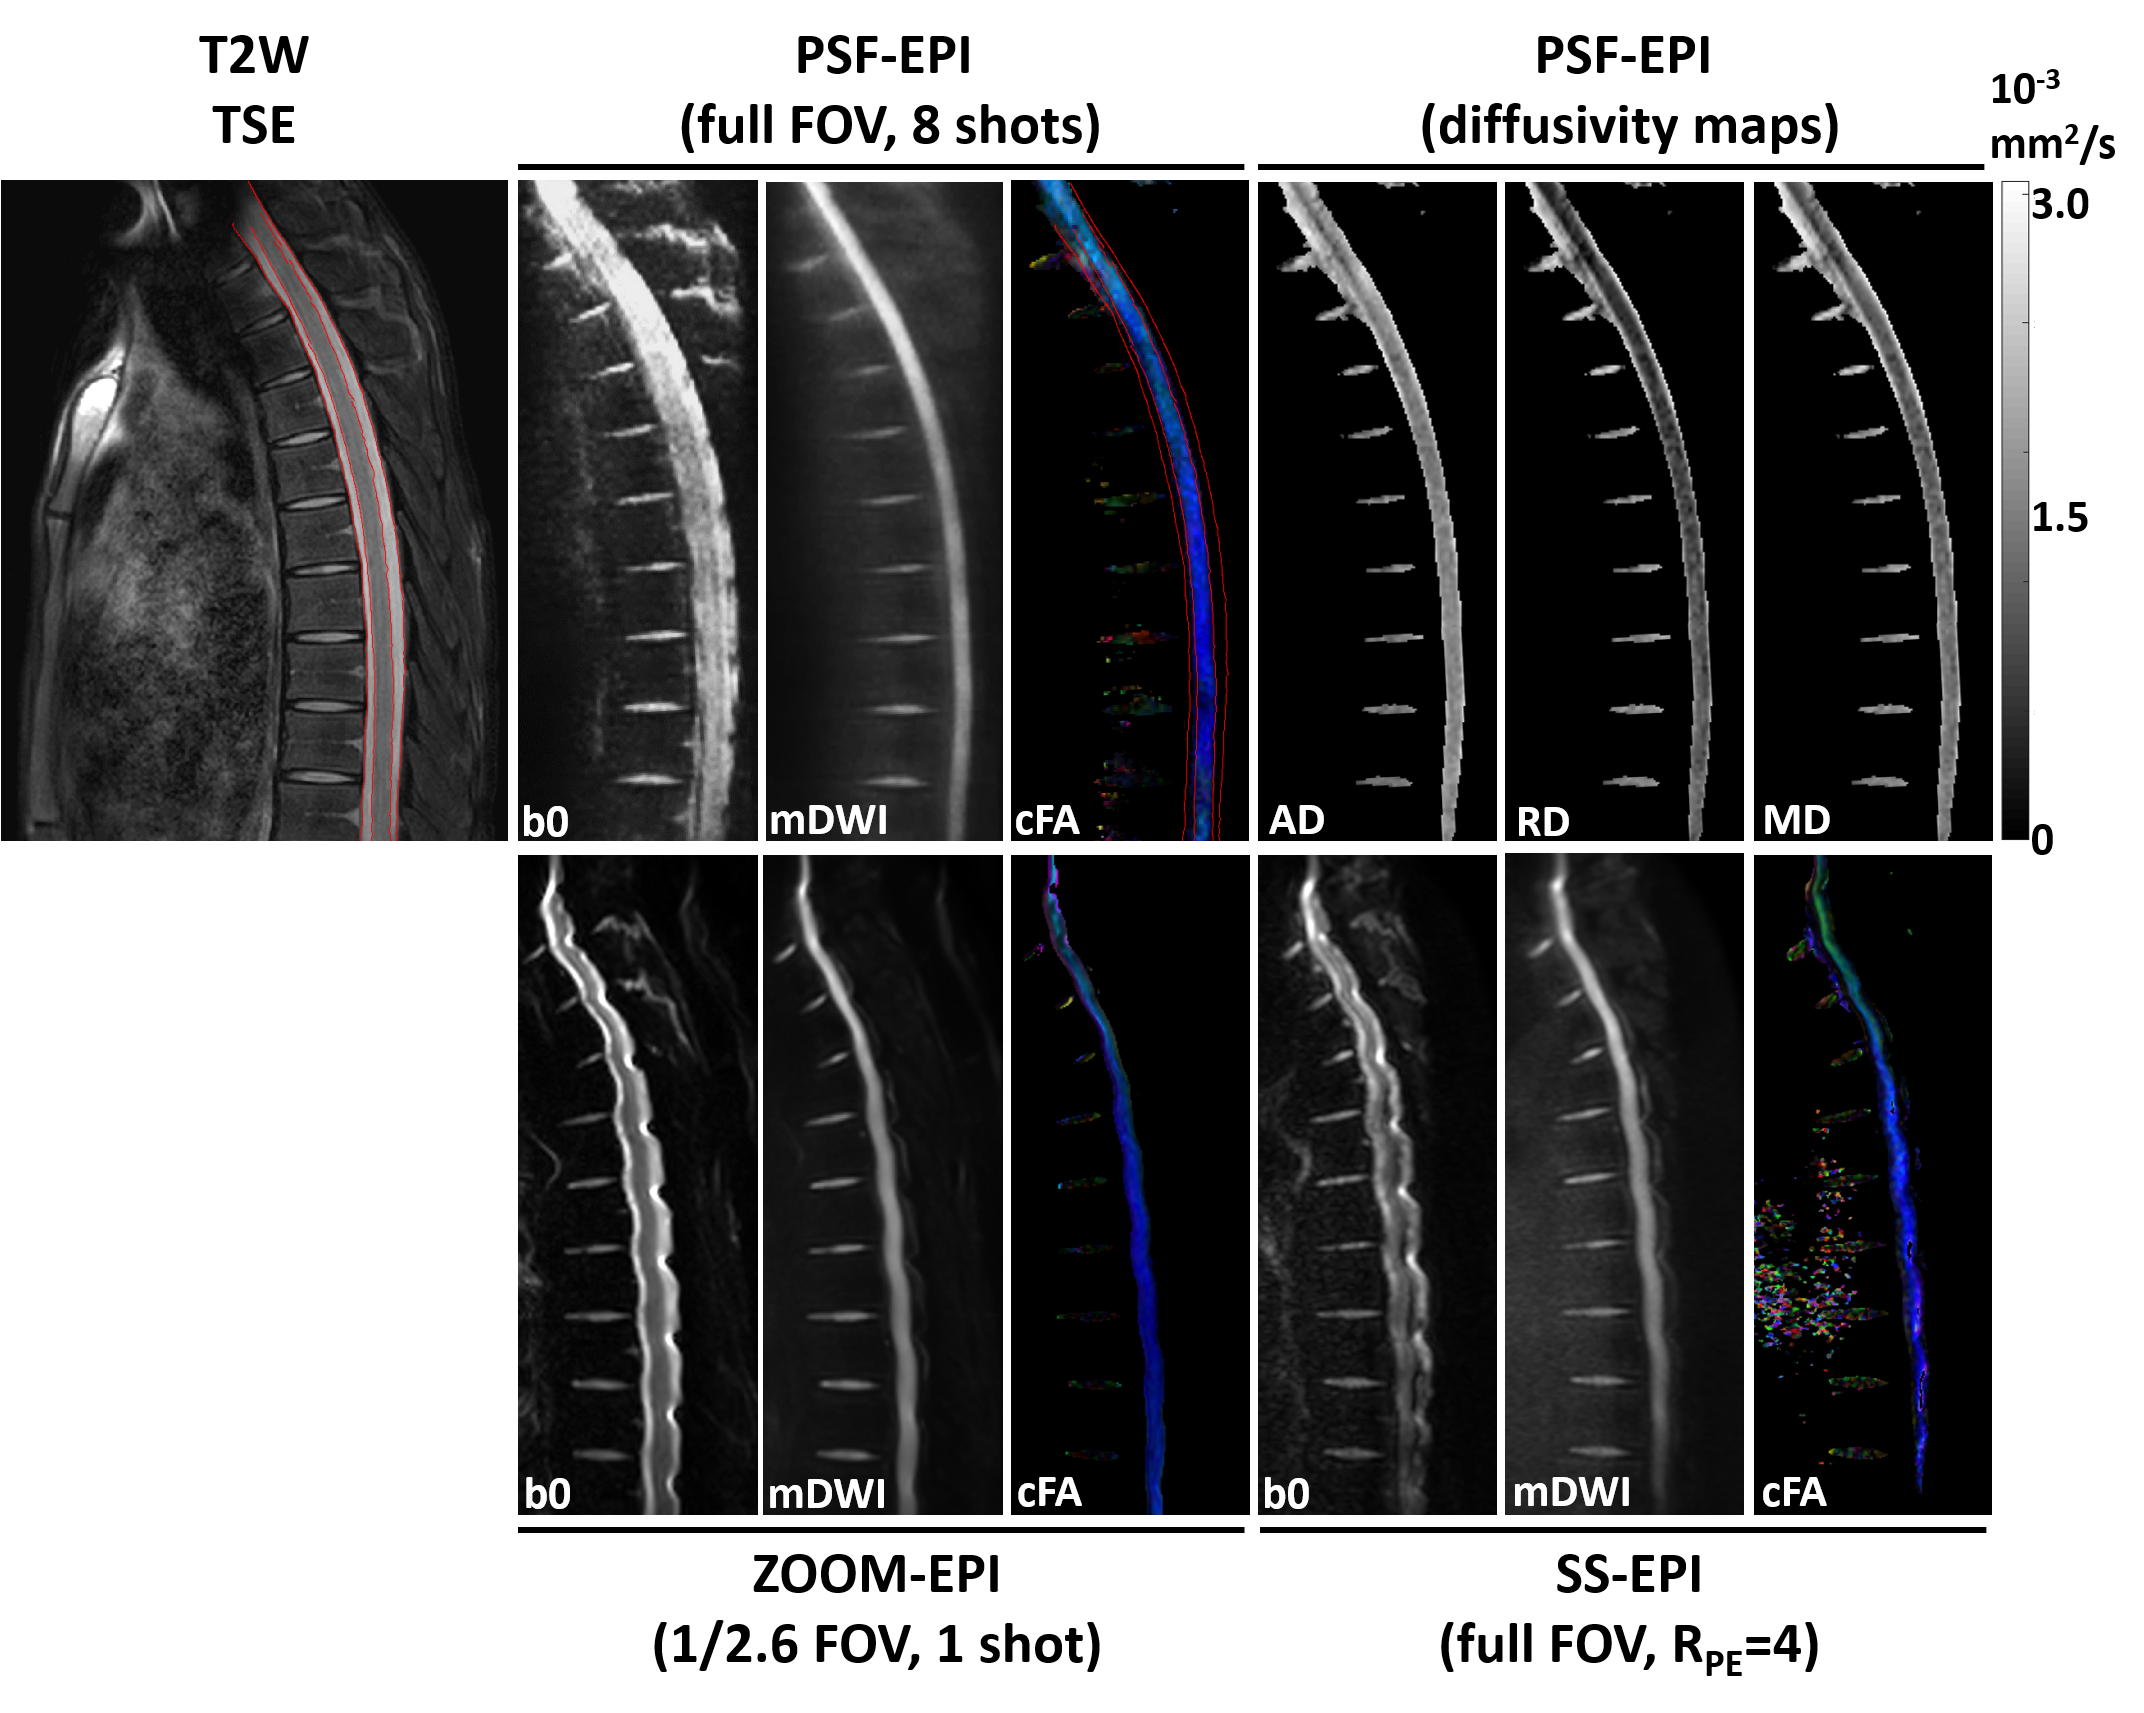
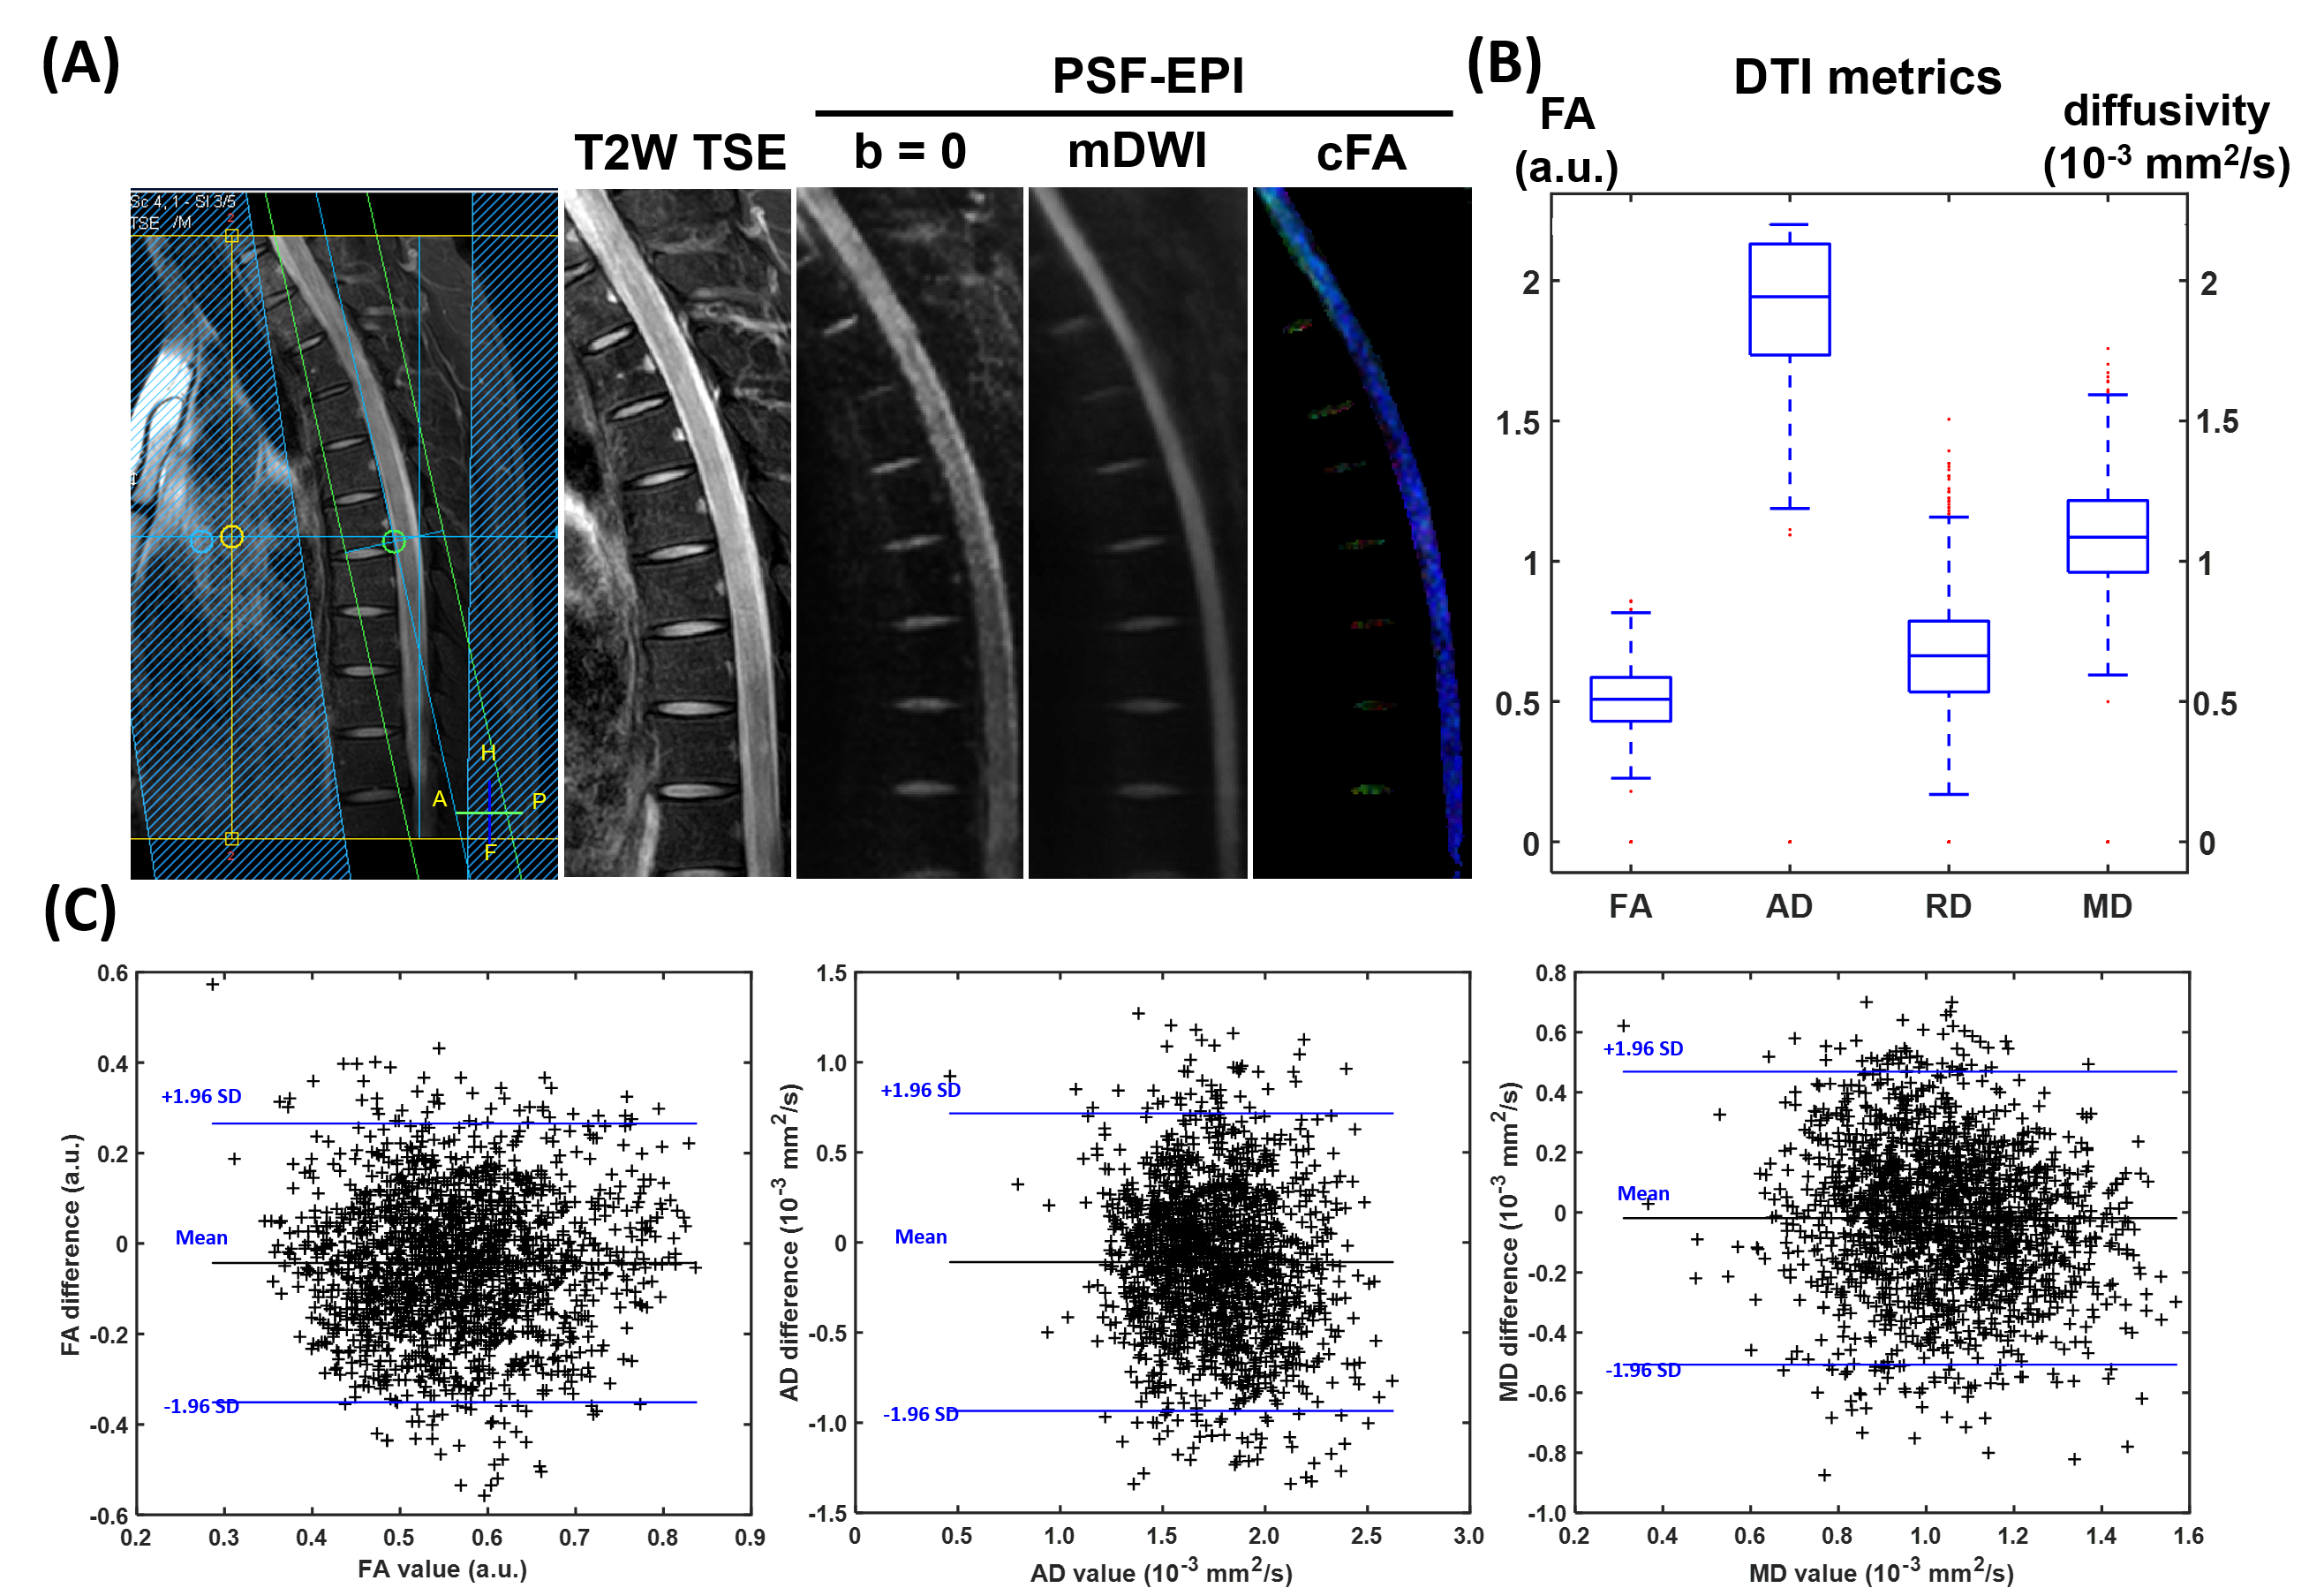
Fig.2 demonstrates DTI of the thoracic spinal cord using full FOV PSF-EPI (Table 1, scan 3), rFOV ZOOM-EPI (scan 4), and full FOV SS-EPI with RPE=4 (scan 5). Compared with full FOV SS-EPI, ZOOM-EPI method mitigated distortions by reducing the FOV along PE by 2.6 fold, though visible distortions remained around intervertebral disks. In contrast, the PSF-EPI images show high consistency with the anatomical reference through the entire spinal cord. The major structural boundaries (red lines) align well with the T2W anatomical reference. Additionally, the measured quantitative diffusivity values from PSF-EPI generally agree with previously reported values14.Fig.3A shows the PSF-EPI results from another healthy volunteer (Table 1, scan 2). The acquisition time is around 6 minutes. As shown in Fig. 3B, the DTI measures are analogous to the reference values from previous sagittal spinal cord diffusion studies5,15,16. Additionally, the reproducibility of quantitative measurement was also tested. As shown in the Bland-Altman plots, the DTI metrics differences demonstrate negligible bias or trend.
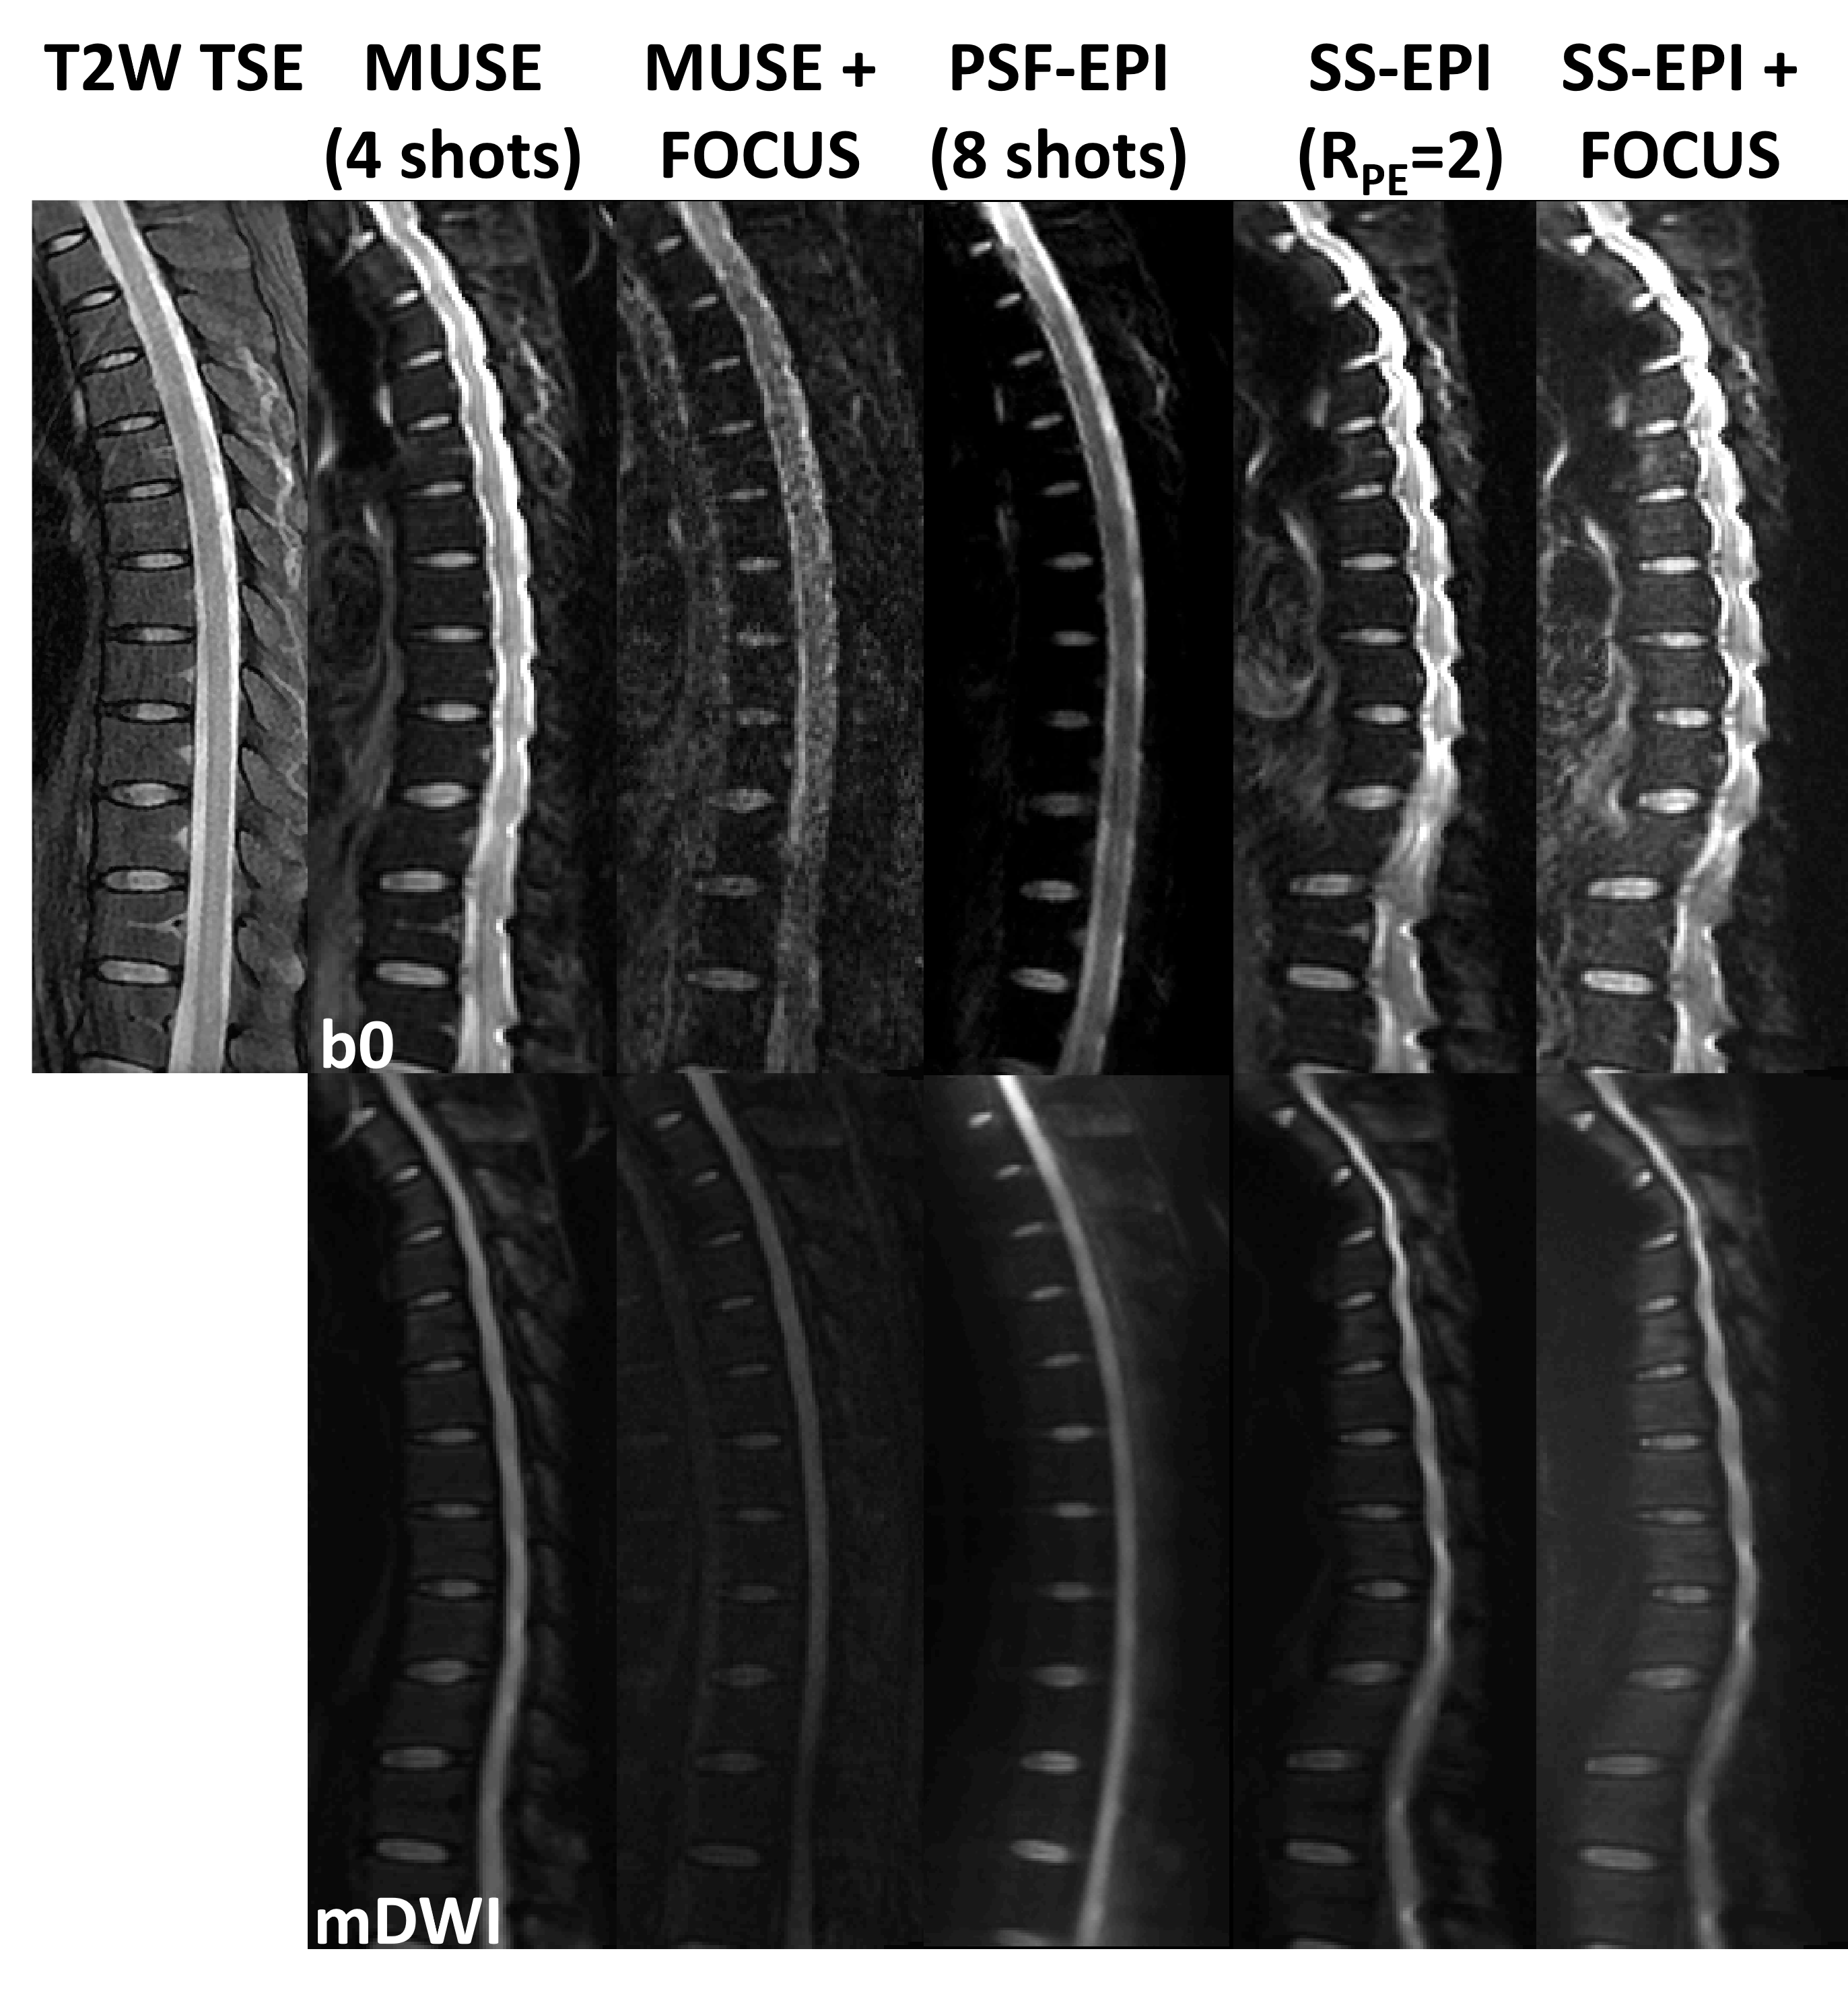
In Fig.4, SS-EPI with RPE=2 demonstrates similar image quality with that of SS-EPI+FOCUS (1/2 FOV). In comparison, 4-shot MUSE images show reduced distortions while 4-shot MUSE+FOCUS (1/2 FOV) images show further improved fidelity though with residual artifacts possibly due to the failure in phase correction. Particularly, the latter images are close to 8-shot PSF-EPI (scan 8) images. Given above, the PSF-EPI method demonstrated high fidelity with acceptable SNR and scan time (around 6.5 minutes).
Discussion and Conclusion
In this study, we demonstrated the feasibility of high-resolution DTI for thoracic spinal cord using tilted-CAIPI accelerated PSF-EPI sequence and compared its efficacy in distortion correction with multiple advanced EPI-based techniques. PSF-EPI showed similar performance of distortion correction on both Philips and GE scanners. With clinically practical acquisition time, the 8-shot PSF-EPI results show high anatomical fidelity with reasonable SNR levels. Additionally, the results of quantitative assessments indicate acceptable reproducibility of PSF-EPI.For future work, patient group that includes various pathologies will be recruited for better clinical evaluation.
Acknowledgements
No acknowledgement found.References
1. Andre JB, Bammer R. Advanced Diffusion-Weighted Magnetic Resonance Imaging Techniques of the Human Spinal Cord. Topics in Magnetic Resonance Imaging Tmri 2010;21(6):367-378.
2. Ellingson BM, Cohen-Adad J. Diffusion-Weighted Imaging of the Spinal Cord. Quantitative MRI of the Spinal Cord: Elsevier; 2014. p 123-145.
3. Budzik J-F, Balbi V, Le Thuc V, Duhamel A, Assaker R, Cotten A. Diffusion tensor imaging and fibre tracking in cervical spondylotic myelopathy. European radiology 2011;21(2):426-433.
4. Maier SE. Examination of Spinal Cord Tissue Architecture with Magnetic Resonance Diffusion Tensor Imaging. Neurotherapeutics 2007;4(3):453-459.
5. Zaharchuk G, Saritas E, Andre J, et al. Reduced field-of-view diffusion imaging of the human spinal cord: comparison with conventional single-shot echo-planar imaging. American journal of neuroradiology 2011;32(5):813-820.
6. Holdsworth SJ, Skare S, Newbould RD, Bammer R. Robust GRAPPA-Accelerated Diffusion-Weighted Readout-Segmented (RS)-EPI. Magnetic Resonance in Medicine 2009;62(6):1629-1640.
7. Bammer R, Augustin M, Prokesch RW, Stollberger R, Fazekas F. Diffusion‐weighted imaging of the spinal cord: interleaved echo‐planar imaging is superior to fast spin‐echo. Journal of Magnetic Resonance Imaging: An Official Journal of the International Society for Magnetic Resonance in Medicine 2002;15(4):364-373.
8. Wheeler-Kingshott CA, Hickman SJ, Parker GJ, et al. Investigating cervical spinal cord structure using axial diffusion tensor imaging. Neuroimage 2002;16(1):93-102.
9. Holdsworth S, Skare S, O'Hallaran R, Bammer R. Reduced-FOV diffusion imaging with ZOnal Oblique Multislice (ZOOM) combined with readout-segmented (RS)-EPI. Proc Intl Soc Mag Reson Med, 2010. p. 1611.
10. Robson MD, Gore JC, Constable RT. Measurement of the point spread function in MRI using constant time imaging. Magnetic resonance in medicine 1997;38(5):733-740.
11. Dong Z, Wang F, Reese TG, et al. Tilted‐CAIPI for highly accelerated distortion‐free EPI with point spread function (PSF) encoding. Magnetic resonance in medicine 2019;81(1):377-392.
12. Zeng H, Constable RT. Image distortion correction in EPI: comparison of field mapping with point spread function mapping. Magnetic Resonance in Medicine: An Official Journal of the International Society for Magnetic Resonance in Medicine 2002;48(1):137-146.
13. Jiang H, van Zijl PCM, Kim J, Pearlson GD, Mori S. DtiStudio: Resource program for diffusion tensor computation and fiber bundle tracking. Computer Methods and Programs in Biomedicine 2006;81(2):106-116.
14. Andre JB, Zaharchuk G, Saritas E, et al. Clinical evaluation of reduced field-of-view diffusion-weighted imaging of the cervical and thoracic spine and spinal cord. AJNR Am J Neuroradiol 2012;33(10):1860-1866.
15. Jeong EK, Kim SE, Guo J, Kholmovski EG, Parker DL. High‐resolution DTI with 2D interleaved multislice reduced FOV single‐shot diffusion‐weighted EPI (2D ss‐rFOV‐DWEPI). Magnetic resonance in medicine 2005;54(6):1575-1579.
16. Kim T, Zollinger L, Shi X, et al. Quantification of diffusivities of the human cervical spinal cord using a 2D single-shot interleaved multisection inner volume diffusion-weighted echo-planar imaging technique. American journal of neuroradiology 2010;31(4):682-687.
Figures