0103
Resolving to super resolution multi-dimensional diffusion imaging (Super-MUDI)1NVIDIA Corporation, Bethesda, MD, United States, 2Department of Applied Mathematics and Computer Science, Technical University of Denmark, Kongens Lyngby, Denmark, 3École polytechnique fédérale de Lausanne (EPFL), Lausanne, Switzerland, 4CMIC, University College London, London, United Kingdom, 5Institute of Imaging Science, Vanterbilt University, Nashville, TN, United States, 6Department of Computer Science, Vanterbilt University, Nashville, TN, United States, 7Otto von Guericke University, Magdeburg, Germany, 8AGH University of Science and Technology, Krakow, Poland, 9Institute of Cancer Research, London, United Kingdom, 10CUBRIC, Cardiff University, Cardiff, United Kingdom, 11University of Southern California, Los Angeles, CA, United States, 12NYU Langone, New York, NY, United States, 13Center for Biomedical Imaging Research, Department of Biomedical Engineering, Tsinghua University, Beijing, China, 14Istanbul Technical University, Istanbul, Turkey, 15Harvard Medical School, Boston, MA, United States, 16Centre for Medical Engineering, King's College London, London, United Kingdom
Synopsis
Diffusion-weighted magnetic resonance imaging (DW-MRI) is a critical modality that allows characterization of microstructure of the nervous tissue in the human brain. Recent multi-parametric acquisitions expand parameter space to b-values, gradient directions, inversion and echo times. The required long scanning time could be shortened by acquiring at lower resolutions while superesolving the images during post-processing. This work embodies the evaluation of an open challenge where the objective was to upsample multi dimensional data encoding simultaneously T1, T2* and diffusion contrast to the natively acquired voxel resolution from two different down-sampled sets of the data (isotropic down-sampled and anisotropic down-sampled).
Introduction
Multi-dimensional diffusion-weighted magnetic resonance imaging (DW-MRI) is a complex MRI modality that expands acquisition parameter space and allows for characterization of microstructural properties of the nervous tissue of the human brain. Different combinations of b-values (b), gradient directions (dir), inversion times (IT), and echo times (TE) lead to images having different contrasts. The enlarged parameters space increases acquisition time, rendering the approach potentially impracticable for wider research and clinical applications. Although acquisition strategies like ZEBRA (Hutter et al. 2018) drastically reduce acquisition time, a full coverage of the parameter space (b,dir,IT,TE) remains unfeasible within clinical practice. The urge for providing more information within clinically feasible setups motivated the organization of the Super MUlti-dimensional DIffusion (Super-MUDI) challenge, where participants were called to upsample the data to the native acquisition resolution. The provided 5 training and 2 test volumes were downsampled with two strategies: isotropic (overall lower resolution) and anisotropic (thicker slices). The evaluation is based on mean squared error (MSE).Methods
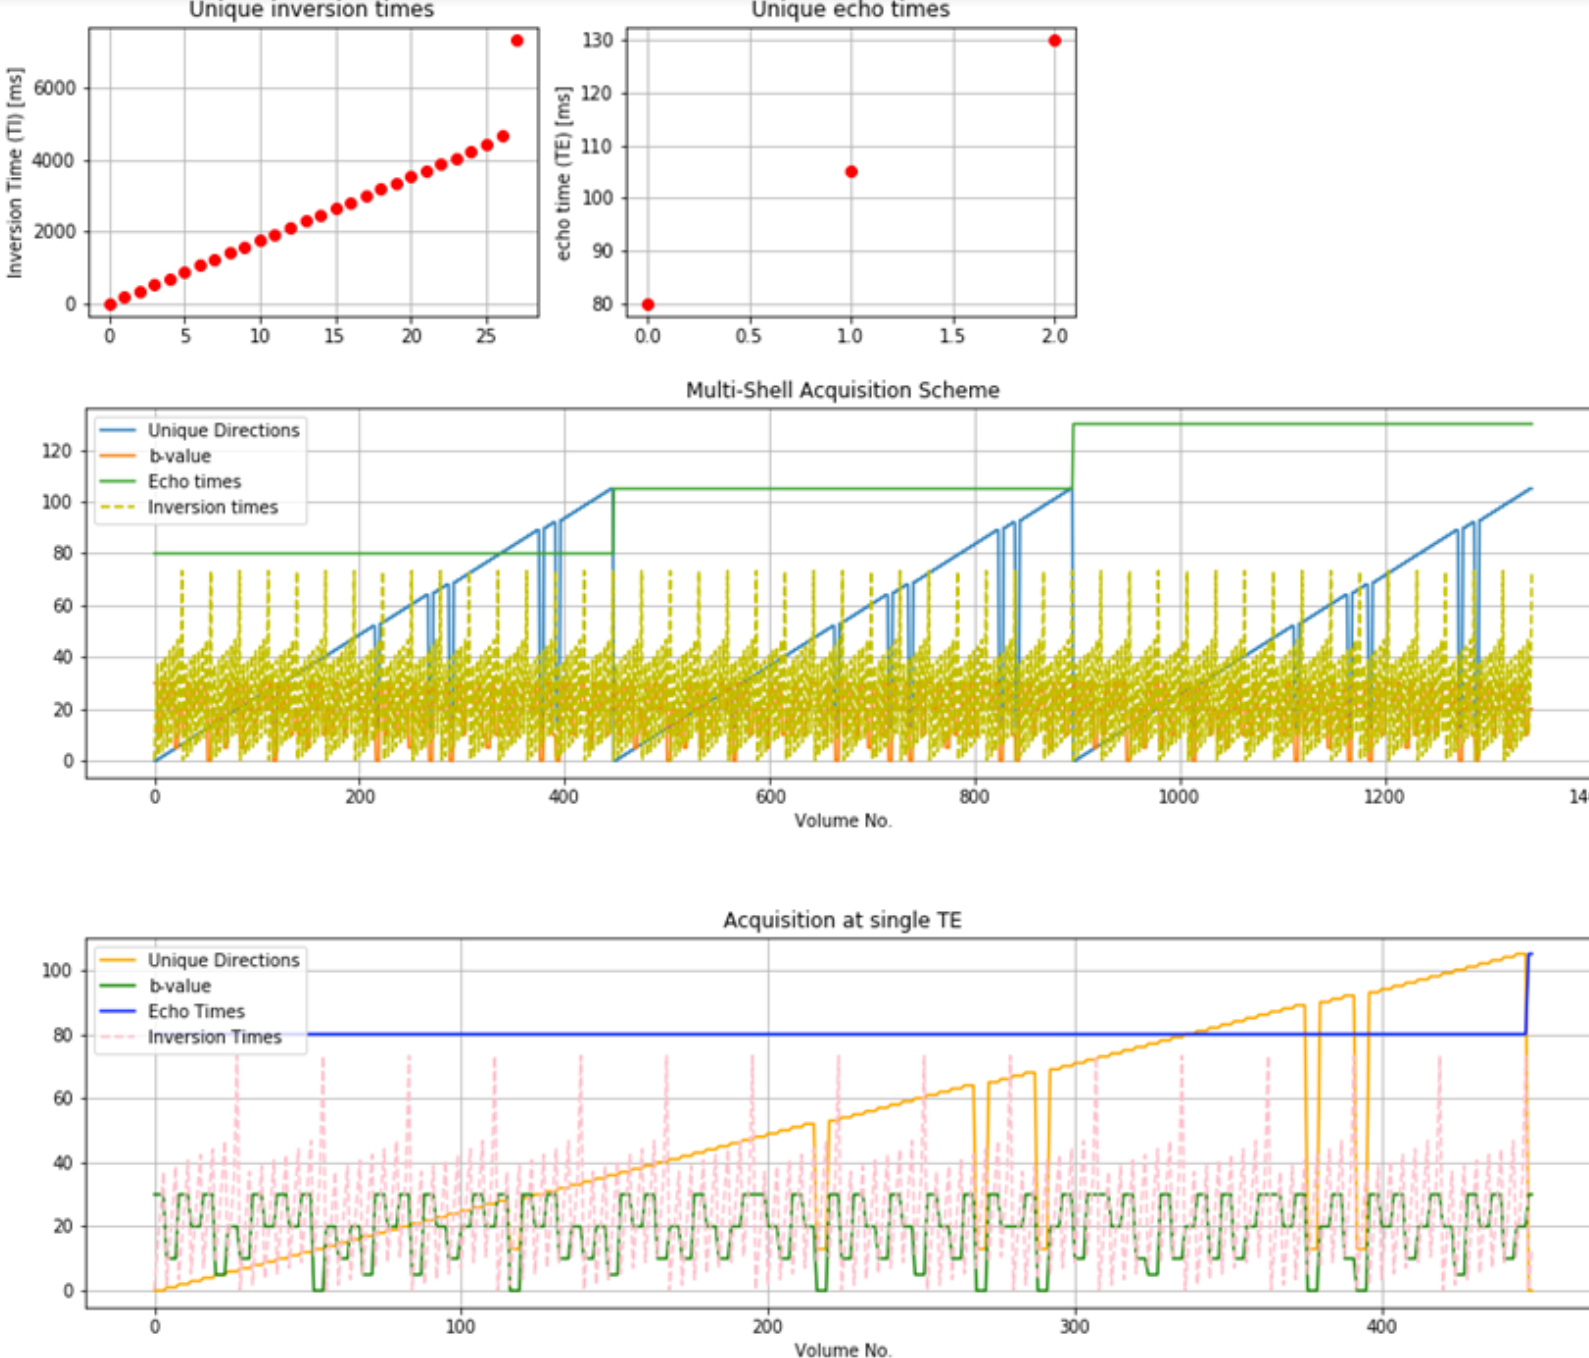
Data1344 volumes (Fig. 1) comprising 106 unique gradient directions uniformly spread over four b-shells (500, 1000, 2000, 3000 s/mm^2), three TEs, and 28 ITs were acquired from five healthy human volunteers (3f, 2m, 19-46 years), after informed consent (REC 12/LO/1247), on a clinical 3T Philips Achieva scanner (Best, Netherlands) with a 32-channel adult head coil using the ZEBRA sequence (Hutter et al. 2018). Other parameters: TR=7.5s, Resolution=2.5mm isotropic, FOV=220x230x140mm, SENSE=1.9, halfscan=0.7, MB factor=2, TA (including prep time) =52min. Data was reconstructed with MB-SENSE and filtered using matrix recovery (Cordero-Grande et al. 2019).
Preprocessing
Ad-hoc volume registration was performed on the data. Collinear magnitude diffusion-weighted images (DWIs) acquired with different pairs (IT,TE) were first co-registered together using the highest IT and lowest TE volume as reference. The 106 reference volumes were then registered together based on a mutual information metric using Dipy (Garyfallidis et al. 2014), and the registrations were then propagated across the corresponding collinear DWIs. Data was collected with reversed phase-encode blips to allow for susceptibility-induced distortion correction (Andersson et al. 2003; Smith et al. 2004) in FSL.
Tasks
For the training, all 5 subjects were provided with both original acquisition and the down-sampled data. The ground truth was withheld for testing cases.
Isotropic Upsampling (IU):The data were downsampled to 5x5x5 mm3 by averaging 8 adjacent 2.5x2.5x2.5mm3 voxels organized in a cubic lattice around each original voxel location, to obtain overlapping low resolution voxels.
Anisotropic Upsampling (AU): The data were downsampled to 2.5x2.5x5 mm3 by averaging each two consecutive slices (e.g. slice 1 and 2; then slice 2 and 3; and so on.)EvaluationThe overall performance of each submission was evaluated by computing voxel-wise MSE between predicted and ground-truth signals for each (b-TE-IT) combination, and considering the average MSE values over all the voxels within the brain mask separately for gray matter (GM) and white matter (WM).
Results
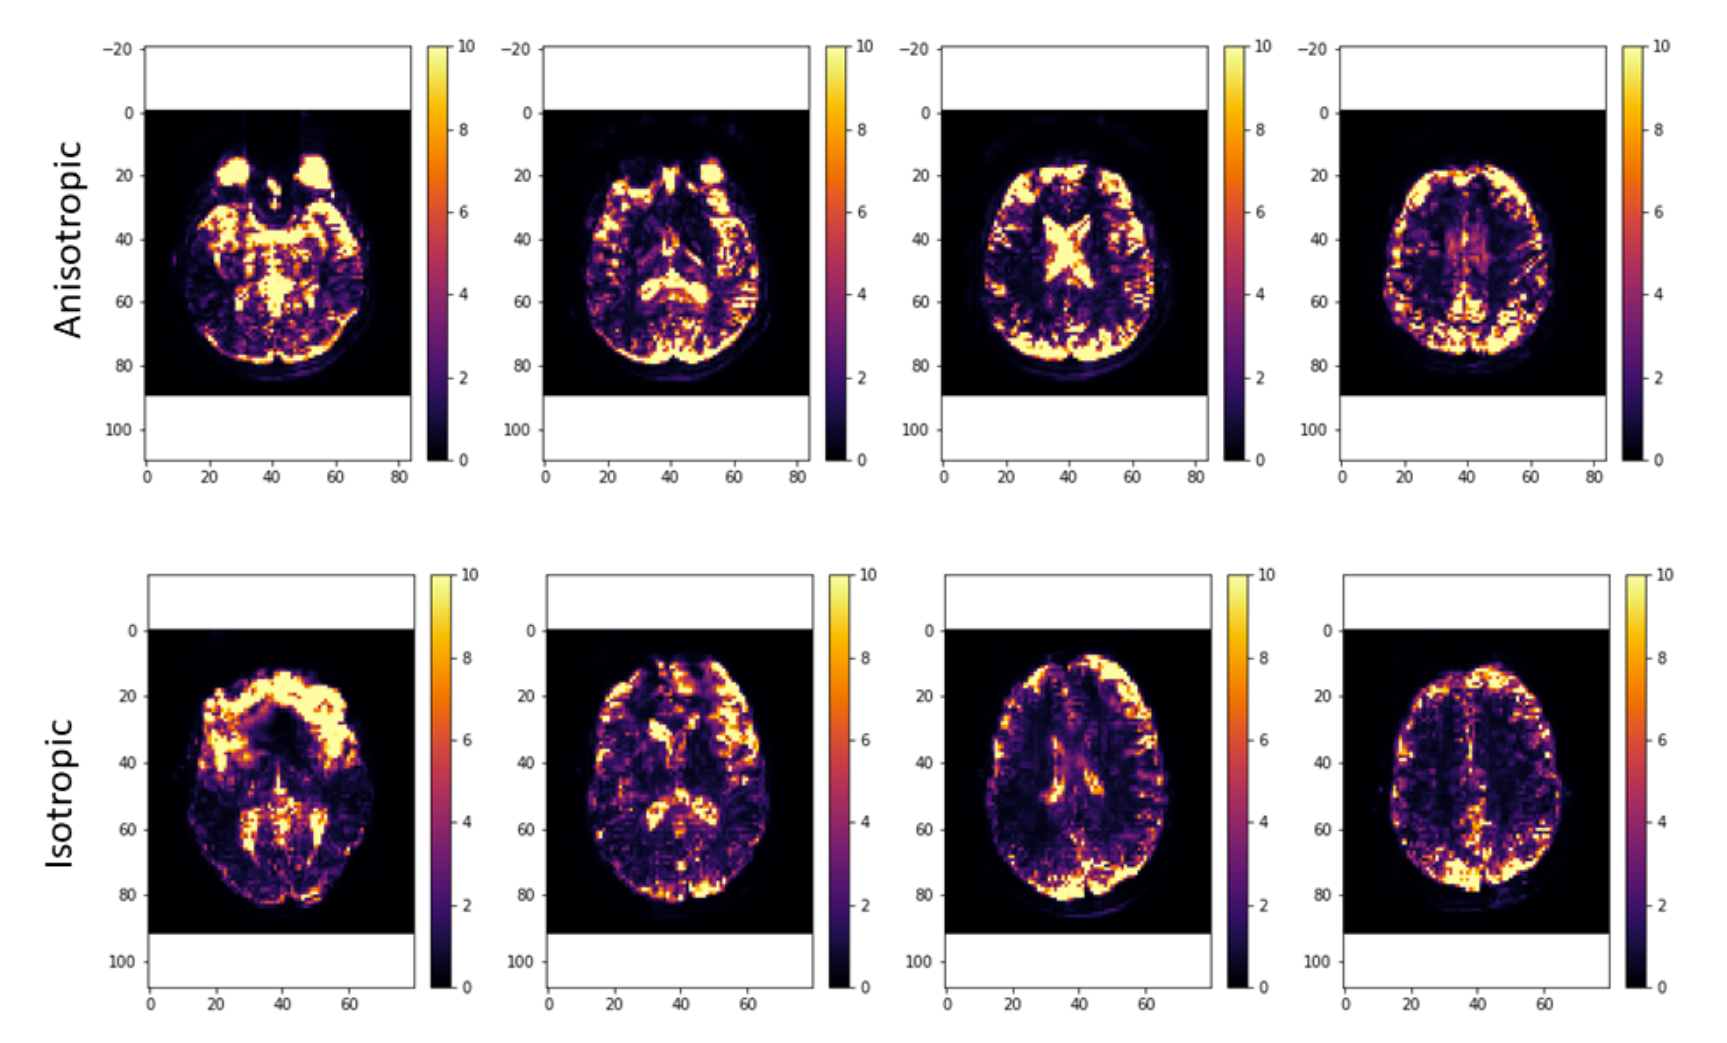
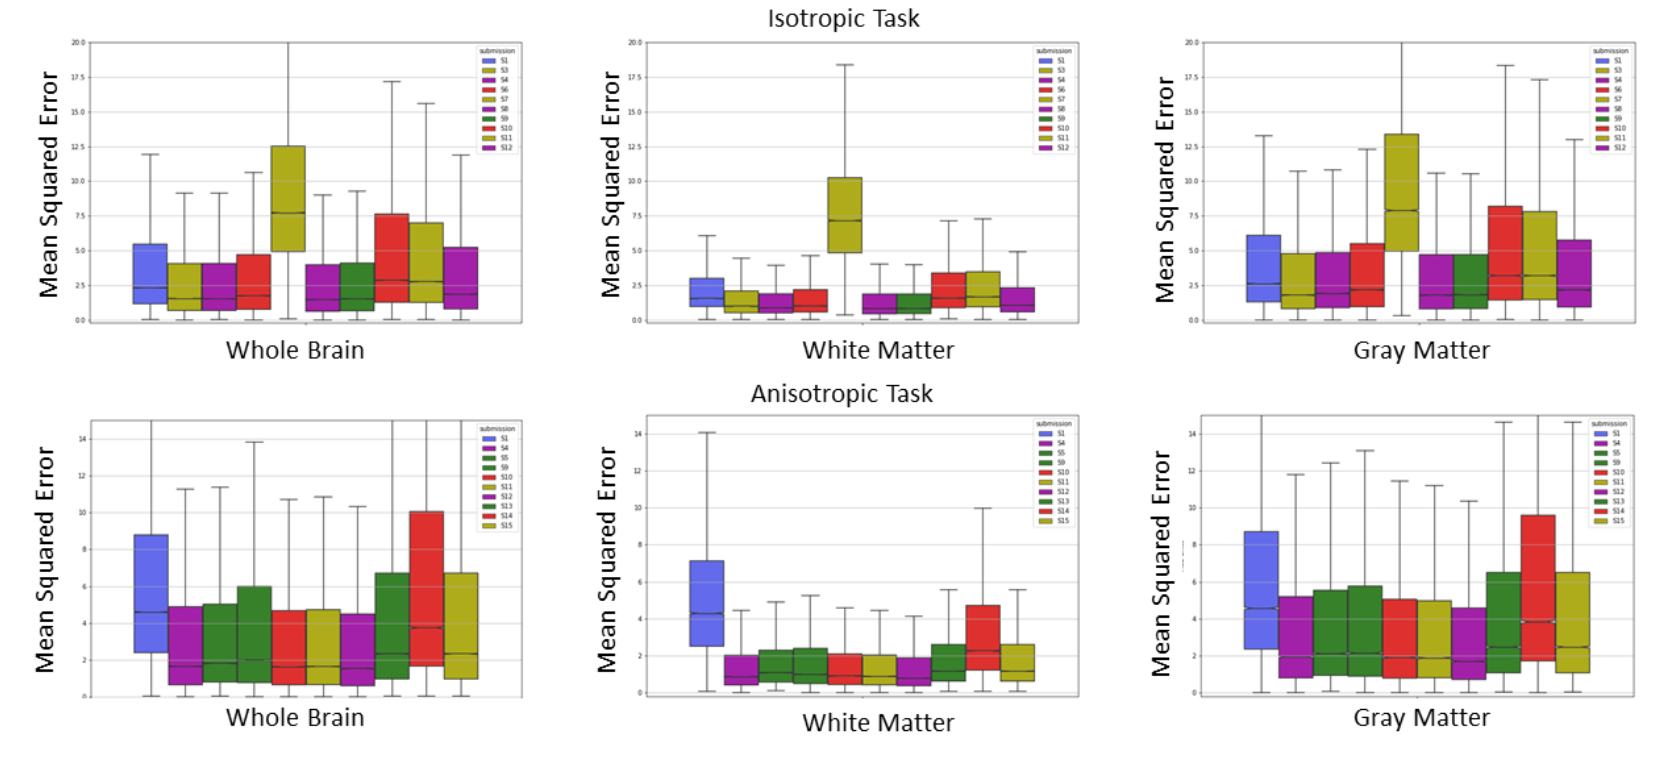
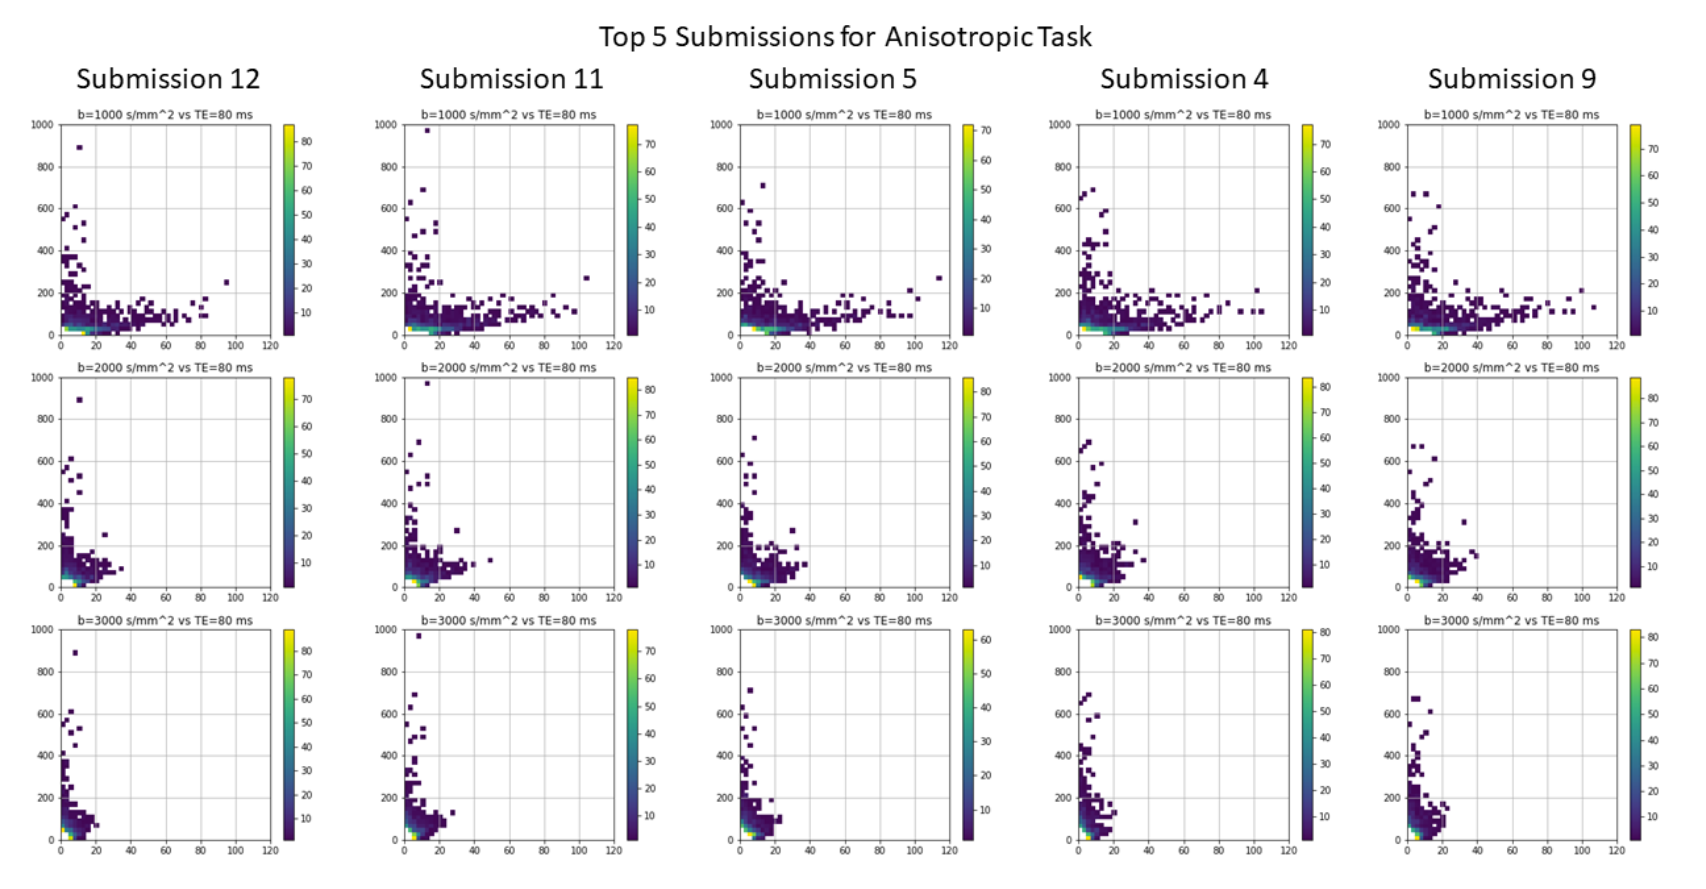
A total of 15 unique submissions were submitted for AU task and 12 for IUt task by 10 participating teams from all over the globe. The median error illustrated in Fig. 2 highlights upsampling strategies have a worse performance in GM regions and in cerebrospinal fluid. Relatively lower errors for WM can be observed. Quantitatively, observing Fig. 3 the top five submissions with the lowest error indicate relatively similar errors irrespective of the task. The overall whole brain MSE for AU task is in the range of 5.3272-6.1226 with a mean of 5.7498 and for IU the same is in the range of 4.9445-5.8220 with a mean of 5.3882. Overall the methods have a slight lower error for the IU task. Among the top 5 submissions, 4 methods are based on deep learning and one is based on classical mathematical transformation that is the simple cubic interpolation (Keys et al. 1981).Discussion and Conclusion
Relevant differences between the isotropic and anisotropic tasks are clearer in gray compared to white matter. One highlight of the challenge is that the best performing method is based on cubic spline interpolation. Errors from data-driven methods indicate however similar errors. The high complexity of the data, encoding a large variety of contrasts, might be a potential reason as well as the chosen subsampling.The four deep learning methods: 1) Image quality transfer using U-nets with a patch based technique. 2) A two stage self-attention generative adversarial network 3) Cubic spline interpolation coupled with a convolutional neural network 4) Generative adversarial network. All 4 deep learning based approaches are highly contrastive to each other and yet perform similarly to the best performing approach which is cubic spline interpolation. This challenge was organized as a complement to the MUDI challenge (Pizzolato et al 2020), where the objective was the exploitation of the redundancy of the data in the acquisition parameters space.Acknowledgements
We would like to thank all volunteers for their contribution. MPiz acknowledges support from European Union’s Horizon 2020 research and innovation programme under the Marie Skłodowska-Curie grant agreement No 754462. TP acknowledges the Polish National Agency for Academic Exchange for grant PN/BEK/2019/1/00421 under the Bekker programme and the Ministry of Science and Higher Education (Poland) under the scholarship for outstanding young scientists. FB acknowledges AGH Science and Technology, Kraków, Poland (16.16.120.773). AH acknowledges the support by Children’s Cancer and Leukaemia Group (CCLGA201906). MA was supported by a Wellcome Trust Investigator Award (096646/Z/11/Z). SHB is supported in part by the National Institutes of Health (NIH, R01-CA111996, R01-NS082436, R01-MH00380 and P41EB017183). MPal, FG, DCA, TM and SBB acknowledge support from the UK EPSRC (EP/M020533/1, EP/N018702/1, EP/R006032/1), EU Horizon 2020 (ID 634541), NIH (Placenta imaging Project); Grant number: 1U01HD087202-01. MP is supported by UKRI Future Leaders Fellowship (MR/T020296/1). LN is supported in part by NIH grants R21MH116352, R21MH115280, K01MH11 7346. SA-F’s work was supported by Ministerio de Ciencia e Innovación of Spain with research grant RTI2018-094569-B-I00; FZ is supported by the following NIH grants: P41EB015898, R01MH108574, P41EB015902, R01MH 119222. JH was supported by the Wellcome Trust (Sir Henry Wellcome Fellowship, [201374/Z/16/Z] [201374/Z/16/B]), a UKRI FLF fellowship [MR/T018119/1] and the Wellcome/EPSRC Centre for Medical Engineering [WT 203148/Z/16/Z].References
(Andersson et al 2003) Andersson, Jesper L. R., Stefan Skare, and John Ashburner. 2003. “How to Correct Susceptibility Distortions in Spin-Echo Echo-Planar Images: Application to Diffusion Tensor Imaging.” NeuroImage 20 (2): 870–88.
(Cordero-Grande et al 2019) Cordero-Grande, Lucilio, Daan Christiaens, Jana Hutter, Anthony N. Price, and Jo V. Hajnal. 2019. “Complex Diffusion-Weighted Image Estimation via Matrix Recovery under General Noise Models.” NeuroImage. https://doi.org/10.1016/j.neuroimage.2019.06.039.
(Garyfallidis et al 2014) Garyfallidis, Eleftherios, Matthew Brett, Bagrat Amirbekian, Ariel Rokem, Stefan van der Walt, Maxime Descoteaux, Ian Nimmo-Smith, and Dipy Contributors. 2014. “Dipy, a Library for the Analysis of Diffusion MRI Data.” Frontiers in Neuroinformatics 8 (February): 8.
(Hutter et al 2018) Hutter, Jana, Paddy J. Slator, Daan Christiaens, Rui Pedro A. G. Teixeira, Thomas Roberts, Laurence Jackson, Anthony N. Price, Shaihan Malik, and Joseph V. Hajnal. 2018. “Integrated and Efficient Diffusion-Relaxometry Using ZEBRA.” Scientific Reports 8 (1): 15138.
(Smith et al 2004) Smith, Stephen M., Mark Jenkinson, Mark W. Woolrich, Christian F. Beckmann, Timothy E. J. Behrens, Heidi Johansen-Berg, Peter R. Bannister, et al. 2004. “Advances in Functional and Structural MR Image Analysis and Implementation as FSL.” NeuroImage 23 Suppl 1: S208–19.
(Pizzolato et al 2020) Pizzolato, M et al 2020. "Computational Diffusion MRI pp 195-208| Acquiring and Predicting Multidimensional Diffusion (MUDI) Data: An Open Challenge", LNCS CDMRI 2020
(Keys et al 1981) Keys, R. "Cubic convolution interpolation for digital image processing", IEEE Transactions on Acoustics, Speech, and Signal Processing ( Volume: 29, Issue: 6, Dec 1981) 1153-1160
Figures