0101
10min Whole-Brain MRI Solution – Comprehensive Quantification of MR Relaxometry and Susceptibility Plus Synthetic Contrast-Weighted Images1Biomedical Imaging Research Institute, Cedars-Sinai Medical Center, Los Angeles, CA, United States, 2Department of Bioengineering, University of California, Los Angeles, Los Angeles, CA, United States
Synopsis
We propose an integrated and efficient solution to clinical whole-brain MRI in a single 10min sequence, producing co-registered, quantitative PD, T1, T2, T1ρ, T2*, QSM, and ΔB0 information plus clinically adopted, synthetic contrast-weighted images including PDw, T1w, T2w, T2*w, FLAIR, SWI, true-SWI, mIP, and true-SWI mIP simultaneously. Quantitative maps and contrast-weighted images are generated with good image quality and contrasts. Quantitative measurements agree with literature values. This method has the clinical potential for comprehensive risk assessment and disease evaluation, combining early detection, diagnosis, tissue characterization, and treatment monitoring of various brain diseases.
Introduction
Clinical MRI is dominated by qualitative exams. However, qualitative MRI is limited in sensitivity to subtle tissue alterations, biological specificity, and multi-center reproducibility1. Quantitative MRI (relaxometry, diffusion, and susceptibility) associates tissue properties with quantifiable biomarkers with improved sensitivity and reproducibility2-4, being clinically promising for early detection, tissue characterization, and treatment monitoring of diseases5-7. Nonetheless, the prolonged acquisition time and inter-scan misalignment of multiple parameters prevent widespread clinical applications of quantitative techniques. We present an integrated and efficient solution to clinical whole-brain MRI using MR Multitasking, which simultaneously quantifies T1, T2, T1$$$\rho$$$, T2*, and quantitative susceptibility mapping (QSM), and provides multiple synthetic contrast-weighted images for clinical diagnostic purposes in a single 10min sequence.Methods
Pulse sequence and data acquisition:The pulse sequence was built upon our brain T1/T2/T1$$$\rho$$$ mapping sequence8, replacing the single readout with multi-echo readouts after each FLASH pulse to generate T2* weightings (echo times $$$\tau_{E}$$$=2.46,7.38,14.76,22.14ms). T1/T2/T1$$$\rho$$$ weightings were generated by cycling through four T2-IR preparations (durations $$$\tau$$$=25,40,60,80ms) and four T1$$$\rho$$$-IR preparations (spin-lock times $$$\tau_{SL}$$$=15,40,65,90ms, spin-lock frequency=500Hz).
K-space data were acquired continuously. Subspace training data ($$$\mathbf{d}_{\mathrm{tr}}$$$) were collected at k-space center every 8 FLASH pulses. Imaging data ($$$\mathbf{d}_{\mathrm{img}}$$$) were sampled following a “center-enhanced” Gaussian density pattern, where the sampling density at a center k-space region of size Ny/16 x Nz/12 (Ny, Nz denote the phase and partition encoding steps) was 3 times higher compared to conventional Gaussian density. This aimed at better capturing k-space energy with an exceptionally high undersampling factor.
Image reconstruction:
MR Multitasking9 models the underlying 7D image function $$$x\left(\mathbf{r},n,\tau_{E},\tau,\tau_{SL}\right)$$$ with spatial locations $$$\mathbf{r}$$$, inversion recovery time index $$$n$$$ , multi-echo index $$$\tau_{E}$$$, T2-IR preparation index $$$\tau$$$, and T1$$$\rho$$$-IR preparation index $$$\tau_{SL}$$$ as a 5-way low-rank tensor $$$\mathcal{X}$$$ with elements $$$X_{ijklm}=x\left(\mathbf{r}_{i},n_{j},\tau_{E,k},\tau_{l},\tau_{SL,m}\right)$$$, which can be factorized in Tucker form as10:
$$\mathcal{X}=\mathcal{V}\times_{1}\mathbf{U}_{r},$$
$$\mathcal{V}=\mathcal{C}\times_{2}\mathbf{U}_{n}\times_{3}\mathbf{U}_{E}\times_{4}\mathbf{U}_{\tau}\times_{5}\mathbf{U}_{SL},$$
where $$$\mathcal{C}$$$ denotes the core tensor, the columns of each $$$\mathbf{U}$$$ matrix are basis functions for the corresponding tensor dimension, and $$$\times_{i}$$$ denotes the $$$i$$$-mode tensor product11.
$$$\mathcal{X}$$$ is reconstructed by serially estimating $$$\mathcal{V}$$$ and $$$\mathbf{U}_{r}$$$. First, $$$\mathcal{V}$$$ is extracted from high-order SVD12 of a training tensor constructed from Bloch-constrained low-rank tensor completion of $$$\mathbf{d}_{\mathrm{tr}}$$$8-9. Second, $$$\mathbf{U}_{r}$$$ is solved by fitting $$$\mathcal{V}$$$ to the imaging data:
$$\mathbf{U}_{r}=\arg\min_{\mathbf{U}_{r}}\left\|\mathbf{d}_{\mathrm{img}}-E\left(\mathcal{V}\times_{1}\mathbf{U}_{r}\right)\right\|^{2}+R_{s}\left(\mathbf{U}_{r}\right)$$
where $$$E$$$ combines multichannel encoding and sampling, and $$$R_{s}({\cdot})$$$ performs spatial regularization.
Experiment design:
Whole-brain MRI was performed on a 3T clinical scanner (Biograph mMR, Siemens) on $$$n$$$=6 healthy subjects. The Multitasking sequence was implemented in a 2-shot acquisition with FOV=224x192x144mm3, acquired resolution=1.0x1.0x1.5mm3, reconstructed resolution=1.0x1.0x1.0mm3, FLASH flip angle $$$\alpha$$$=8 , scan time=9.7min.
Quantitative parametric fitting and qualitative image synthesis:
Parameters of interest were obtained from a voxel-wise nonlinear fitting following:
$$S_{n}=A\cdot\frac{1-e^{-\frac{TR}{T1}}}{1-e^{\frac{TR}{T1} \cos(\alpha)}}\left[1+\left(Be^{-\frac{\tau}{T2}}e^{-\frac{\tau_{\mathrm{SL}}}{T1{\rho}}}-1\right)\left(e^{-\frac{TR}{T1}}\cos(\alpha)\right)^{n}\right]e^{-\frac{\tau_{E}}{T_{2}^{*}}}e^{j\Delta{B_{0}}\tau_{E}}\sin(\alpha)$$
where $$$A$$$ absorbs proton density (PD) and overall B1 receive field, $$$B$$$ represents the effective inversion efficiency, $$$\Delta{B_{0}}$$$ denotes the main field inhomogeneity. QSM was computed using the 4-echo images of the last FLASH module following 3D phase unwrapping, brain extraction, background field removal, and inverse filter regularization13-14.
Furthermore, 9 qualitative contrast-weighted images including PDw, T1w, T2w, T2*w, FLAIR, SWI, true-SWI (tSWI)15, and maximum intensity projections of SWI/tSWI15 (denoted as mIP/tmIP) were synthesized from the parametric maps using Bloch equations.
Results
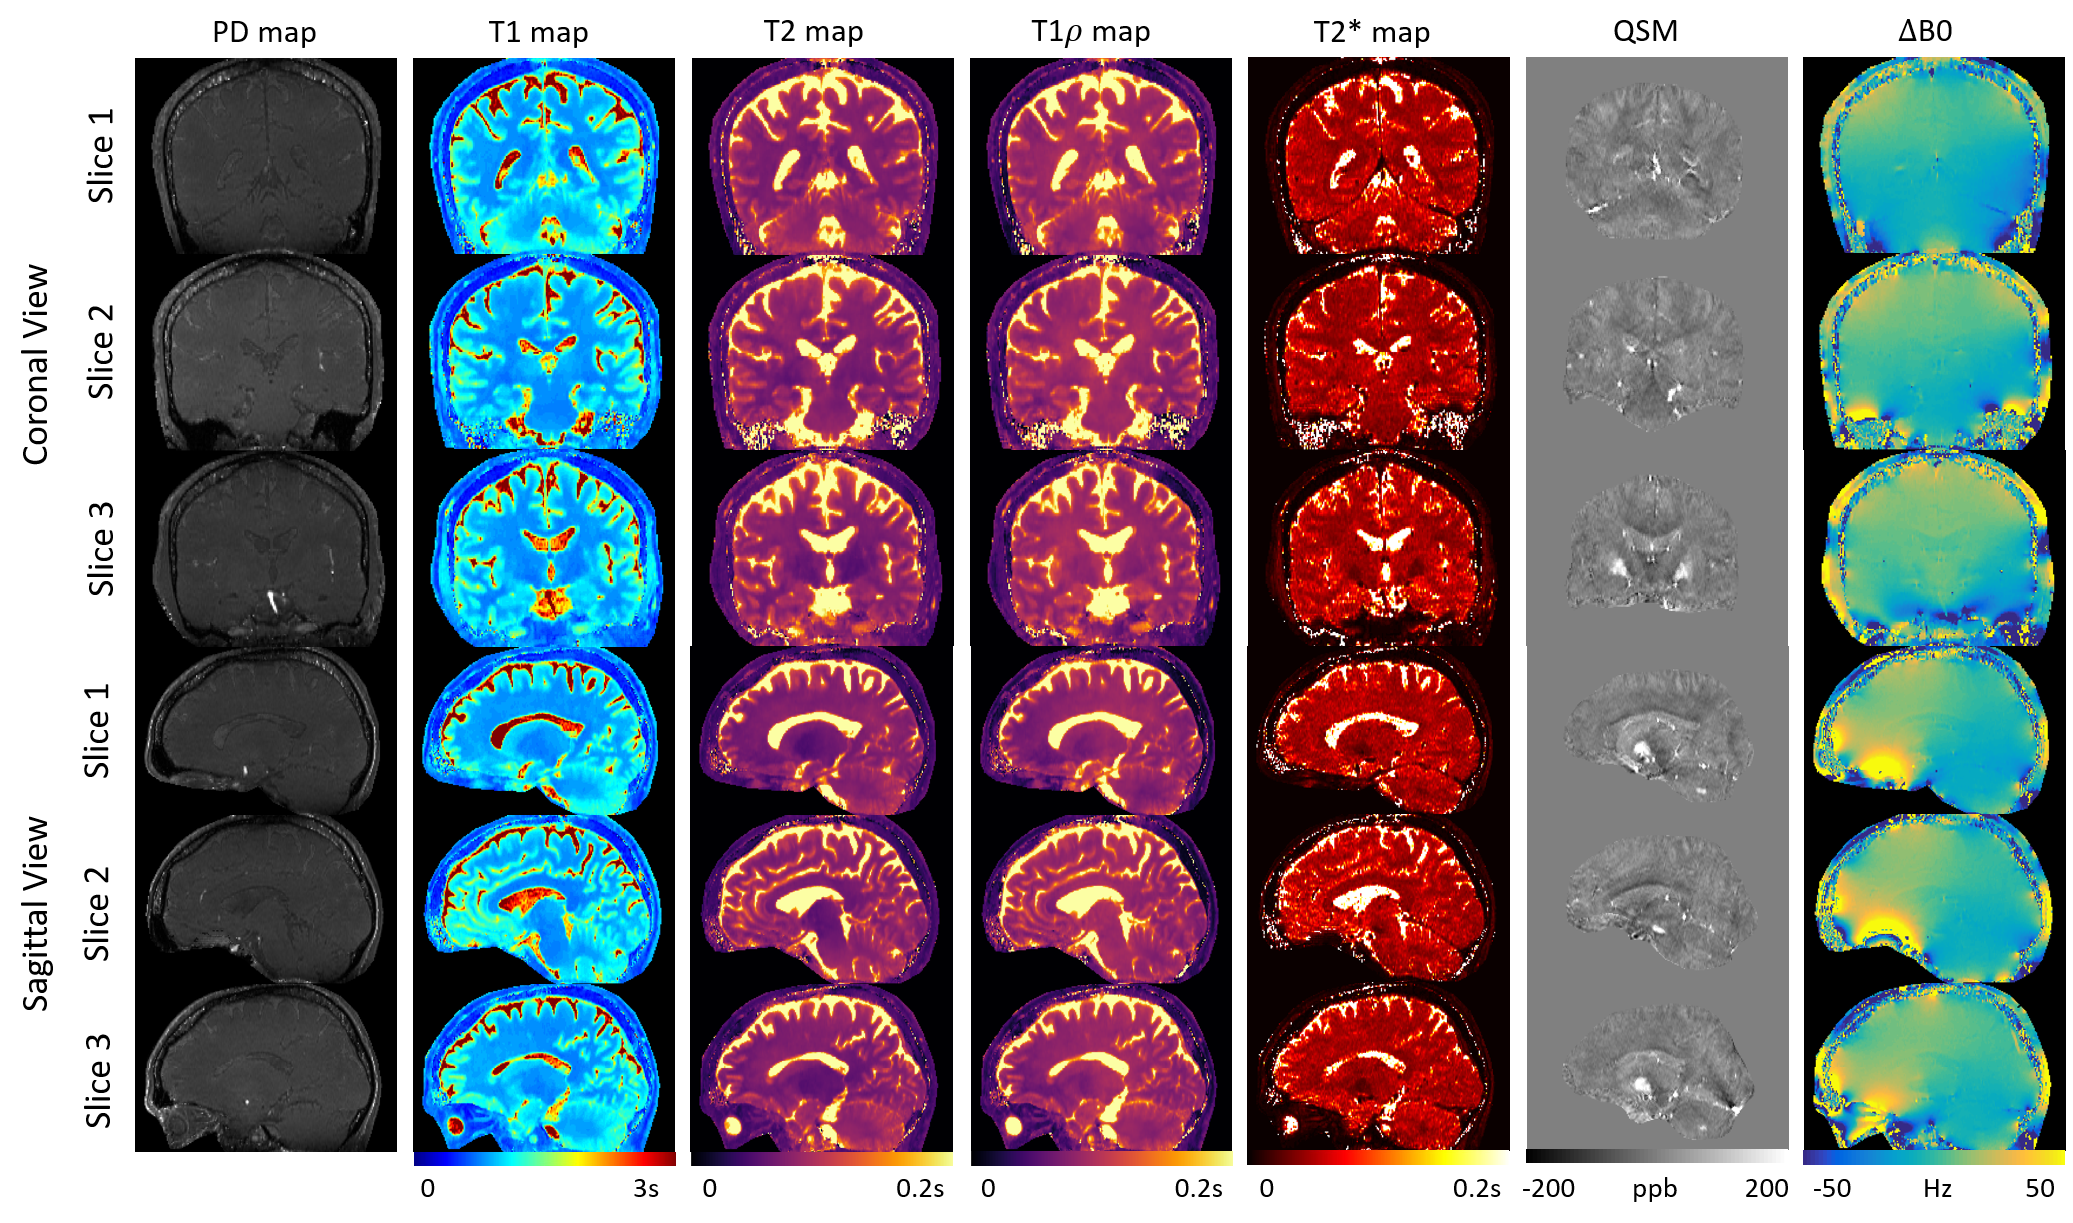
Figure 1 demonstrates the effectiveness of the center-enhanced sampling strategy. In this work, $$$\mathcal{X}$$$ contains 192/2x4x(4+4)=3072 3D image volumes. If center-out sampling and direct FFT reconstruction were used as in conventional IR-FLASH acquisition, only 3.56 3D image volumes would be reconstructed within the same scan time. An effective undersampling factor of 3072/3.56=863 was achieved with which the center-enhanced sampling substantially improved the quality of the parametric maps compared to Gaussian sampling, yielding sharper tissue structure, homogeneous and much less noisy T1/T2/T1$$$\rho$$$/T2* maps.Figure 2 and 3 show 7 quantitative maps in axial, coronal, and sagittal views. These co-registered maps were generated with high image quality. No blurring or artifacts resulting from interpolated resolution (1.0x1.0x1.5mm3 to 1.0x1.0x1.0mm3) was observed. Tissue structures and properties were well-preserved.
Figure 4 show the synthetic contrast-weighted images in axial view, corresponding to the quantitative maps in Figure 2, with good image quality, image contrasts, and clear venous structures. Hyperintense edges were observed on synthetic FLAIR images.
Lastly, T1, T2, T1$$$\rho$$$, T2*, QSM measurements in white matter, cortical gray matter, putamen, thalamus, caudate nucleus, pallidus, substantia nigra, and red nucleus are shown in Table 1. These values agree with literature ranges where available8,16-19.
Discussion
Seven quantitative relaxometry/susceptibility maps and 9 qualitative contrast-weighted images were generated simultaneously with good image quality and co-registration in a 10min scan. Hyperintense signals around CSF and brain vessels were observed on synthetic FLAIR as a known limitation of Bloch synthesis without considering flow and partial volume effects20. However, deep learning approaches are promising for major improvements in image quality without having to reacquire images21.Conclusion
We developed an integrated and efficient solution to clinical whole-brain MRI aiming to provide 7 quantitative relaxometry/susceptibility maps and 9 qualitative contrast-weighted images simultaneously in a single 10min scan with MR Multitasking. All maps and images were generated with good image quality, SNR, and image contrasts. Quantitative measurements agree with literature values. Clinical validations are to be performed in future studies. Further scan time reduction (e.g., 10min to 5min) is possible with deep learning image enhancement.Acknowledgements
This work was supported by NIH 1R01EB028146.References
1. Pierpaoli C. Quantitative brain MRI. Top Magn Reson Imaging. 2010;21(2):63.
2. Inglese M, Ge Y. Quantitative MRI: hidden age-related changes in brain tissue. Top Magn Reson Imaging. 2004;15(6):355-363.
3. Singh P, Kaur R, Saggar K, Singh G, Kaur A. Qualitative and quantitative hippocampal MRI assessments in intractable epilepsy. Biomed Res Int. 2013;2013:480524.
4. Korzdorfer G, Kirsch R, Liu K, Pfeuffer J, Hensel B, Jiang Y, et al. Reproducibility and Repeatability of MR Fingerprinting Relaxometry in the Human Brain. Radiology. 2019;292(2):429-437.
5. Badve C, Yu A, Dastmalchian S, et al. MR Fingerprinting of Adult Brain Tumors: Initial Experience. AJNR Am J Neuroradiol. 2017;38(3):492-499.
6. Hattingen E, Jurcoane A, Daneshvar K, et al. Quantitative T2 mapping of recurrent glioblastoma under bevacizumab improves monitoring for non-enhancing tumor progression and predicts overall survival. Neuro Oncol. 2013;15(10):1395-1404.
7. Lescher S, Jurcoane A, Veit A, Bahr O, Deichmann R, Hattingen E. Quantitative T1 and T2 mapping in recurrent glioblastomas under bevacizumab: earlier detection of tumor progression compared to conventional MRI. Neuroradiology. 2015;57(1):11-20.
8. Ma S, Wang N, Fan Z, Kaisey M, Sicotte NL, Christodoulou AG, et al. Three-Dimensional Whole-Brain Simultaneous T1, T2, and T1$$$\rho$$$ Quantification using MR Multitasking: Method and Initial Clinical Experience in Tissue Characterization of Multiple Sclerosis. Magn Reson Med. 2020; In Press.
9. Christodoulou AG, Shaw JL, Nguyen C, et al. Magnetic resonance multitasking for motion-resolved quantitative cardiovascular imaging. Nat Biomed Eng. 2018;2(4):215-226.
10. Tucker LR. Some mathematical notes on three-mode factor analysis. Psychometrika. 1966;31(3):279-311.
11. He J, Liu Q, Christodoulou A, Ma C, Lam F, Liang Z-P. Accelerated high-dimensional MR imaging with sparse sampling using low-rank tensors. IEEE Trans Med Imaging. 2016;35(9):2119-2129.
12. De Lathauwer L, De Moor B, Vandewalle J. A multilinear singular value decomposition. Siam J Matrix Anal A. 2000;21(4):1253-1278.
13. Schweser F, Deistung A, Lehr BW, Reichenbach JR. Quantitative imaging of intrinsic magnetic tissue properties using MRI signal phase: an approach to in vivo brain iron metabolism? Neuroimage. 2011;54(4):2789-2807.
14. Haacke EM, Tang J, Neelavalli J, Cheng YCN. Susceptibility mapping as a means to visualize veins and quantify oxygen saturation. J Magn Reson Imaging. 2010;32(3):663-676.
15. Liu S, Mok K, Neelavalli J, Cheng YN, Tang J, Ye Y, et al. Improved MR Venography Using Quantitative Susceptibility-Weighted Imaging. J Magn Reson Imaging. 2014;40(3):698-708
16. Gonyea JV, Watts R, Applebee A, et al. In vivo quantitative whole-brain T1$$$\rho$$$ MRI of multiple sclerosis. J Magn Reson Imaging. 2015;42(6):1623-1630.
17. Stanisz GJ, Odrobina EE, Pun J, et al. T1, T2 relaxation and magnetization transfer in tissue at 3T. Magn Reson Med. 2005;54(3):507-512.
18. Wansapura JP, Holland SK, Dunn RS, Ball WS, Jr. NMR relaxation times in the human brain at 3.0 tesla. J Magn Reson Imaging. 1999;9(4):531-538.
19. Ghassaban K, Liu S, Jiang C, Haacke EM. Quantifying iron content in magnetic resonance imaging. Neuroimage. 2019;187:77-92.
20. Tanenbaum LN, Tsiouris AJ, Johnson AN, Naidich TP, DeLano MC, Melhem ER et al. Synthetic MRI for clinical neuroimaging: results of the magnetic resonance image compilation (magic) prospective, multicenter, multireader trial. AJNR Am J Neuroradiol. 2017;38(6):1103-1110
21. Wang G, Gong E, Banerjee S, Martin D, Tong E, Choi J et al. Synthesize High-Quality Multi-Contrast Magnetic Resonance Imaging From Multi-Echo Acquisition Using Multi-Task Deep Generative Model. IEEE Trans Med Imaging. 2020;39(10):3089-3099.
Figures