0099
7T QSM guided Histologically Consistent Thalamic Sub-nucleus Parcellation in 3T QSM Atlas Space1School of Information Science and Technology, ShanghaiTech University, Shanghai, China, 2Department of Radiology, The Second Affiliated Hospital, Zhejiang, China, 3Institute for Medical Imaging Technology, School of Biomedical Engineering, Shanghai, China, 4Shanghai Engineering Research Center of Intelligent Vision and Imaging, ShanghaiTech University, Shanghai, China, 5iHuman Institute, ShanghaiTech University, Shanghai, China
Synopsis
The thalamus is a relay station that routed and modulated brain signals from the deep gray-matter to the cortex. It can be divided into sub-nuclei that are highly related to various neurological disorders. However, those sub-nuclei are indistinguishable in standard T1 or T2 weighted MRI. We present a multi-atlas thalamic sub-nucleus parcellation framework guided by 7T QSM image, which provides histologically consistent contrast in thalamic sub-nuclei. Combining with a set of 3T QSM images, the thalamic parcellation in 7T image space is transferred into the 3T atlas space as a 64 sub-nucleus parcellation map.
INTRODUCTION
The thalamus consists of two large bilaterally symmetrical nuclei located anterior and superior to the midbrain on both sides of the midline. A specific, important focus for investigating the thalamus is that nearly all incoming information to the cortex is routed and modulated through this deep gray-matter structure1. Various neurological disorders (e.g., Alzheimer's disease (AD), multiple sclerosis (MS), and Parkinson's disease (PD)) are reported to be highly related to this essential brain structure. The thalamus comprises a lamellae system (made up of myelinated fibers) that separate different thalamic iron-rich nuclei. Boundaries between thalamic nuclei that can be visualized histologically are not visible on T1 or T2 weighted MRI. Quantitative susceptibility mapping (QSM) provides a non-invasive and spatially specific contrast sensitive to the variation of iron and myelin concentrations in the human brain. High-resolution QSM brain image exhibits superb contrast that allows histologically consistent identification of substructures within the thalamus. To this end, we present a multi-atlas label fusion framework to delineate a total number of 64 thalamic nuclei using both 7T and 3T QSM images. The 7T high-resolution QSM provides clear delineation for segmenting distinct thalamic nuclei. Meanwhile, the 3T QSM is used as a pathway to lead the high-resolution thalamic parcellation into the standard atlas space. By combining precise and dedicated group-wise registration, label propagation, and label fusion processes, we achieve a 64 thalamic nuclei parcellation map in 3T QSM atlas space.Methods
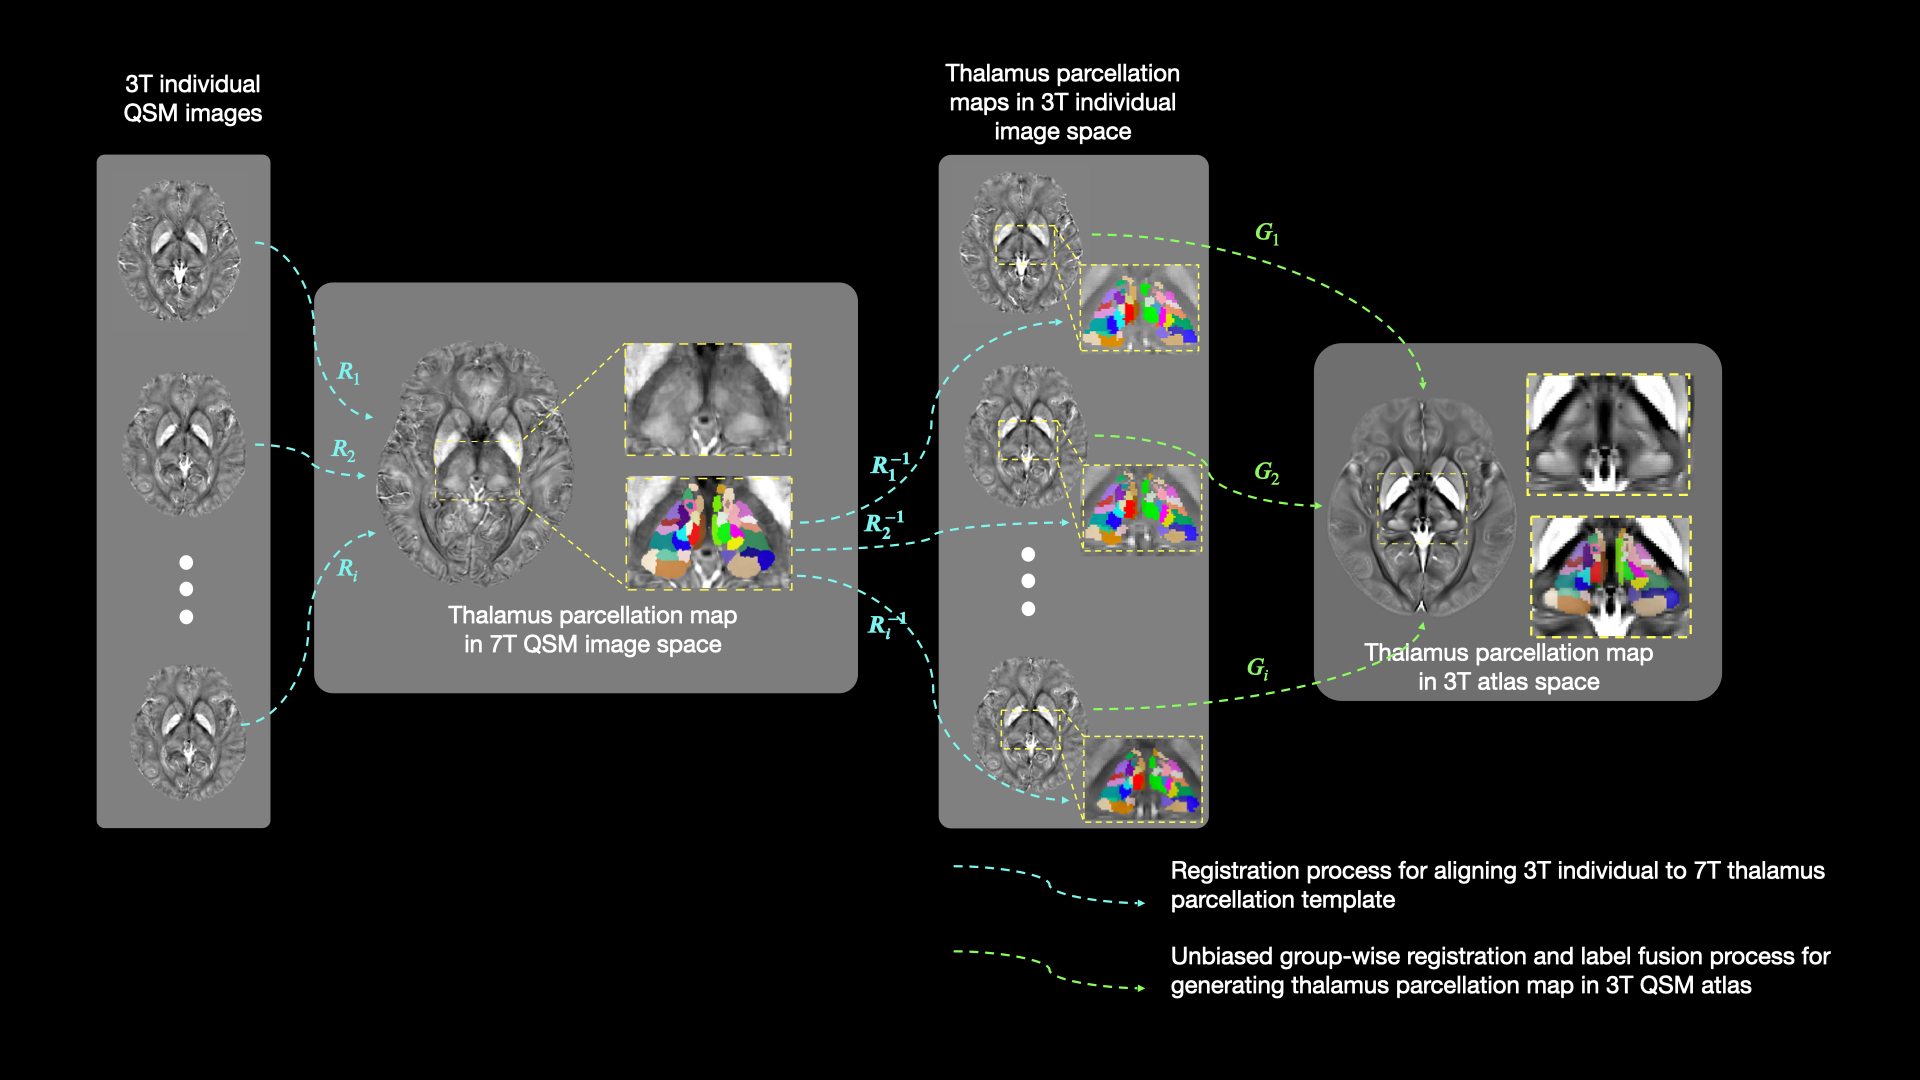
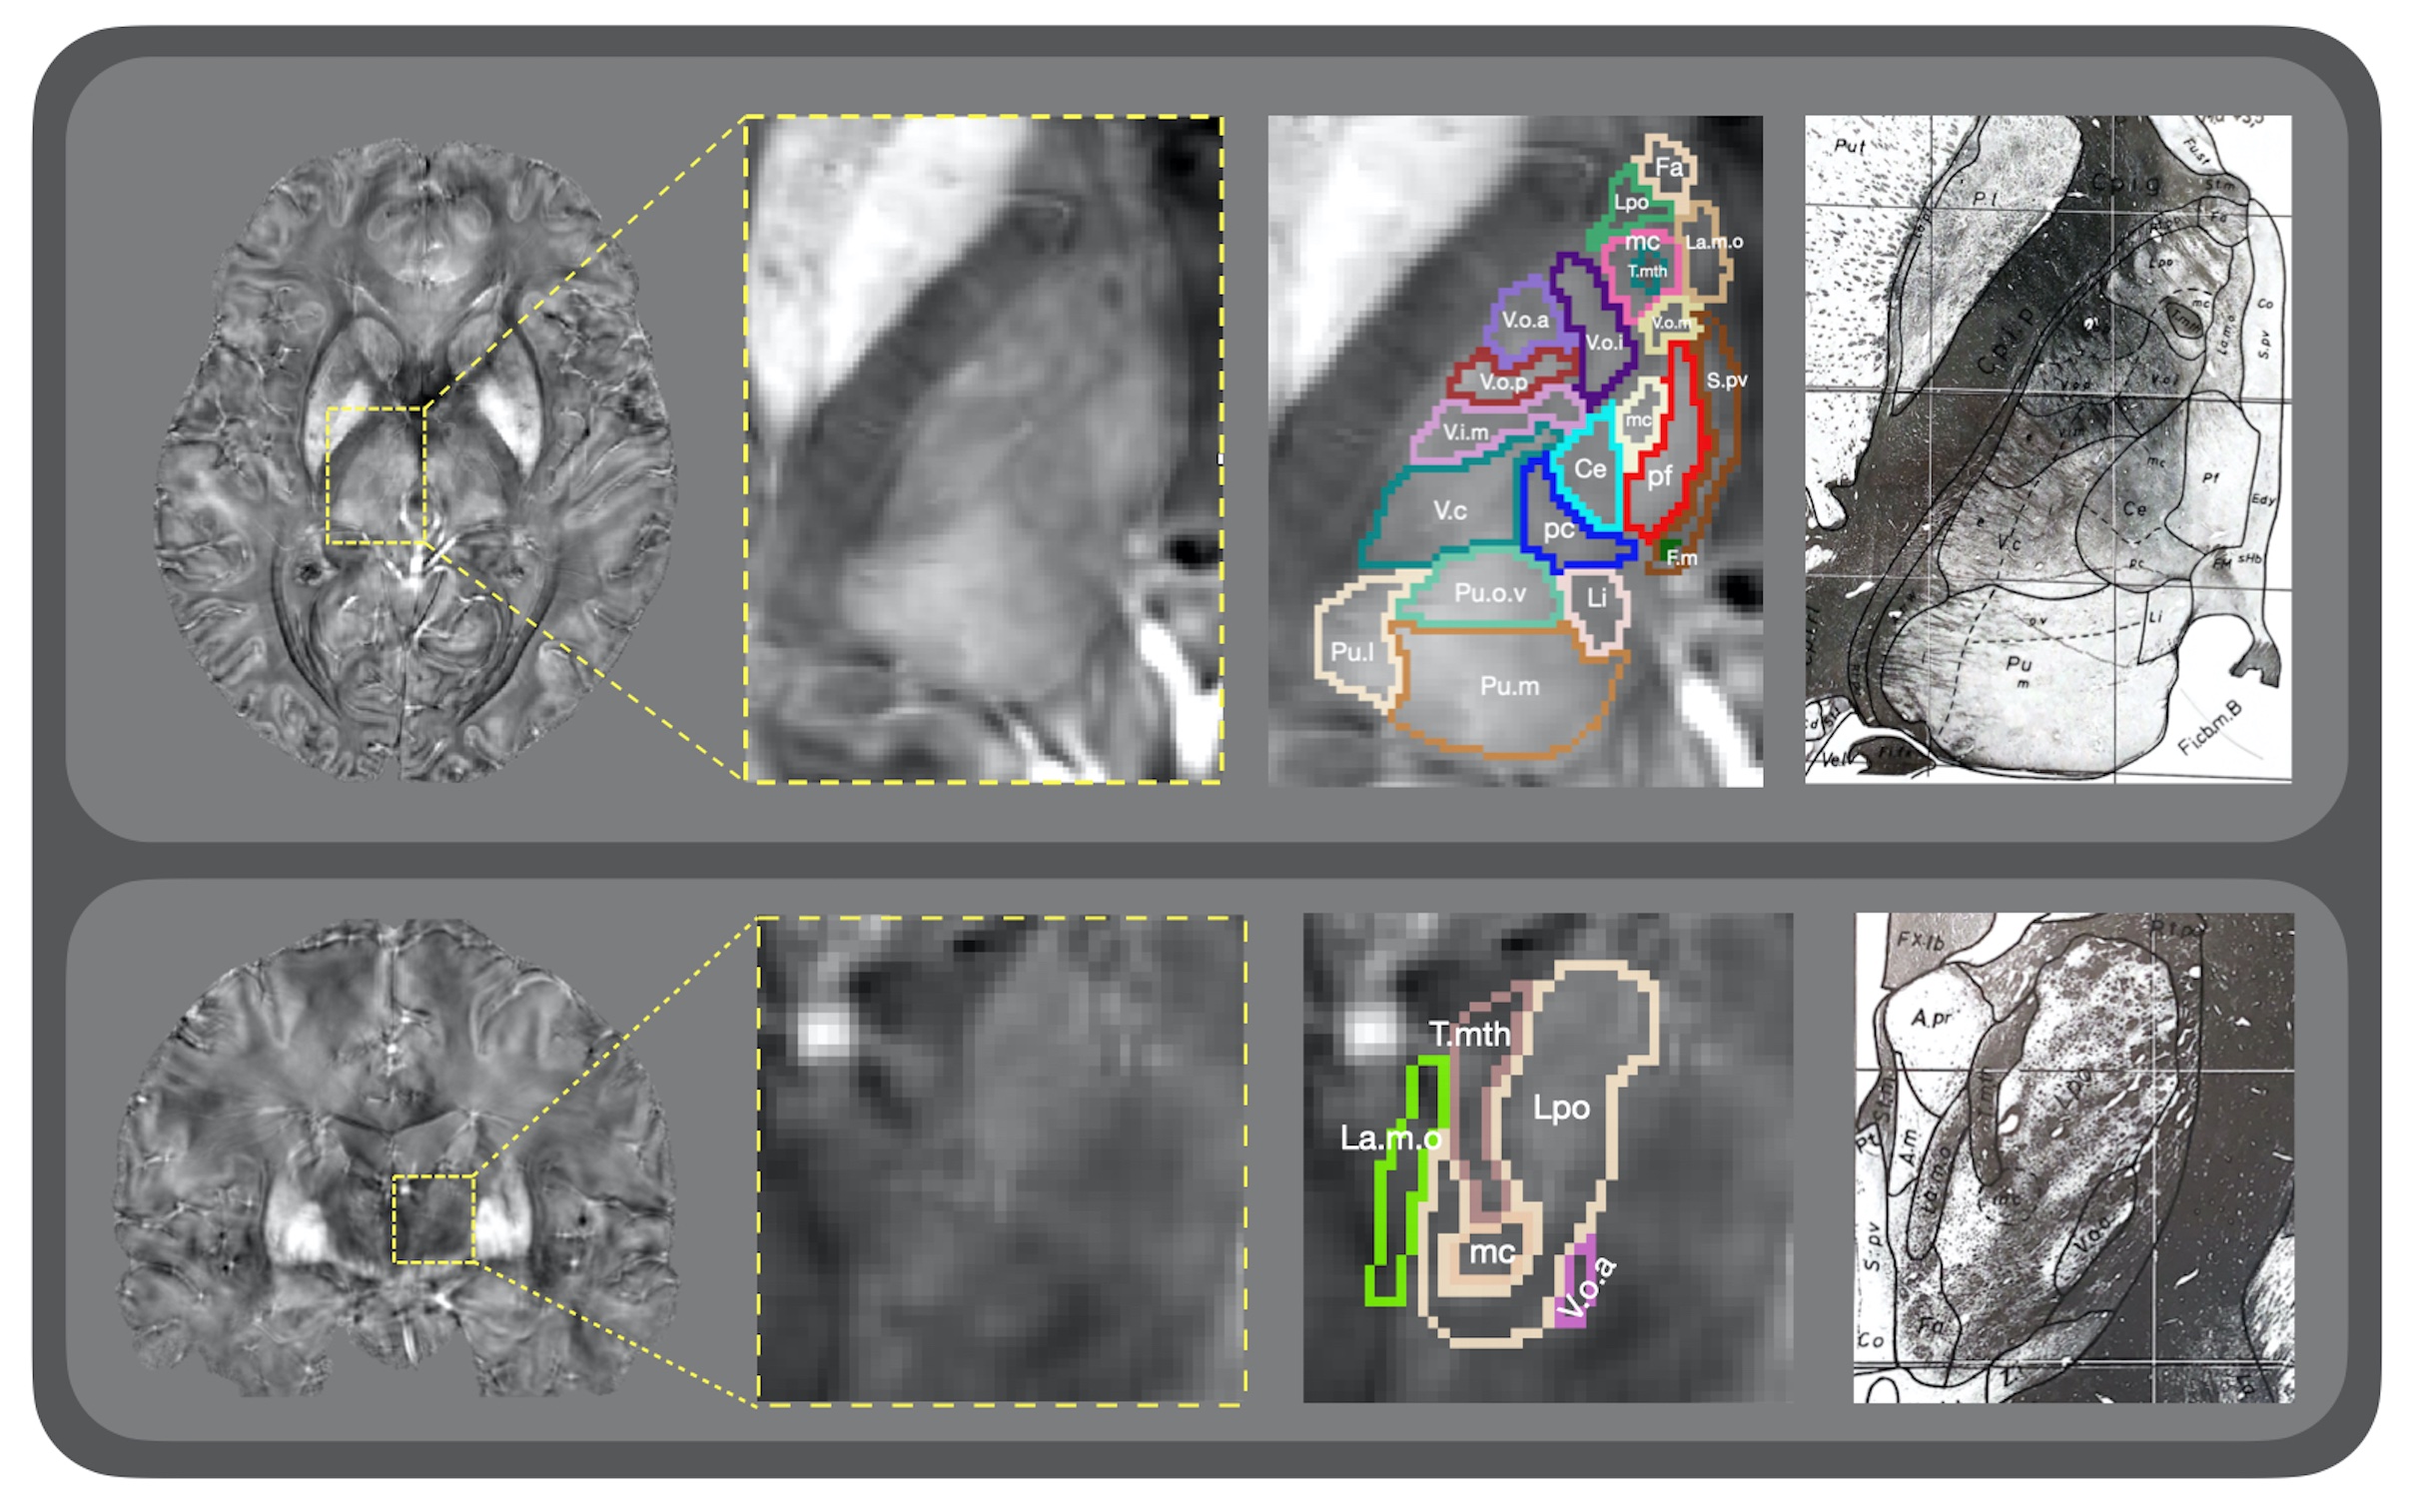
Data acquisition: 1) The high-resolution QSM was scanned on a 7.0-Tesla MRI scanner using a multi-echo GRE sequence (TE1/spacing/TE4=5/7.8/28.4 ms, TR=34 ms, FA=8°, BW=160 Hz/px, matrix= 576×414×256, resolution 0.4×0.4×0.4 mm3). 2) 96 healthy volunteers were scanned using a 3.0-Tesla MRI scanner for acquiring QSM images with 1×1×1 mm3 resolution. The raw phase was processed by Laplacian-based phase unwrapping and V-SHARP background phase removal. QSM maps were reconstructed using a two-level STAR-QSM algorithm2.Thalamic sub-nucleus parcellation map construction: 1) As illustrated in Fig. 1, we manually annotated each lateral of the thalamus into 32 thalamic nuclei on the 0.4×0.4×0.4 mm3 7T QSM image using the Schaltenbrand and Wahren histology atlas3 as reference. After this, the 96 3T QSM images were carefully registered to the single-subject high resolution 7T QSM image. We then applied each of the inverted deformation fields to the thalamic sub-nucleus parcellation map. It propagates the single-subject parcellation map into the individual 3T QSM image space. The 7T thalamic nuclei segmentation was generalized into 96 individual 3T image spaces to compensate for the single subject bias. 2) A group-wise registration method was applied on the 96 images to generate a 3T brain atlas space using Advanced Normalization Tools (ANTs)4. As shown in Fig. 1, we applied deformation fields from the individual image space to the 3T atlas space, resulting in a QSM image template. Based on the deformation fields fielded from QSM atlas construction, joint label fusion method5 was then performed on each individual thalamic parcellation map. The label fusion conducted a weighted label voting by minimizing correlated label error, averaging out of random errors in both the source labels and the registration process. Finally, the 96 individual thalamic sub-nucleus parcellation maps were fused to form a 64-ROI thalamic parcellation in 3T atlas space.
RESULTS
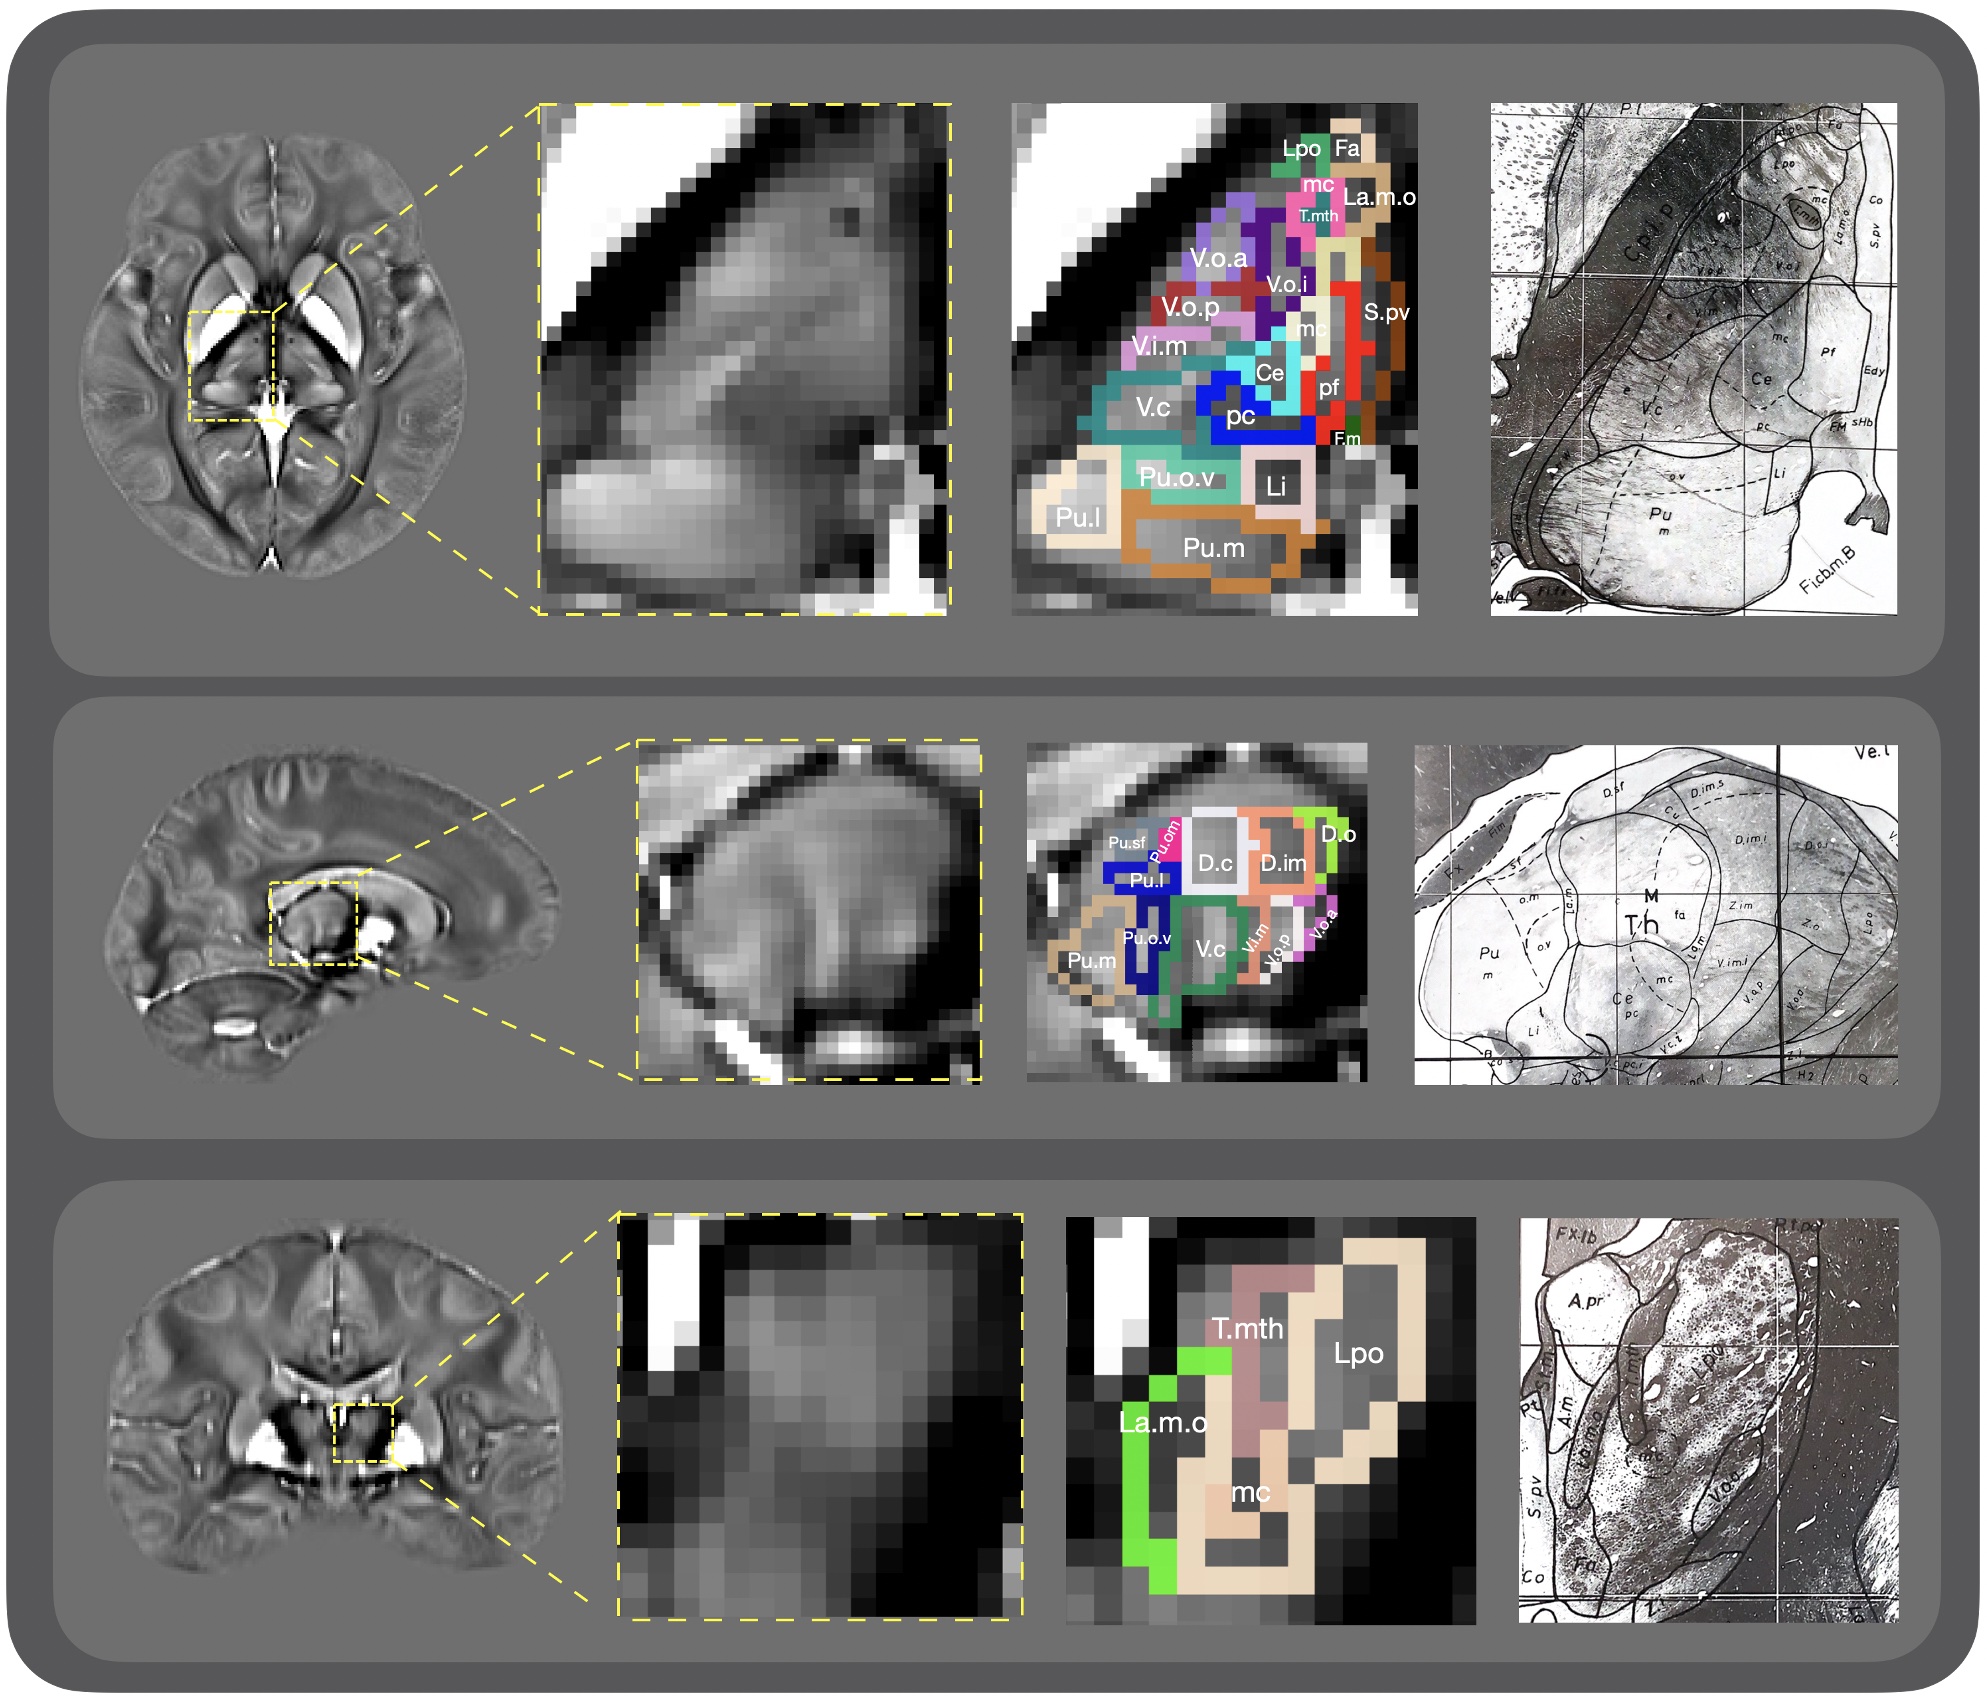
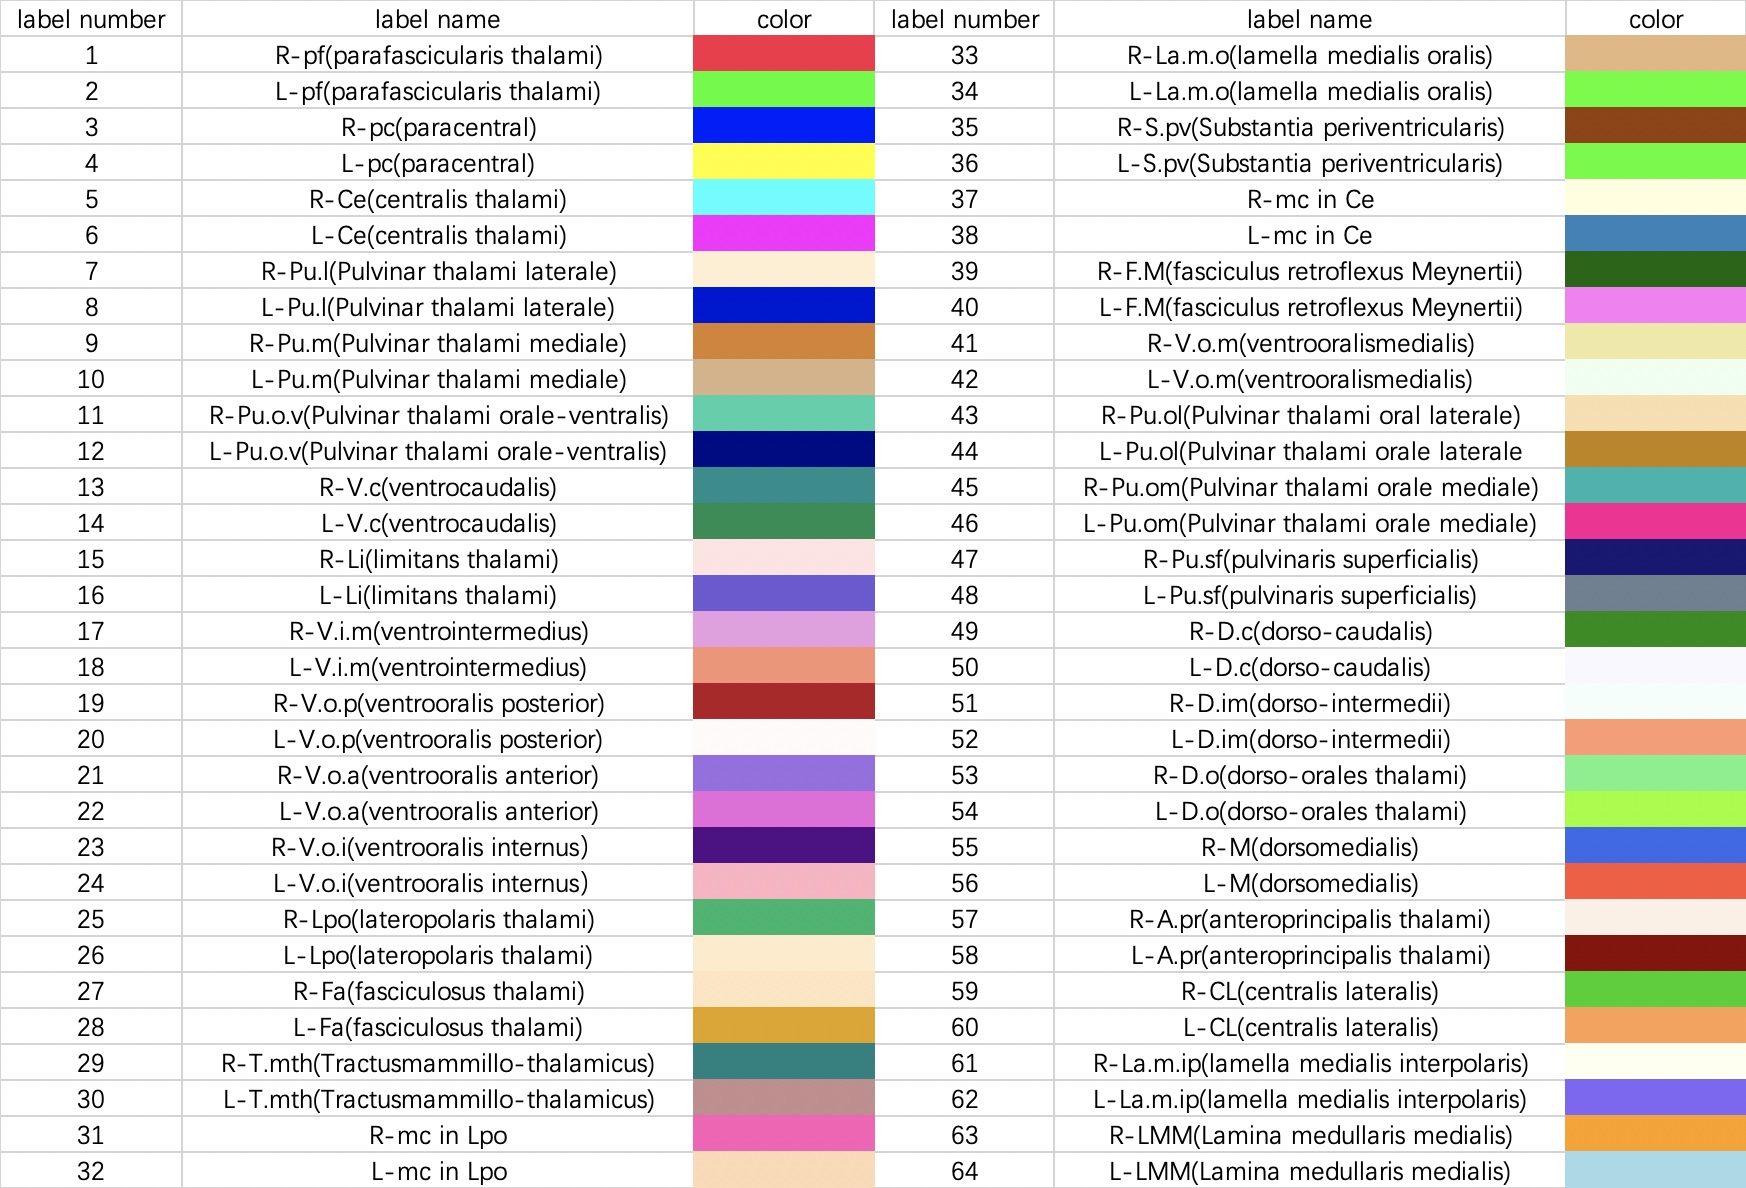
Fig.2 shows the axial and coronal view of the manually annotated thalamic sub-nucleus parcellation map overlaid on a high-resolution (7 T) QSM image, with the histology reference shown on the right side. The 0.4×0.4×0.4 mm3 7 T QSM image provided clear contrast among thalamic sub-nuclei for annotation. Table 1 presents the list of the total 64 thalamic sub-nuclei and the corresponding color codes. Fig. 3 illustrates representative slices of the 3T QSM atlas with a fused parcellation map overlaid on the top. And the histology reference is exhibited on the right side.Discussion and conclusion
This work leveraged the advantage of the clear contrast of the high-field (7 Tesla) QSM image in intra-thalamic nuclei, manually constructed a histologically consistent thalamic parcellation map in the 7T image space. By carefully transforming the thalamic labels into individual 3T space and generating an unbiased 3T brain atlas, a total number of 64 thalamic nuclei are projected into the atlas space. We then conducted the joint label fusion method to construct the histologically consistent thalamic sub-nucleus parcellation map in the proposed 3T QSM atlas space. In the final parcellation map, we can precisely identify crucial thalamic sub-nuclei such as the Ventrointermedius (V.i.m., highly related to PD), Dorsomedialis (M, related to schizophrenics), Anteroprincipalis (A.pr, a vital component of the hippocampal system for episodic memory). It is envisioned that the proposed standard space thalamic parcellation map can be a powerful tool for understanding related neurological disease progression and guiding deep brain disease treatments.Acknowledgements
I would like to express my gratitude to all those who helped me with this thesis. My deepest gratitude goes to Professor Zhang, my supervisor, for her constant guidance. I am also grateful to my fellow students who listen to my problems and give me assistance.
References
1. Iglesias JE, Insausti R, Lerma-Usabiaga G, et al. A probabilistic atlas of the human thalamic nuclei combining ex vivo MRI and histology. Neuroimage. 2018;183:314–26.
2. Wei H, Dibb R, Zhou Y, et al. Streaking artifact reduction for quantitative susceptibility mapping of sources with large dynamic range. NMR in Biomedicine. 2015; 10:1294-303.
3. Schaltenbrand G, Wahren W. Atlas for stereotaxy of the human brain: with an accompanying guide Architectonic organization of the thalamic nuclei by Rolf Hassler 2, rev and enlarged ed. Stuttgart: Thieme. 1977.
4. Avants Brian B, Yushkevich P, Pluta J, et al. The optimal template effect in hippocampus studies of diseased populations. Neuroimage. 2010;49(3):2457-2466.
5. Wang, H., Suh, J.W., Das, S.R., et al. Multi-atlas segmentation with joint label fusion. IEEE Trans. Pattern Anal. Mach. Intell. 2013;35(3):611–623.
Figures