0098
Combined blood flow and CO2-mediated effects underlie the tissue-specific response to hypercapnia: Insight from 7T MR-based imaging1School of Medicine, Queen's University, Kingston, ON, Canada, 2Center for Neuroscience Studies, Queen's University, Kingston, ON, Canada, 3Radiology, University Medical Center Utrecht, Utrecht, Netherlands
Synopsis
Cerebrovascular reactivity (CVR) mapping is finding increasing clinical applications as a non-invasive probe for vascular health. Untangling physiological factors driving differences in temporal delays within the tissue-specific CVR response can help better understand the pathophysiological mechanisms associated with vascular impairments. Here, we combine hypercapnic and hyperoxic respiratory challenges with high resolution 7T MR-based imaging to gather insight about differences in the temporal response to CVR between grey- and white-matter tissues. Our findings support the hypothesis that differences in the physiological response to hypercapnia may be determined by compounding effects related to CO2 sensitivity and blood flow (re)distribution.
BACKGROUND
Cerebrovascular reactivity (CVR) describes the response of cerebral blood vessels to vasodilatory stimuli (1, 2). CVR mapping has emerged as a robust clinical tool to reveal vascular (patho)physiology (3–10), leveraging non-invasive gas-based respiratory challenges that stress the cerebral vasculature (i.e., hypercapnia; HC), as well as endogenous contrast agents via O2-mediated changes in deoxyhemoglobin (hyperoxia; HO; (11, 12)).In recent years, more advanced post-processing analyses have emerged to characterize temporal markers associated with the CVR response (11, 13–18). These reflect a mixture of physiological properties including arterial transit time, blood flow (re)distribution, and vascular response speed. Untangling these factors can help to better understand the pathophysiology and improve diagnosis/prognosis associated with vascular impairments (13).
In this study, high spatial-resolution BOLD datasets were acquired at 7T using both BLOCK- and RAMP-hypercapnic (HC) paradigms to study differences in CVR delays induced via abrupt and progressive changes in CO2, respectively. In contrast to the block-based design, which evokes a dynamic CVR response (19), the RAMP-HC stimulus involves a gradual increase in PETCO2, which allows for more progressive changes in arterial CO2 (20–23). Progressive stimuli are hypothesized to minimizing blood flow redistribution effects implying that the slower arteriolar reactivity during RAMP-HC may lead to shorter CVR delays. Finally, a novel protocol using a combined HC and hyperoxia (HO) block was also implemented, in order to assess the effect of bolus arrival time on tissue-based CVR delays, in contrast to CO2 sensitivity/blood flow effects.
METHODS
BOLD datasets were acquired in seven healthy subjects (M/F, 4/3; age, 29 ± 6 years) throughout BLOCK- and RAMP-HC paradigms, as well as the combined HC + HO block (defined as: “BOOST HC+HO”). Informed and consented participants were scanned on a Philips 7 Tesla MRI system using a dual channel transmit coil in combination with a 32-channel receive coil and a mutli-slice single-shot GE-EPI BOLD sequence (flip angle: 90°, TR/TE 3000/25 ms, reconstructed resolution: 1.5x1.5 mm2, slice-thickness: 1.6 mm, no slice gap, slices: 43).Respiratory challenges were delivered using a 3rd generation RespirActTM (Thornhill Research Inc., Toronto, ON, Canada) system in combination with a rebreathing face mask. The BLOCK-HC protocol consisted of a 90s increase in hypercapnia, preceded and followed by a pre- and post-baseline period (120s). In the case of the combined BLOCK BOOST HC+HO experiment, a simultaneous increase in arterial O2 was implemented during the boxcar design. The progressive CO2 protocol (i.e., RAMP-HC) consisted of a baseline period followed by a 60s hypocapnic period, and a subsequent 5-minute period of progressively increasing hypercapnia, ending with a return to baseline.
Following standard preprocessing of the BOLD datasets (24, 25), tissue-based differences in CVR lag times computed using the Rapid Interpolation at Progressive Time Delay (RIPTiDe; (26, 27)) method were compared across stimulus paradigms to explore dynamic (BLOCK-HC) versus progressive (RAMP-HC) changes in CO2, as well as the effect of bolus arrival time on CVR delays (BLOCK-HC versus BOOST).
RESULTS/DISCUSSION
While GM delays were similar between the BLOCK- and RAMP-HC (within ± 2 seconds), longer WM lag times were observed during the RAMP-HC. Contrary to our initial hypothesis, this suggests that the progressive stimulus may predispose WM vasculature to longer delays, (i.e., a slower CVR response; Figure 1, 2). This may be explained by the of the smaller arterial content of CO2 that is delivered progressively to WM tissues during the RAMP, which in turn, decreases intravascular CO2 gradients modulating CO2 diffusion into tissues. This effect could be exacerbated by a redistribution of blood towards the GM compartments that seem to respond in step with the progressive stimulus; thus, effecting a greater reduction in peripheral resistance than the WM compartments supplied in parallel. In other words, the delayed gaseous gradient represents a reduced driving force pushing the diffusion of CO2 towards the tissue compartment, which in turn, delays the vasodilatory response. This was supported by a maintained ~10 s offset in GM versus WM BOOST-delays with respect to the BLOCK-HC (Figure 1, 2), suggesting that the vasoactive effect of CO2 remained constant and that shortening of BOOST delays was driven by blood arrival reflected through the non-vasodilatory endogenous O2 contrast agent (from the induced HO).CONCLUSION
In this study, we conducted a comprehensive analysis of the response to respiratory gas challenges in GM and WM tissues at 7T, as a way to advance our understanding of the effects that drive temporal delays in the BOLD-CVR response of healthy tissues. Our findings support that differences in temporal and magnitude aspects of CVR between vascular networks reflect the culminative effect of CO2 sensitivity (and/or CO2 diffusion rate) in local vessels, in addition to redistribution and steal effects of blood flow within and across tissues, as previously described (11, 17). Moreover, these results suggest that the addition of a BLOCK-BOOST HC+HO paradigm within clinical settings can provide insights into whether diseases causing changes in CVR do so by way of severe blood flow redistribution (which would increase blood arrival time and inflate BLOCK-BOOST HC+HO delays), or alterations in vascular properties within the vessels that could impair CO2 diffusion across WM tissues (this would significantly increase the marginal gap in relative delay estimates between BLOCK-HC and BLOCK-BOOST HC+HO).Acknowledgements
The authors would like to acknowledge collaborational support from Dr. H. Hoogduin, Dr. M.E.P Philipens, Dr. J.C.W. Siero from the University Medical Center Utrecht in the Netherlands, as well as Dr. N.S. Coverdale and Dr. D.J. Cook from Queen’s University in Kingston, Canada.References
1. Liu P, B. De Vis J, Lu H: Cerebrovascular reactivity (CVR) MRI with CO2 challenge: A technical review. Neuroimage 2018(March):1–12.
2. Fisher JA, Venkatraghavan L, Mikulis DJ: Magnetic Resonance Imaging–Based Cerebrovascular Reactivity and Hemodynamic Reserve. Stroke 2018:STROKEAHA.118.021012.
3. Geranmayeh F, Wise RJS, Leech R, Murphy K: Measuring vascular reactivity with breath-holds after stroke: A method to aid interpretation of group-level BOLD signal changes in longitudinal fMRI studies. Hum Brain Mapp 2015; 36:1755–1771.
4. Conklin J, Fierstra J, Crawley AP, et al.: Impaired Cerebrovascular Reactivity With Steal Phenomenon Is Associated With Increased Diffusion in White Matter of Patients With Moyamoya Disease John. 2010:1610–1617.
5. Mandell DM, Han JS, Poublanc J, et al.: Mapping cerebrovascular reactivity using blood oxygen level-dependent MRI in patients with arterial steno-occlusive disease: Comparison with arterial spin labeling MRI. Stroke 2008; 39:2021–2028.
6. Ellis MJ, Ryner LN, Sobczyk O, et al.: Neuroimaging Assessment of Cerebrovascular Reactivity in Concussion: Current Concepts, Methodological Considerations, and Review of the Literature. Front Neurol 2016; 7(April):1–16.
7. Len TK, Neary JP, Asmundson GJG, Goodman DG, Bjornson B, Bhambhani YN: Cerebrovascular reactivity impairment after sport-induced concussion. Med Sci Sports Exerc 2011; 43:2241–2248.
8. Champagne AA, Coverdale NS, Fernandez-Ruiz J, Mark CI, Cook DJ: Compromised resting cerebral metabolism after sport-related concussion: A calibrated MRI study. Brain Imaging Behav 2020.
9. De Vis JB, Hendrikse J, Bhogal A, Adams A, Kappelle LJ, Petersen ET: Age-related changes in brain hemodynamics; A calibrated MRI study. Hum Brain Mapp 2015; 36:3973–3987.
10. Bhogal AA, Vis JB De, Siero JCW, et al.: The BOLD cerebrovascular reactivity response to progressive hypercapnia in young and elderly. Neuroimage 2016; 139:94–102.
11. Champagne AA, Bhogal AA, Coverdale NS, Mark CI, Cook DJ: A novel perspective to calibrate temporal delays in cerebrovascular reactivity using hypercapnic and hyperoxic respiratory challenges. Neuroimage 2019; 187.
12. Blockley NP, Griffeth VEM, Germuska MA, Bulte DP, Buxton RB: An analysis of the use of hyperoxia for measuring venous cerebral blood volume: Comparison of the existing method with a new analysis approach. Neuroimage 2013; 72:33–40.
13. Donahue MJ, Strother MK, Lindsey KP, Hocke LM, Tong Y, deB Frederick B: Time delay processing of hypercapnic fMRI allows quantitative parameterization of cerebrovascular reactivity and blood flow delays. J Cereb Blood Flow Metab 2016; 36:1767–79.
14. Poublanc J, Crawley AP, Sobczyk O, et al.: Measuring cerebrovascular reactivity: the dynamic response to a step hypercapnic stimulus. J Cereb Blood Flow Metab 2015(April):1–11.
15. Duffin J, Sobczyk O, Crawley AP, Poublanc J, Mikulis DJ, Fisher JA: The dynamics of cerebrovascular reactivity shown with transfer function analysis. Neuroimage 2015; 114:207–216.
16. van Niftrik CHB, Piccirelli M, Bozinov O, et al.: Iterative analysis of cerebrovascular reactivity dynamic response by temporal decomposition. Brain Behav 2017; 7.
17. Thomas BP, Liu P, Park DC, van Osch MJP, Lu H: Cerebrovascular reactivity in the brain white matter: magnitude, temporal characteristics, and age effects. J Cereb Blood Flow Metab 2014; 34:242–7.
18. Donahue MJ, Faraco CC, Strother MK, et al.: Bolus arrival time and cerebral blood flow responses to hypercarbia. J Cereb Blood Flow Metab 2014; 34:1243–52.
19. van der Zande FH, Hofman PA, Backes WH: Mapping hypercapnia-induced cerebrovascular reactivity using BOLD MRI. Neuroradiology 2005; 47:114–120.
20. Battisti-Charbonney A, Fisher J, Duffin J: The cerebrovascular response to carbon dioxide in humans. J Physiol2011; 589(Pt 12):3039–48.
21. Claassen JAHR, Zhang R, Fu Q, Witkowski S, Levine BD: Transcranial Doppler estimation of cerebral blood flow and cerebrovascular conductance during modified rebreathing. J Appl Physiol 2006; 102:870–877.
22. Ringelstein EB, Sievers C, Ecker S, Schneider P a., Otis SM: Noninvasive assessment of CO2-induced cerebral vasomotor response in normal individuals and patients with internal carotid artery occlusions. Stroke 1988; 19:963–969.
23. Bhogal AA, Siero JCW, Fisher JA, et al.: NeuroImage Investigating the non-linearity of the BOLD cerebrovascular reactivity response to targeted hypo / hypercapnia at 7 T. 2014; 98:296–305.
24. Cox R: AFNI : Software for Analysis and Visualization of Functional Magnetic Resonance Neuroimages. Comput Biomed Res 1996; 29:162–173.
25. Jenkinson M, Beckmann CF, Behrens TEJ, Woolrich MW, Smith SM: Fsl. Neuroimage 2012; 62:782–790.
26. Tong Y, Frederick B de B: Concurrent fNIRS and fMRI processing allows independent visualization of the propagation of pressure waves and bulk blood flow in the cerebral vasculature. Neuroimage 2012; 61:1419–1427.
27. Frederick B deB, Nickerson LD, Tong Y: Physiological denoising of BOLD fMRI data using Regressor Interpolation at Progressive Time Delays (RIPTiDe) processing of concurrent fMRI and near-infrared spectroscopy (NIRS). Neuroimage 2012; 60:1913–1923.
Figures
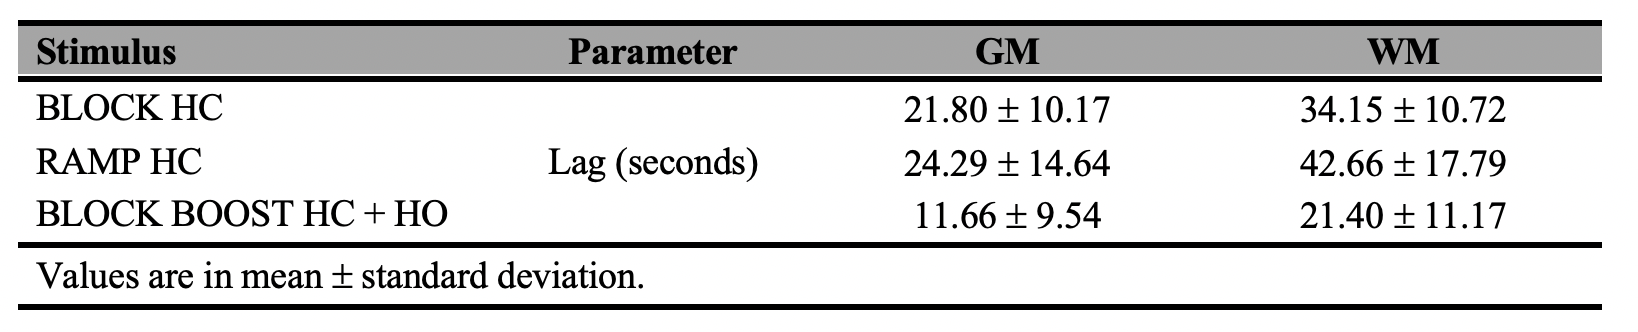
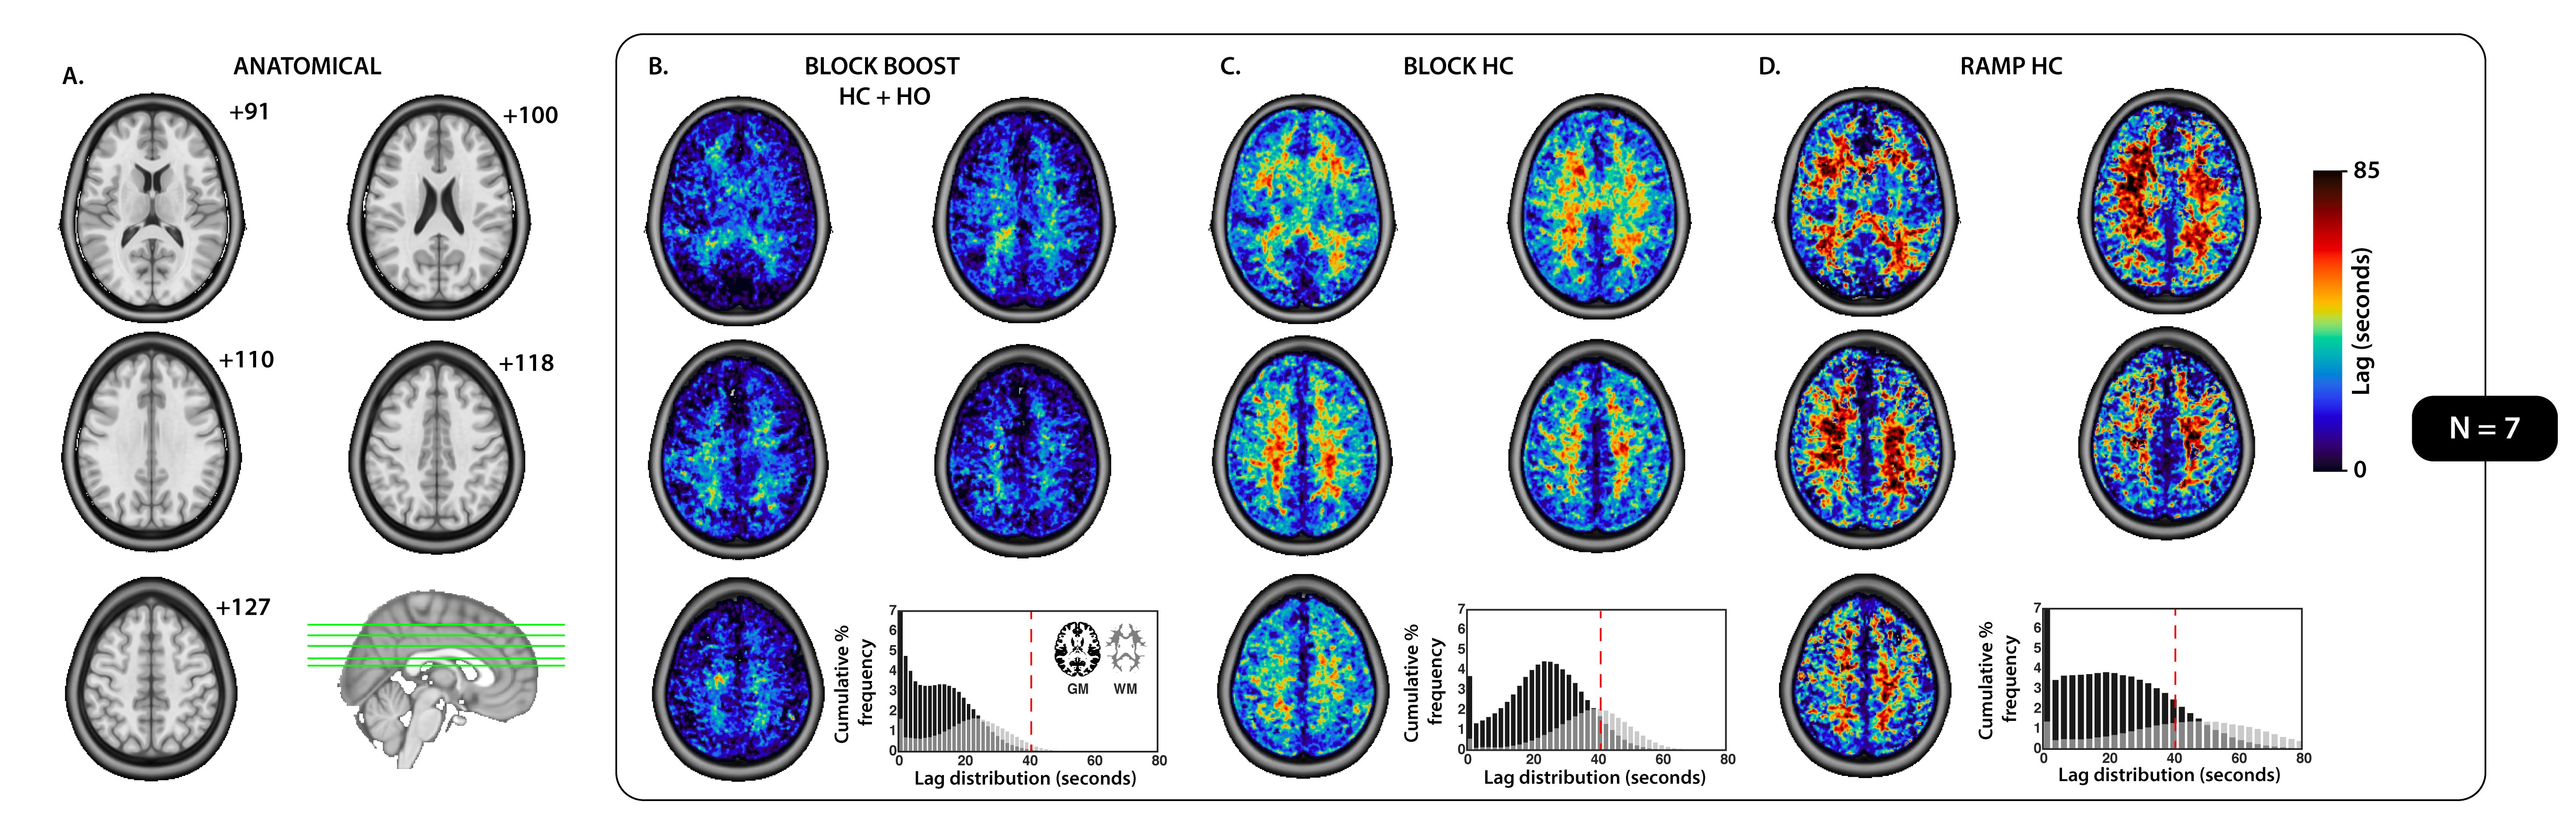
Figure 2. Tissue-based distribution of lag parameters for each respiratory design
(A) Refence anatomical axial slices in MNI space. (B-D) Averaged lag maps (seconds). The cumulative percent frequency (normalized to 100%) for the distribution of lag (seconds) is shown for each tissue which was extracted using the grey- (black) and white- (grey) matter mask displayed in (B), bottom right corner. A dotted red line was added to each histogram (B-D) at 40 seconds, for reference and comparison.