0096
In vivo human T2* imaging at 0.35 mm reveals up to 15 ms of local variations within gray matter across depths at 7T1Department of Cognitive Neuroscience , Faculty of Psychology and Neuroscience, Maastricht University, Maastricht, Netherlands, 2Brain Innovation, Maastricht, Netherlands, 3Centre for Advanced Imaging, The University of Queensland, Brisbane, Australia, 4Center for Magnetic Resonance Research, University of Minnesota, Minneapolis, MN, United States
Synopsis
We measured in vivo human brain T2* values using 7T MRI at 0.35 × 0.35 × 0.35 mm3. We simultaneously targeted calcarine sulcus and Heschl’s gyrus. Our results show that gray matter T2* varies up to 15 ms (global range being mostly in between 25-45 ms) from deep to superficial layers. The stria of Gennari shows up as a major reduction of T2* within calcarine sulcus. However, a similar layering is not visible within Heschl’s gyrus. B0 alignment effects seem to be not as strong as the biological tissue composition effects that are observed across the visual and auditory regions.
Purpose
We measured in vivo human brain T2* values using 7T MRI at 0.35×0.35×0.35 mm3. We simultaneously targeted the calcarine sulcus and Heschl’s gyrus. Our results show that gray matter T2* varies up to 15 ms (global range being mostly in between 25-45 ms) from deep to superficial layers. The stria of Gennari shows up as a major reduction of T2* within calcarine sulcus. However, a similar layering is not visible within Heschl’s gyrus. B0 alignment effects seem to be not as strong as the biological tissue composition effects that are observed across the visual and auditory regions.Methods
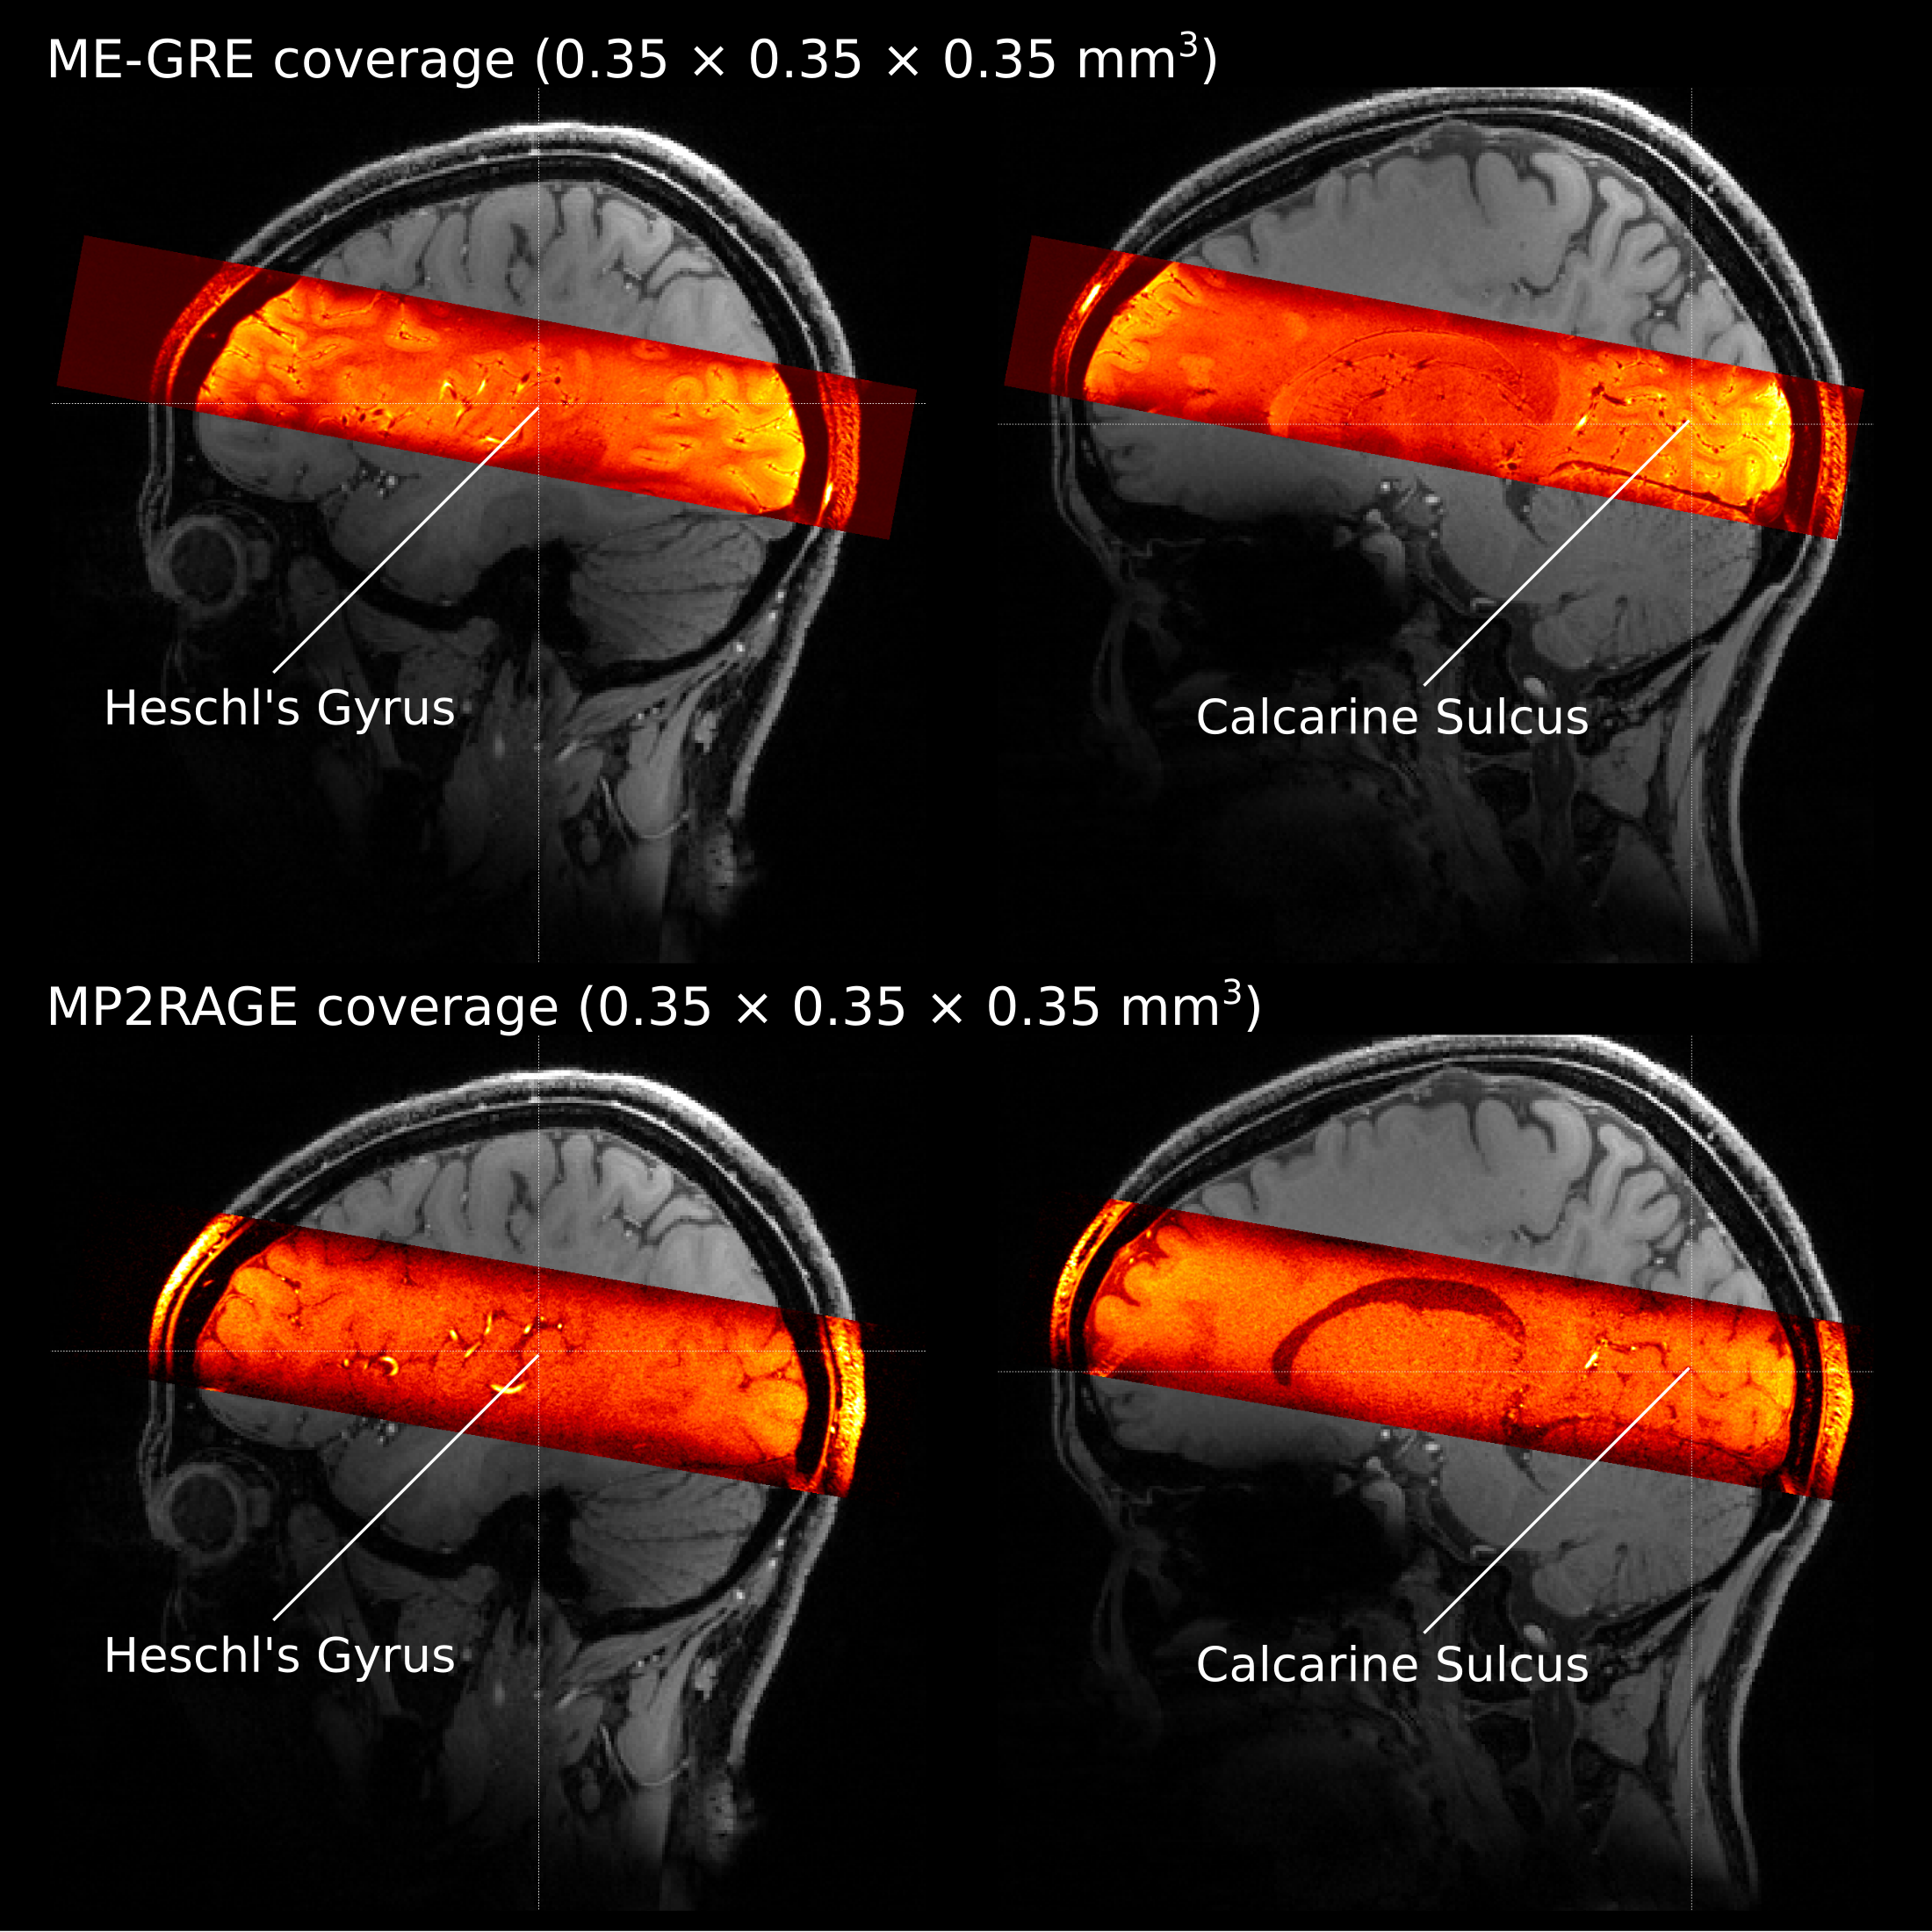
We acquired data from 5 volunteers at 7T (Siemens) using a 32-channel Rx head coil (Nova) and 3D ME-GRE with bipolar readout (0.35 mm iso. res.; TR = 30 ms; TE1-6= [3.83, 8.20, 12.57, 16.94, 21.31, 25.68] ms; α = 11°; elliptic k-space filling; 14 min., FOV = 201.6 × 201.6 × 36.4 mm3). Four ME-GRE images were acquired in one session. We changed the phase-encoding direction by 90° (R-L, A-P, L-R, P-A) in each acquisition. The 90°-changes were introduced to control the direction of the flow artifact, which appears as a spatial signal shift along the vector component of the flow direction on the readout axis [6].In a separate scanning session, we also acquired MP2RAGE images (0.35 mm iso.; TR/TE/TI1/TI2 = 5000/2.91/800/2700 ms; α1/α2=4°/5°; FOV=200×200×36 mm3, 10 min × 8) for gray matter segmentation. In addition, a whole-brain T1 image was acquired using a 3D MP2RAGE [7] (0.7 mm iso.; TR/TE/TI1/TI2 = 5000/2.46/900/2750 ms; α1/α2=5° / 3°; FOV = 208 × 208 × 156 mm3). Figure 1 illustrates the coverage of both the ME-GRE and MP2RAGE acquisitions.
Two dielectric pads containing a 25% suspension of calcium titanate in deuterated water were placed proximal to the temporal lobe to locally increase the transmit B1+ field for improving its homogeneity in both sessions [8].
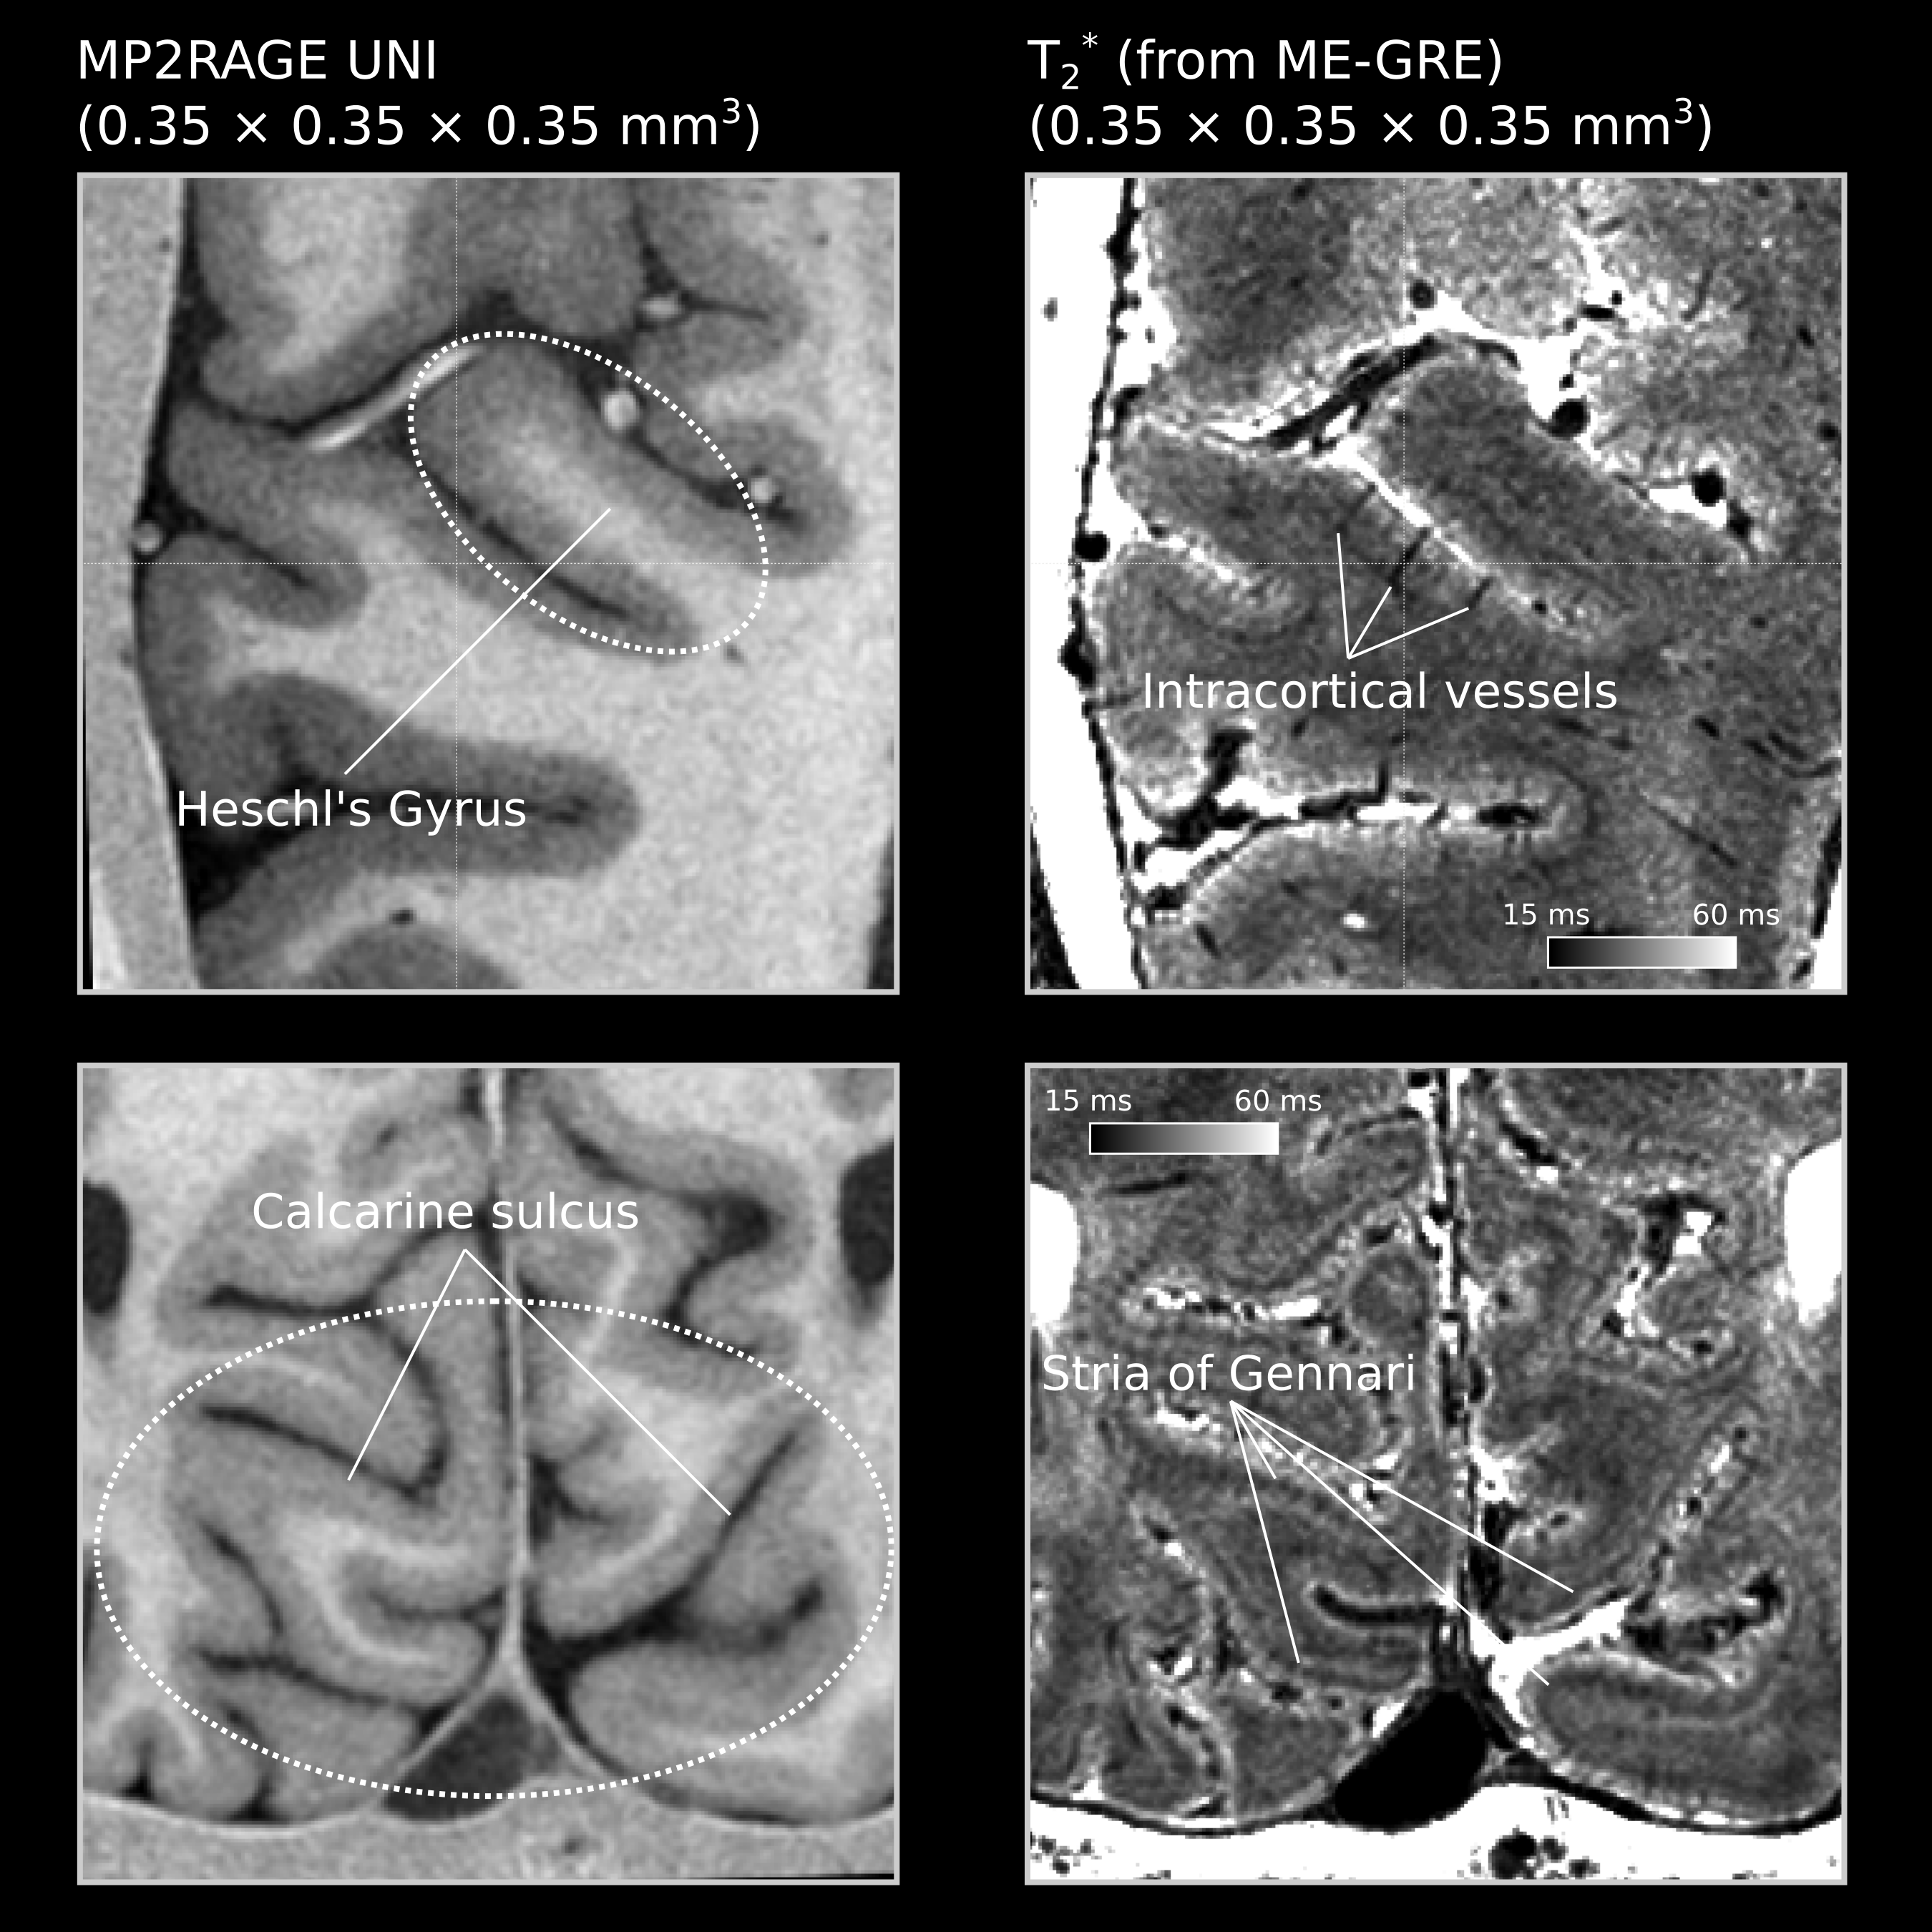
The flow artifacts were mitigated by compositing images with 90° phase-encoding changes after registration (see [9]). We averaged and registered the ME-GRE and MP2RAGE images across sessions. The final T1-weighted images have good WM-GM contrast, and the T2* maps show high sensitivity to microarchitecture (Stria of Gennari) and vascular features such as the intracortical vessels (Figure 2).
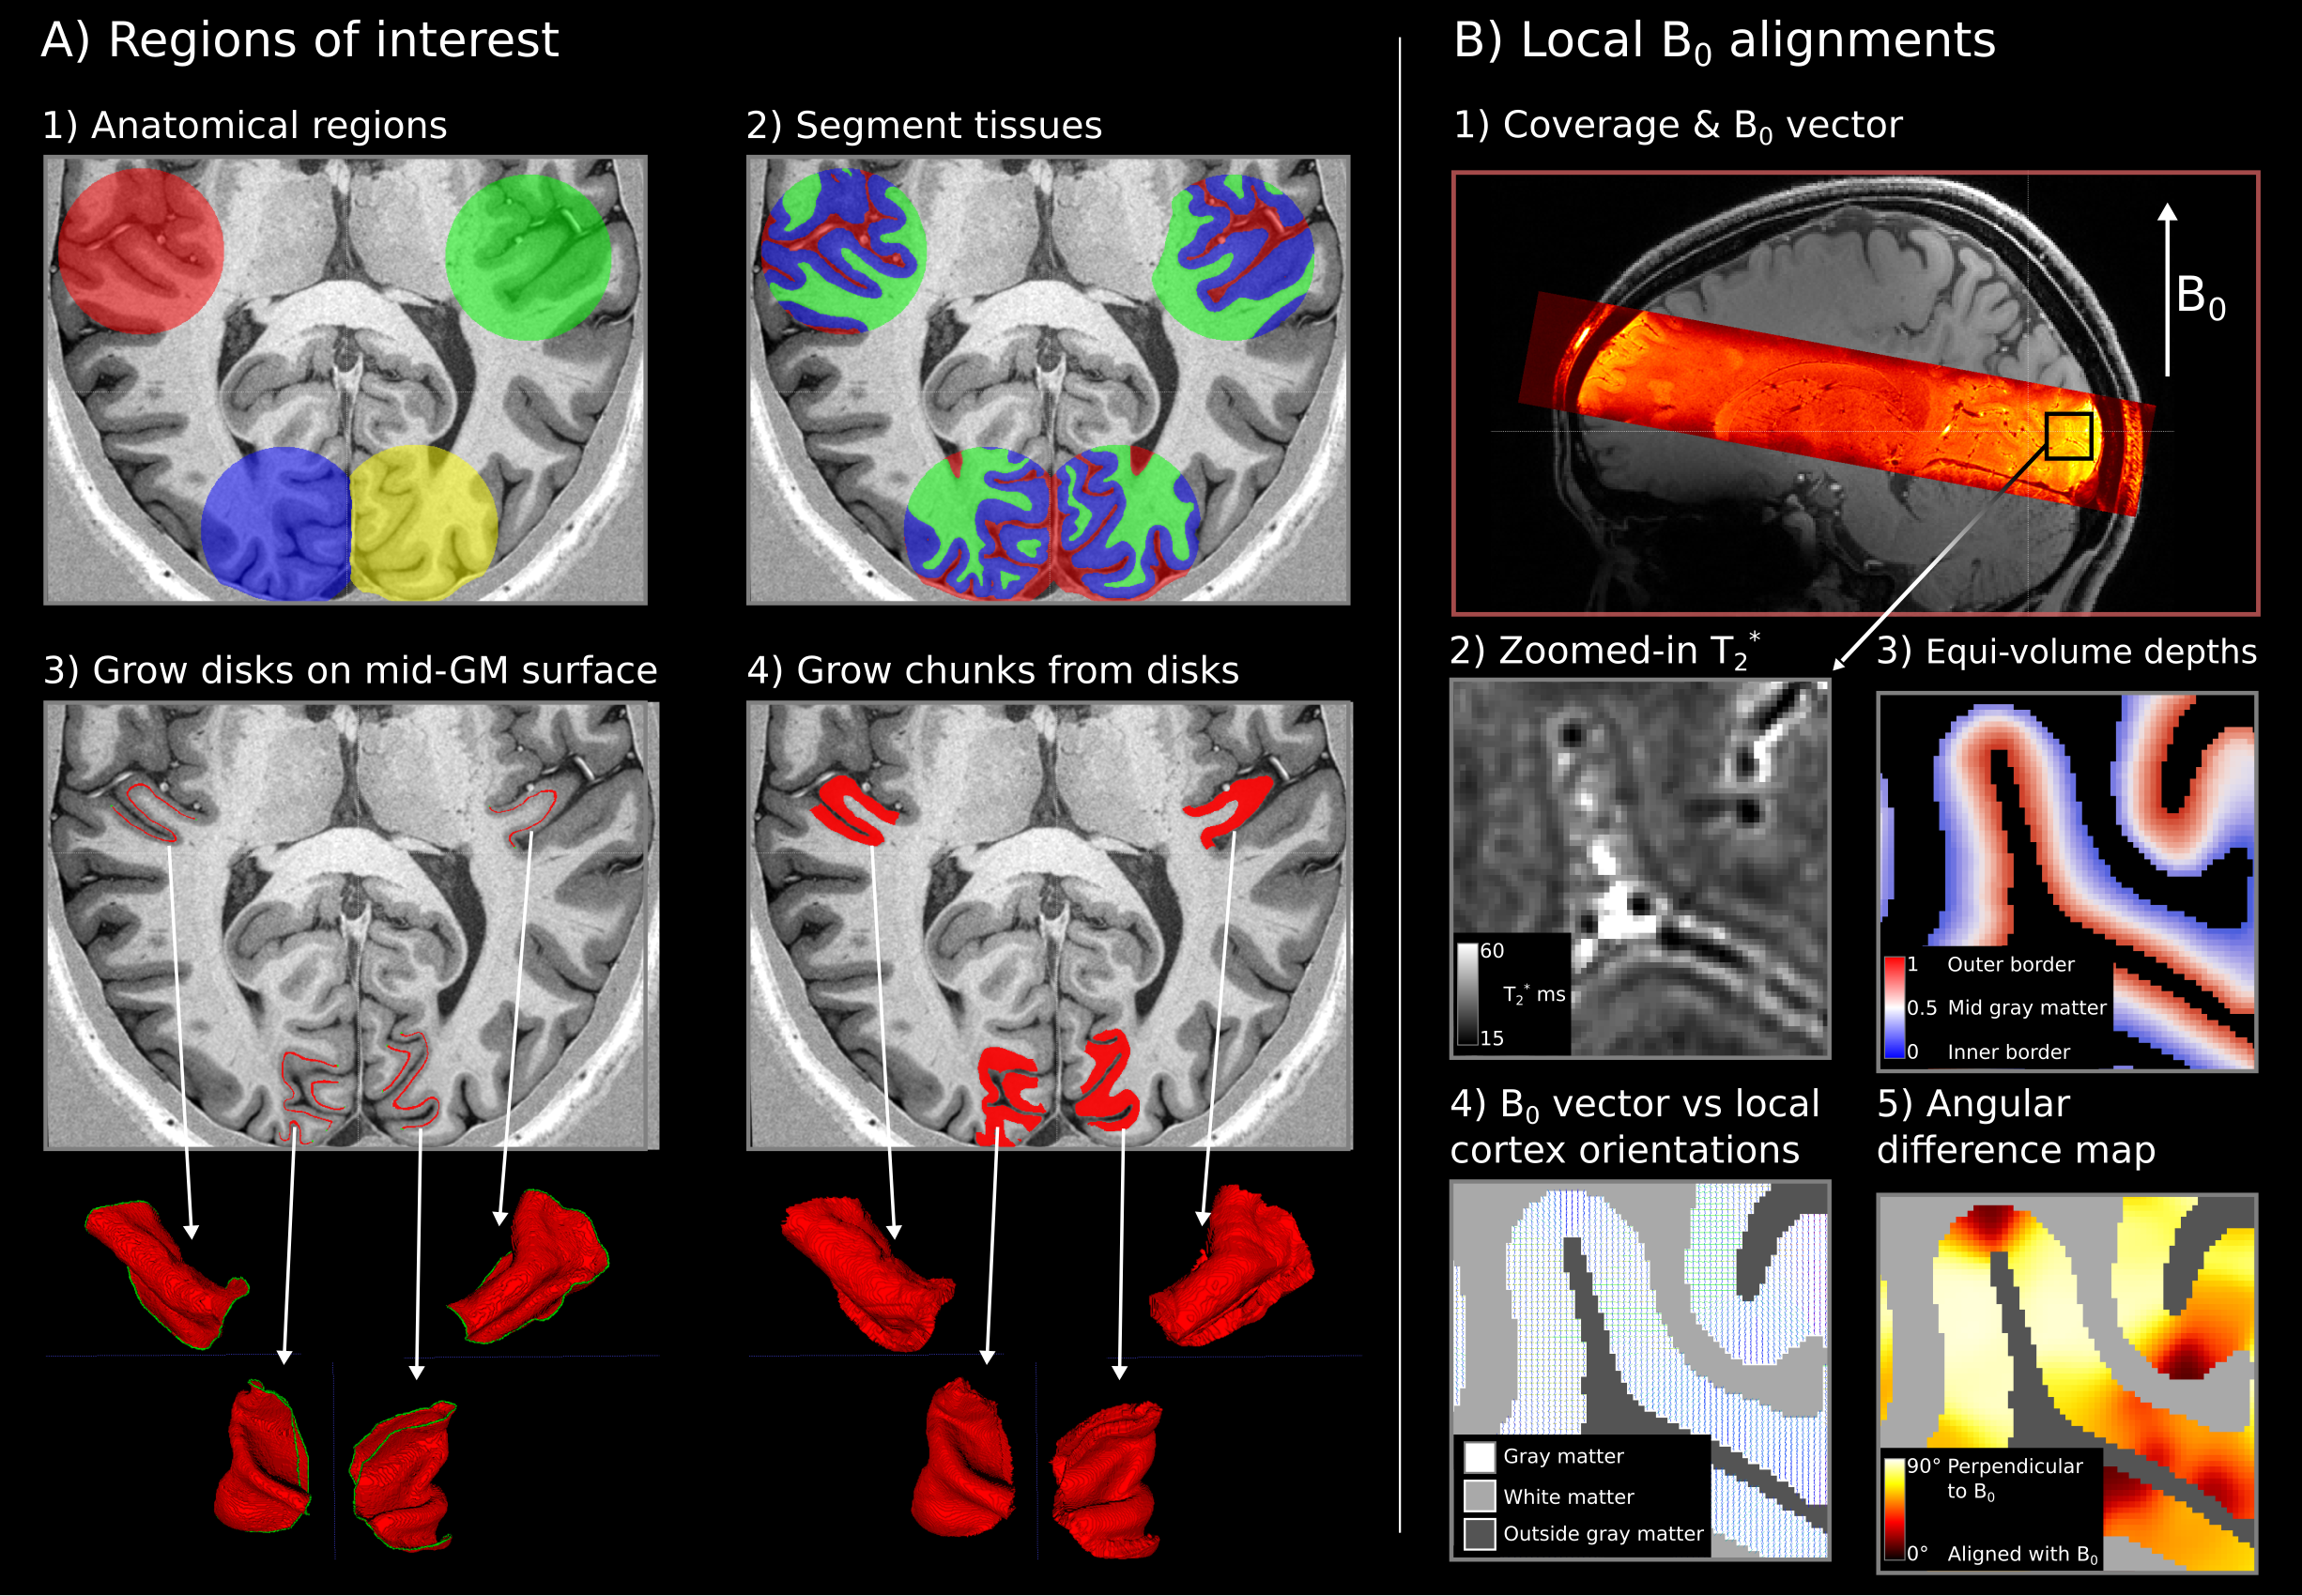
We segmented the gray matter in four regions: Heschl’s gyri and calcarine sulci in both hemispheres. LayNii [10] LN2_LAYERS program was used to compute equi-volume cortical depth measurements together with local cortex orientations for each gray matter voxel (at 0.35 mm isotropic resolution). Then we used the LN2_MULTILATERATE program to grow surface disks of equal sizes centered on the macroanatomical landmarks. These disks were later grown to cover the whole cortical thickness (Figure 3).
B0 vector was transformed from scanner space into image space by using the “qform” nifti header; the result was then used to compute the angle between local cortex orientations relative to the B0 vector.
Results & Discussion
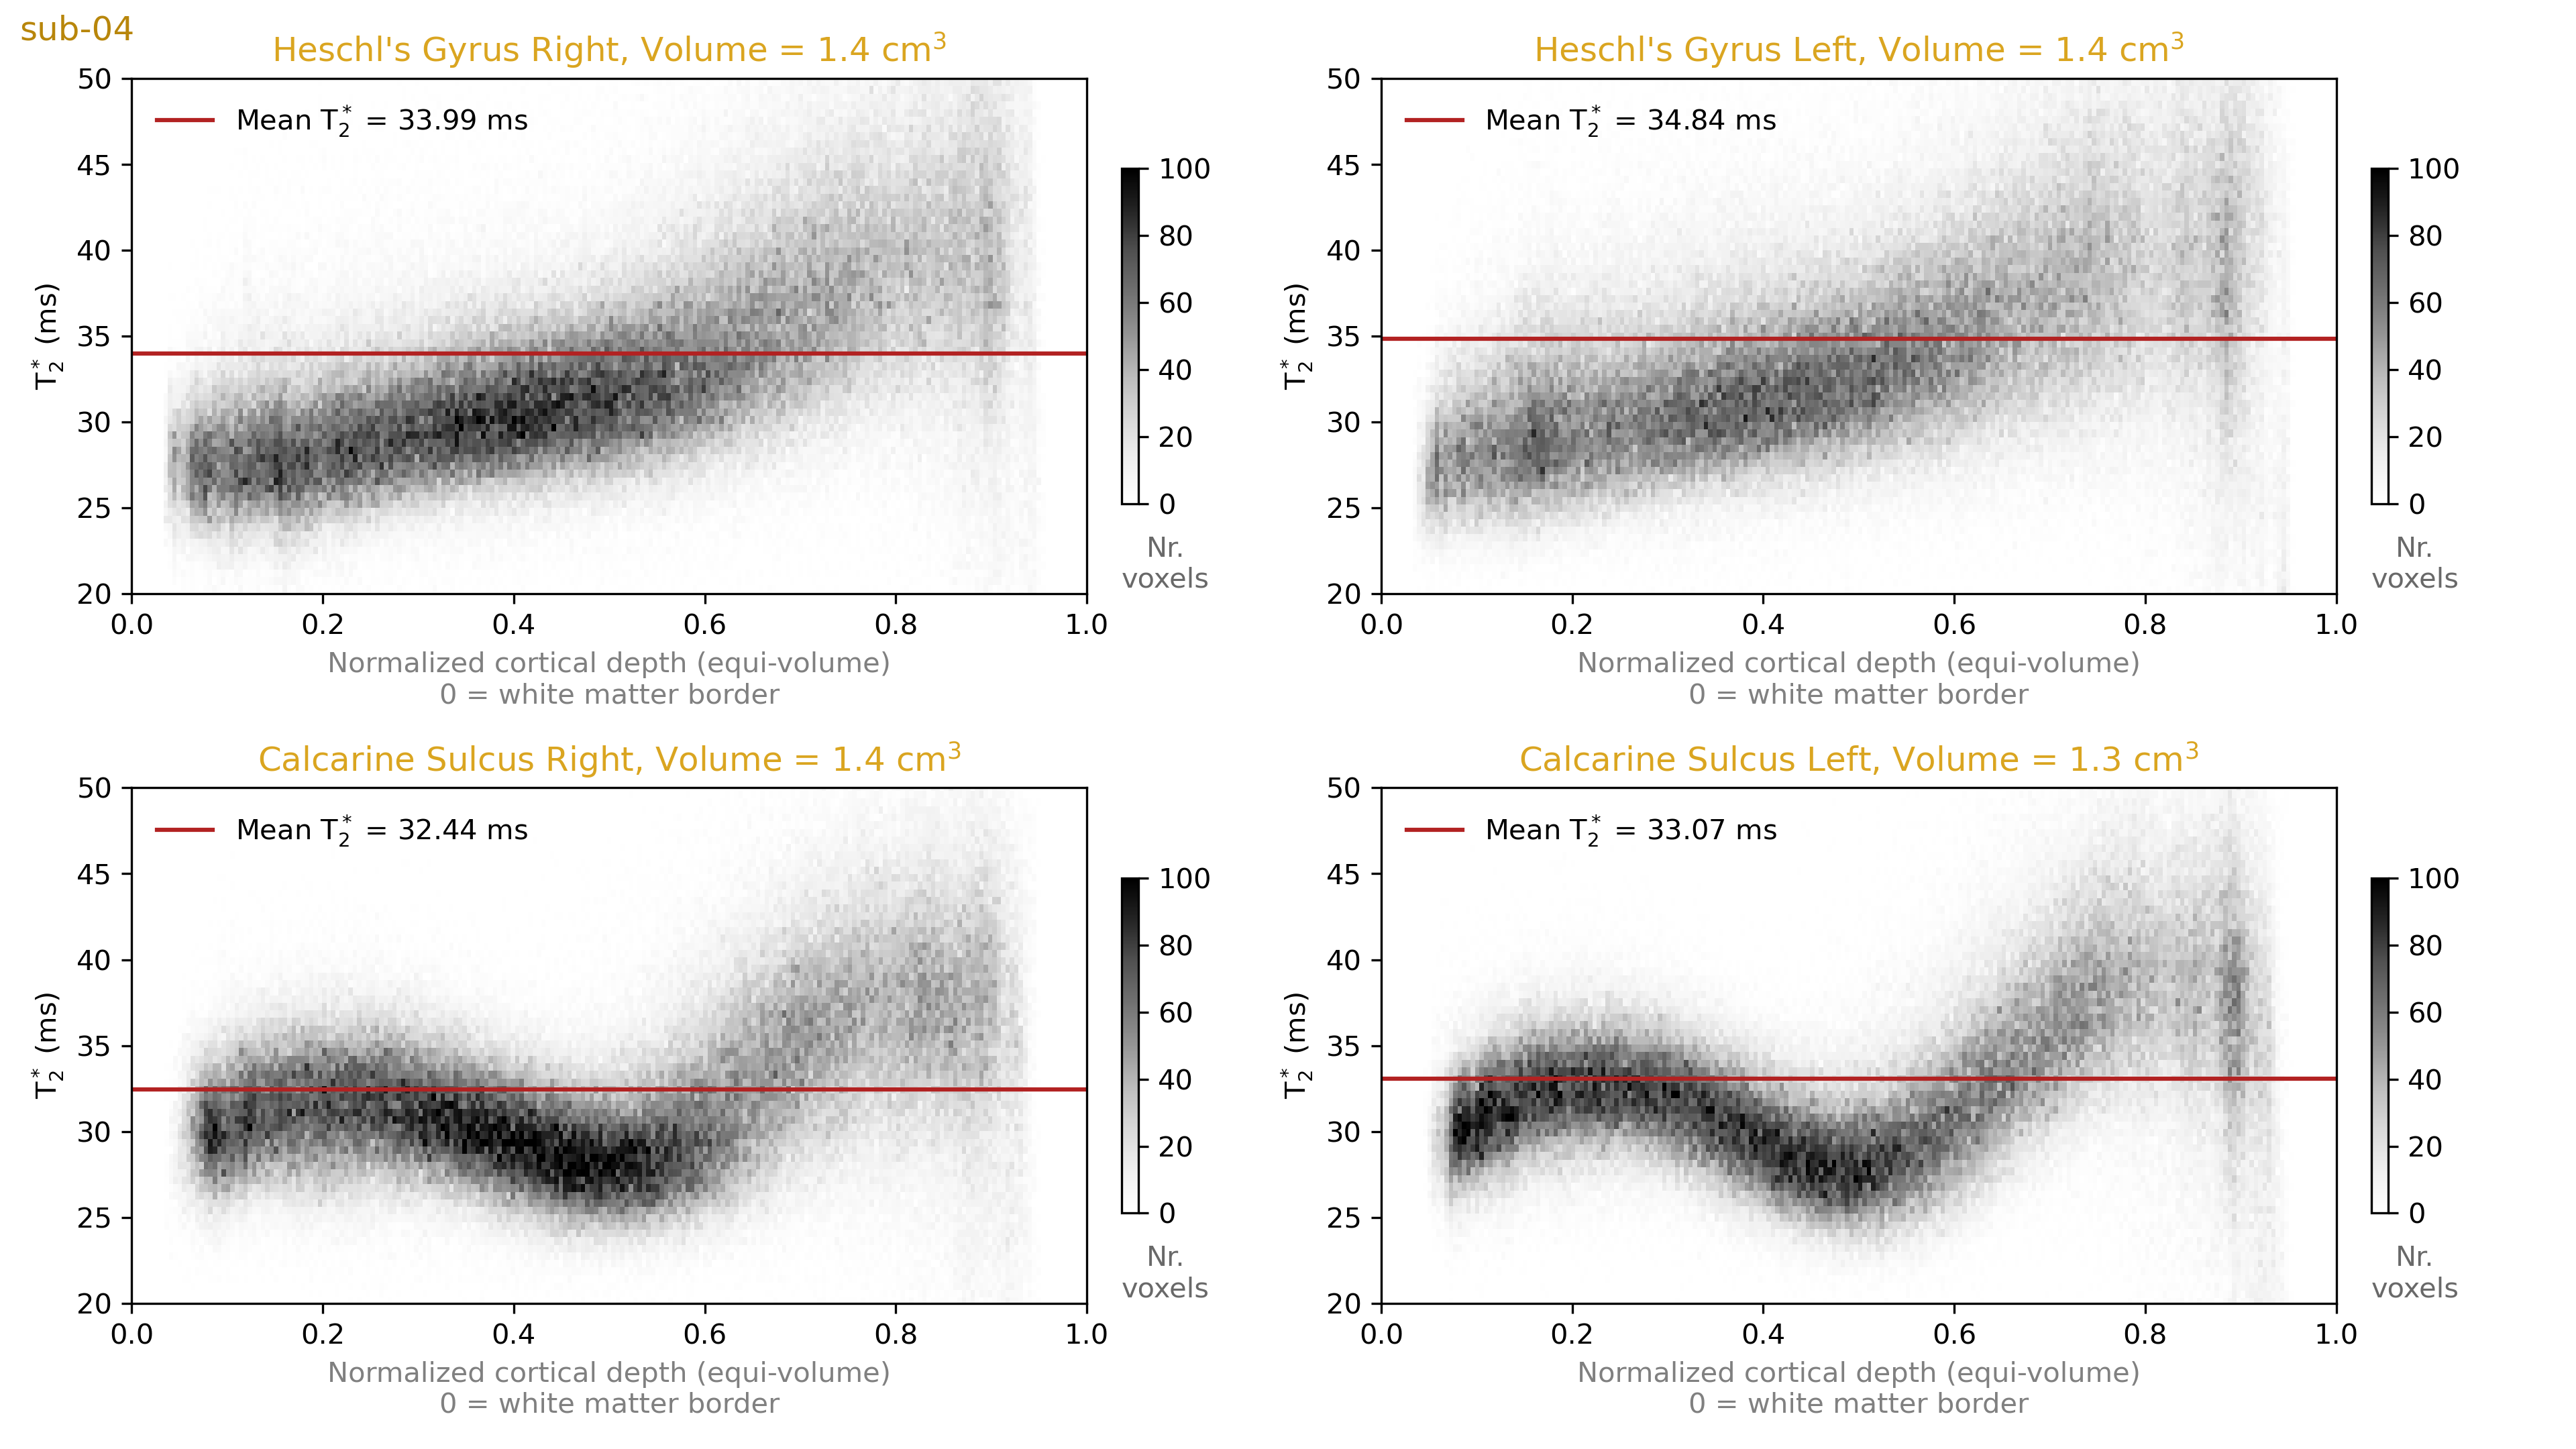
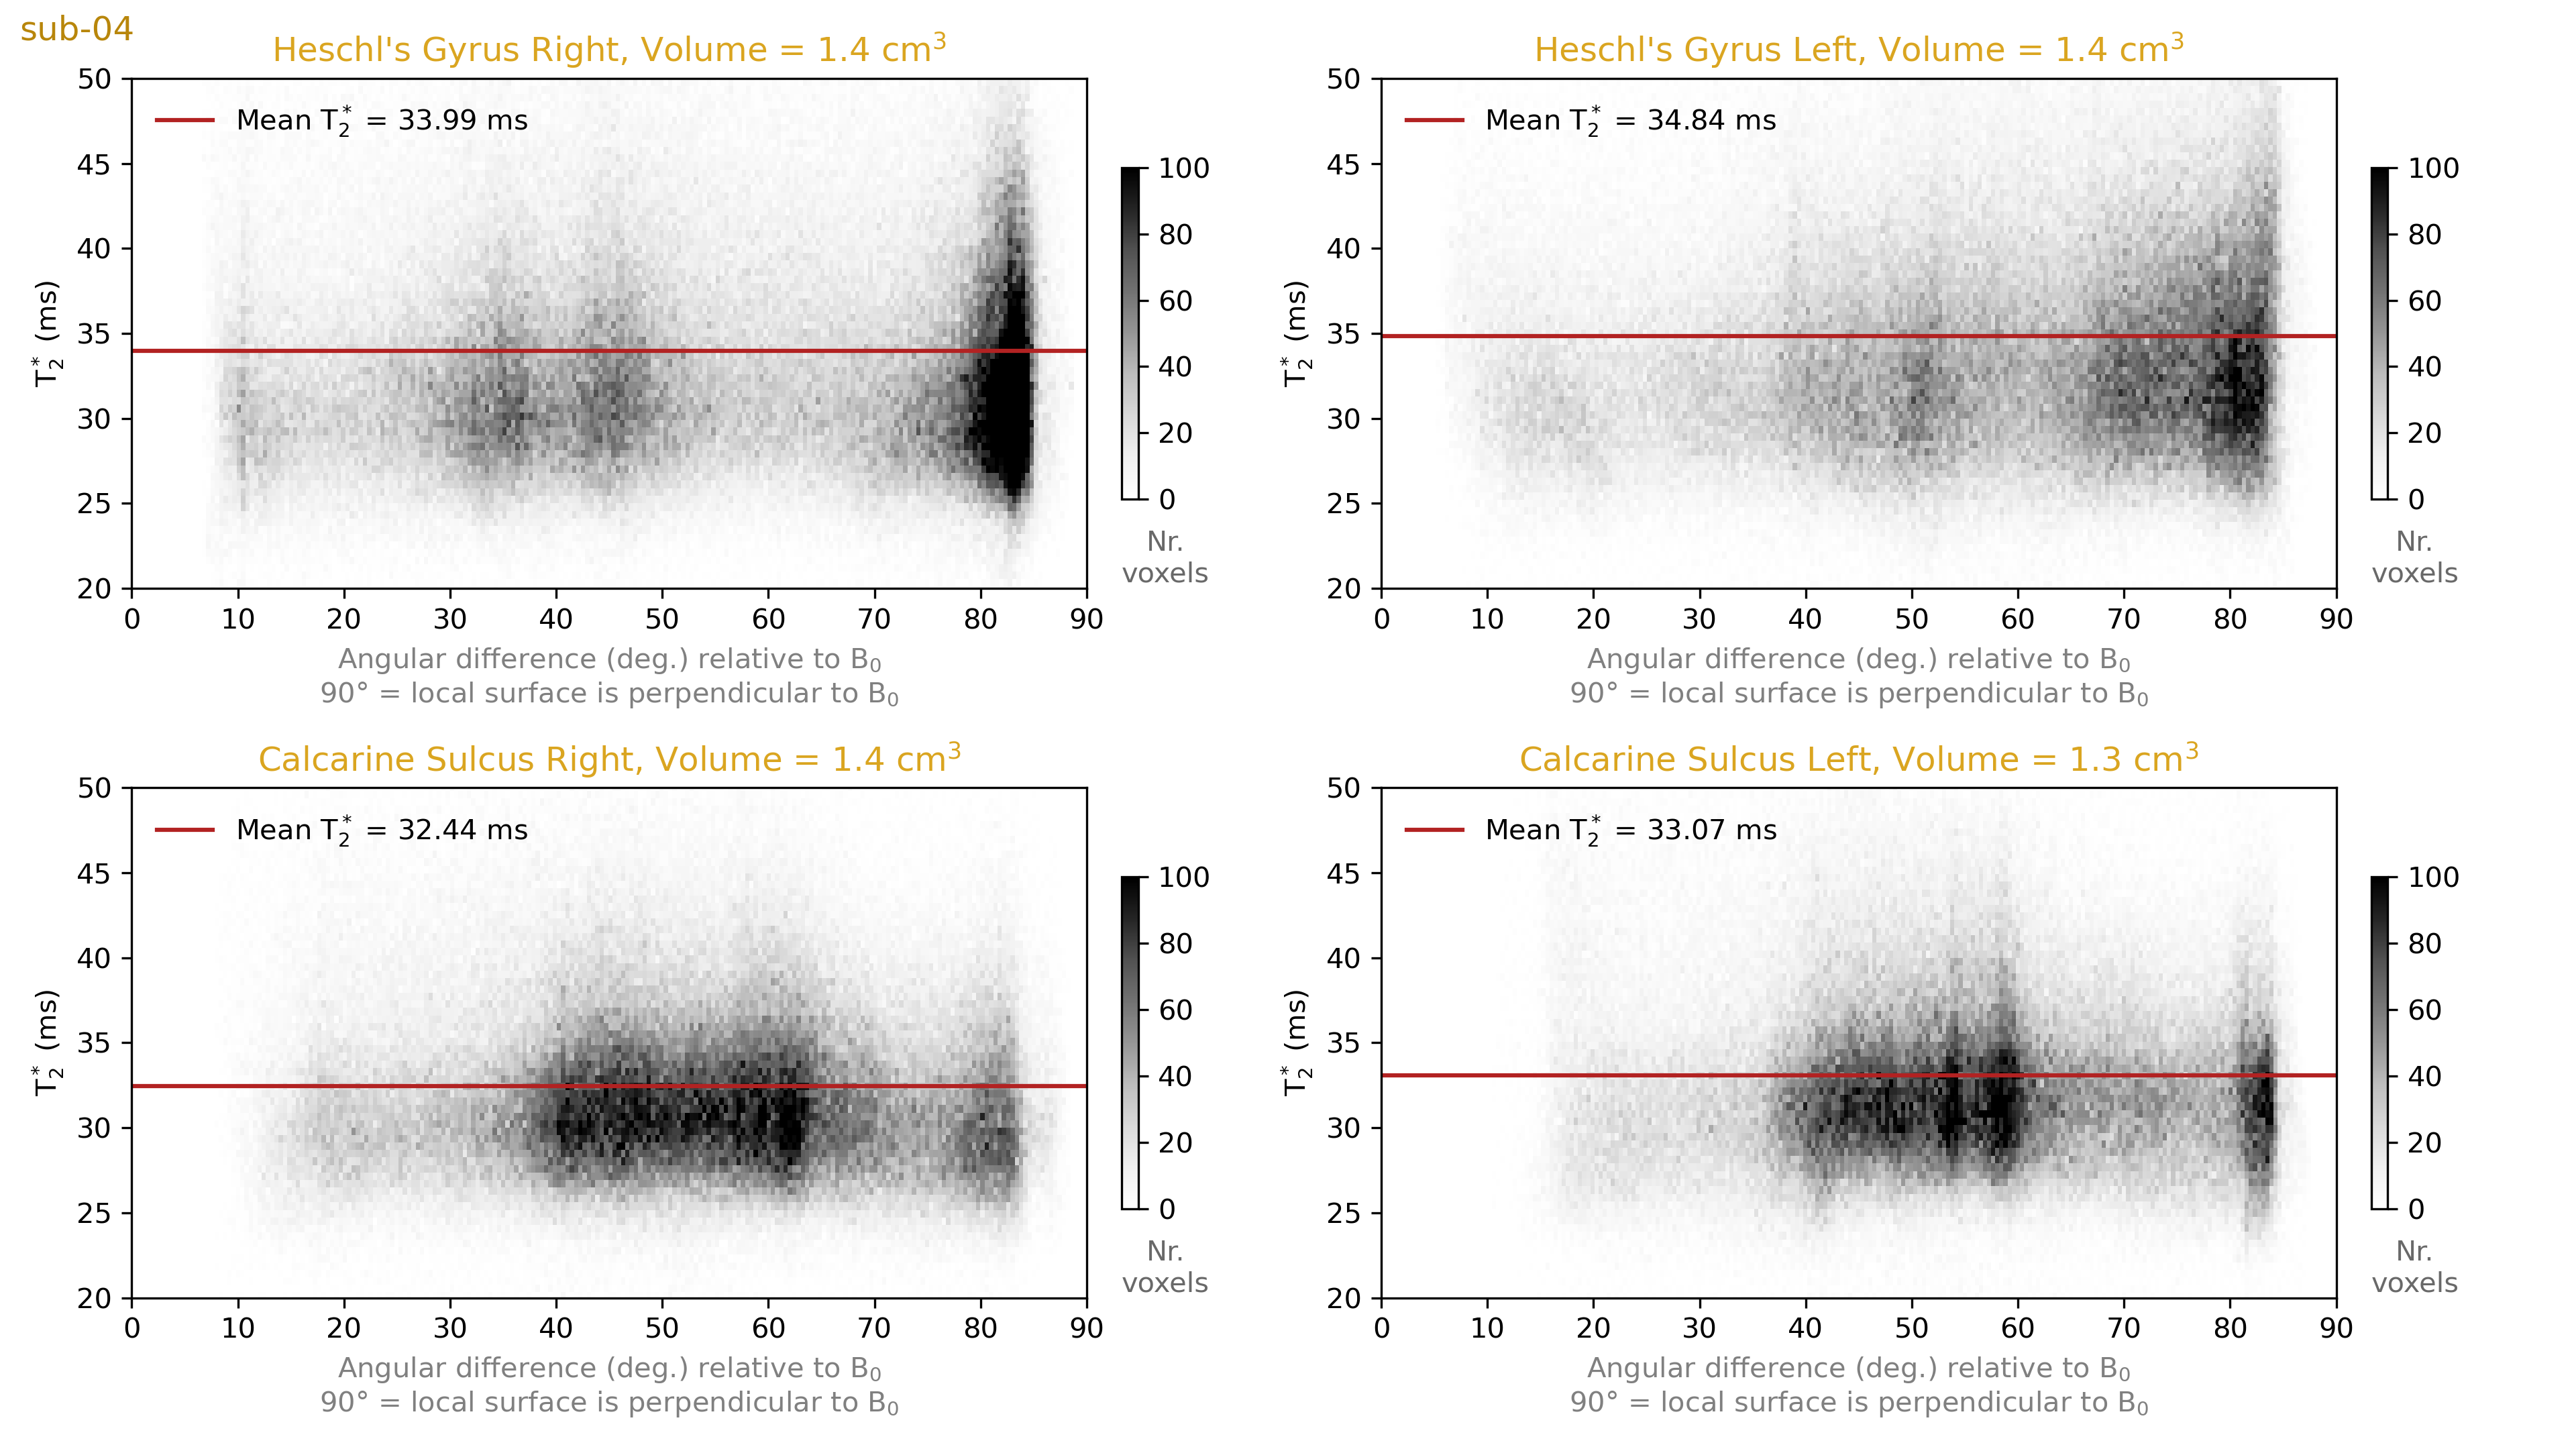
We plot 2D histograms of T2* values across cortical depths for our regions of interest (Figure 4). These show that the striae of Gennari are clearly visible as a dip around the middle cortical depth in the T2* measurements. However, we do not see a similar layer pattern at Heschl’s Gyri in either hemisphere. This observation highlights that even if the stria of Gennari is clearly visible in the calcarine sulcus, one cannot expect to see layer patterns of equal magnitude around Heschl’s gyrus. This would speak for the uniqueness of the calcarine sulcus layering compared to the rest of the cortex.In addition, we plot 2D histograms of T2* across local surface orientations relative to the B0 vector (Figure 5). It can be seen that although the orientations are sampled non-uniformly across the visual and auditory regions, we do not observe T2* fluctuations across different orientations comparable to the degree of T2* fluctuations observed across depths (in Figure 4). This observation highlights that the local biological tissue compositions has a stronger effect on T2* compared to the signal fluctuations due to B0 alignment. It should be noted that there are only a few samples from the most extreme B0 alignment configurations where the largest differences could be expected.
Summary & Conclusion
Our results showed that gray matter T2* varies strongly (locally up to 15 ms) across the whole range typically being in between 25 to 45 ms from deep to superficial layers. The stria of Gennari shows up as a major reduction of T2* within the calcarine sulcus. However, a similar layering is not visible within Heschl’s gyrus. The B0 alignment effects seem not to be as strong as the biological tissue composition effects that are observed across the visual and auditory regions of interest. Establishing a baseline of in vivo human brain T2* values as a function of other variation sources is important to understand the nature of the MRI signal to set more plausible expectations about the required resolution and signal amplitude assumptions of the future e.g. functional imaging.Acknowledgements
This study was approved by the local ethics committee. OFG is an employee of Brain Innovation and has financial interest tied to the company. SB acknowledges funding from the NHMRC-NIH BRAIN Initiative Collaborative Research Grant APP1117020, NIH grant 1R01MH111419. LH was funded from the NWO VENI project 016.Veni.198.032. BP is partially funded by the NWO VIDI grant 16.Vidi.178.052 and by the National Institute for Health grant (R01MH/111444) (PI David Feinberg).References
[1] Barbier, E. L., Marrett, S., Danek, A., Vortmeyer, A., Van Gelderen, P., Duyn, J., Bandettini, P., Grafman, J., & Koretsky, A. P. (2002). Imaging cortical anatomy by high-resolution MR at 3.0T: Detection of the stripe of Gennari in visual area 17. Magnetic Resonance in Medicine, 48(4), 735–738. https://doi.org/10.1002/mrm.10255
[2] Duyn, J. H., van Gelderen, P., Li, T.-Q., de Zwart, J. A., Koretsky, A. P., & Fukunaga, M. (2007). High-field MRI of brain cortical substructure based on signal phase. Proceedings of the National Academy of Sciences, 104(28), 11796–11801. https://doi.org/10.1073/pnas.0610821104
[3] Budde, J., Shajan, G., Hoffmann, J., Uǧurbil, K., & Pohmann, R. (2011). Human imaging at 9.4 T using T2*-, phase-, and susceptibility-weighted contrast. Magnetic Resonance in Medicine, 65(2), 544–550. https://doi.org/10.1002/mrm.22632
[4] Kemper, V. G., De Martino, F., Emmerling, T. C., Yacoub, E., & Goebel, R. (2018). High resolution data analysis strategies for mesoscale human functional MRI at 7 and 9.4T. NeuroImage, 164, 48–58. https://doi.org/10.1016/j.neuroimage.2017.03.058
[5] Cohen-Adad, J., Polimeni, J. R., Helmer, K. G., Benner, T., McNab, J. A., Wald, L. L., Rosen, B. R., Mainero, C. (2012). T2* mapping and B0 orientation-dependence at 7T reveal cyto- and myeloarchitecture organization of the human cortex. NeuroImage, 60(2), 1006–1014. https://doi.org/10.1016/j.neuroimage.2012.01.053
[6] Larson, T. C., Kelly, W. M., Ehman, R. L., & Wehrli, F. W. (1990). Spatial misregistration of vascular flow during MR imaging of the CNS: cause and clinical significance. AJR. American Journal of Roentgenology, 155(5), 1117–1124.
[7] Cohen-Adad, J., Polimeni, J. R., Helmer, K. G., Benner, T., McNab, J. A., Wald, L. L., … Mainero, C. (2012). T 2* mapping and B 0 orientation-dependence at 7T reveal cyto- and myeloarchitecture organization of the human cortex. NeuroImage, 60(2), 1006–1014. https://doi.org/10.1016/j.neuroimage.2012.01.053
[8] Teeuwisse, W. M., Brink, W. M., & Webb, A. G. (2012). Quantitative assessment of the effects of high-permittivity pads in 7 Tesla MRI of the brain. Magnetic Resonance in Medicine, 67(5), 1285–1293.
[9] Gulban, O.F.; Poser, B.A.; Havlicek, M.; De Martino, F.; Ivanov, D. (2020): 7T in-vivo human T2* mapping at 350μm iso. res. using ME-GRE with flow artifact mitigation reveals cortical layers & vessels. figshare. Media. https://doi.org/10.6084/m9.figshare.13360100.v1
[10] Huber, L., Poser, B. A., Bandettini, P. A., Arora, K., Wagstyl, K., Cho, S., Goense, J., Nothnagel, N., Morgan, A. T., Mueller A. K., van den Hurk, J., Reynolds, R. C., Glen, D. R., Goebel, R. W., Gulban, O. F. (2020). LayNii: A software suite for layer-fMRI. BioRxiv. https://doi.org/10.1101/2020.06.12.148080
Figures