0094
On Comparability and Reproducibility of Myelin Sensitive Imaging Techniques1Advanced Clinical Imaging Technology (ACIT), Siemens Healthcare, Lausanne, Switzerland, 2Department of Radiology, Lausanne University Hospital (CHUV), Lausanne, Switzerland, 3LTS5, École Polytechnique Fédérale de Lausanne, Lausanne, Switzerland, 4Aix Marseille Univ, CNRS, CRMBM, Marseille, France, 5Siemens Healthcare SAS, Saint-Denis, France, 6Siemens Healthcare, Zurich, Switzerland, 7Swiss Center for Musculoskeletal Imaging (SCMI), Balgrist Campus, Zurich, Switzerland, 8Advanced Clinical Imaging Technology (ACIT), Siemens Healthcare, Bern, Switzerland, 9Translational Imaging Center, Sitem-Insel, Bern, Switzerland, 10Departments of Radiology and Biomedical Research, University of Bern, Bern, Switzerland
Synopsis
A reliable and non-invasive measurement of myelin content in the brain is of high importance for neurodegenerative diseases such as multiple sclerosis. To this end, various methods have been developed over the past years with different advantages and shortcomings. In this work, six widely used methods are compared and tested for reproducibility: (i) longitudinal relaxation rate, (ii) magnetization transfer ratio, (iii) macromolecular proton fraction, (iv) inhomogeneous magnetization transfer saturation, (v) myelin water fraction, and (vi) inversion recovery at ultra-short echo time. This comparison may facilitate an informed decision on which myelin imaging techniques should be used in future studies.
Introduction
Myelin is important for the successful processing of information in the human brain, and its damage/repair plays a major role in neurodegenerative diseases such as multiple sclerosis1 and acute disseminated encephalomyelitis2, among others. Over the past decades, various methods to probe the myelin content non-invasively through MRI were published3. However, only few comparisons were made between these methods.4–7In this work, we compare six different methods sensitive to myelin (pairwise correlations) and test their reproducibility to facilitate an informed decision on which technique should be used in a study considering the respective clinical focus. The results of this study may also help to harmonize data between studies that used different myelin imaging techniques.
Methods
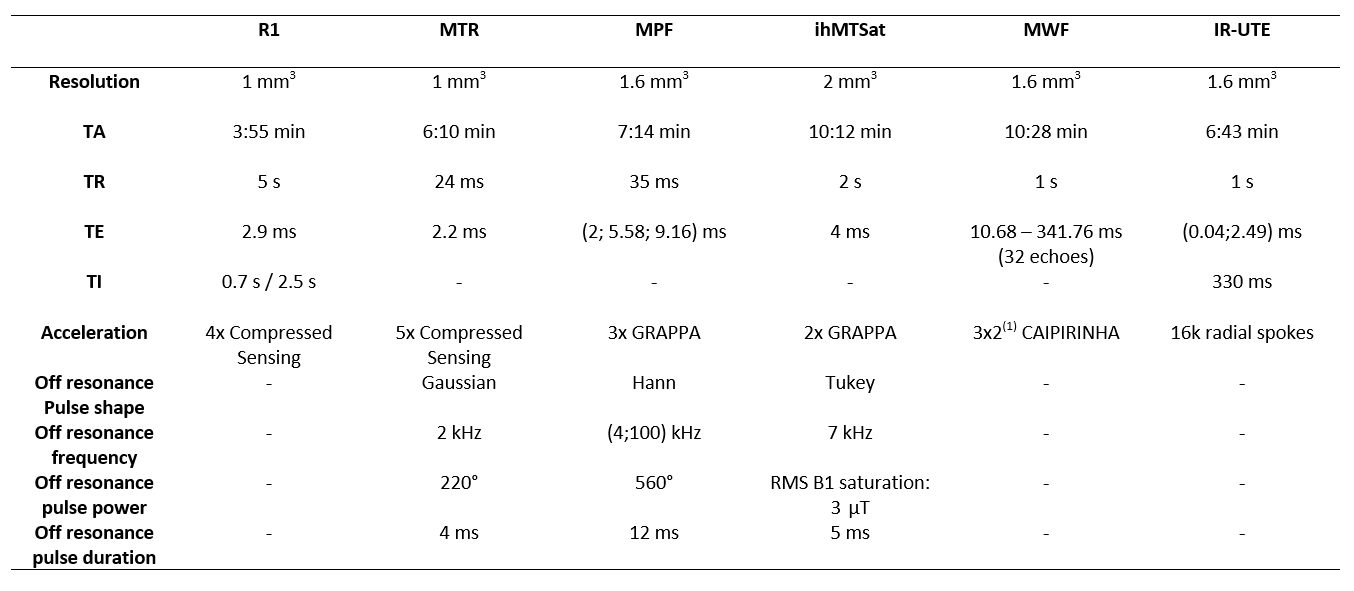
After obtaining written informed consent, images from four healthy volunteers were acquired at 3T (MAGNETOM PrismaFit, Siemens Healthcare, Erlangen, Germany) using a 64-channel receive head/neck coil. The following MR metrics derived from prototype myelin imaging techniques were used:- Quantitative R1 based on a Compressed Sensing MP2RAGE sequence.8
- Magnetization Transfer Ratio (MTR) using a Compressed Sensing Gradient-Recalled Echo (GRE) sequence9 to acquire two GRE volumes where in one, an off-resonance pulse is played out before each excitation to saturate the macromolecular spin pool.
- Macromolecular Proton Fraction (MPF) computed from a single-point quantitative MT protocol, with an MT-weighted GRE image, a reference GRE image, R1, B1, and B0 maps.10–12
- Inhomogeneous Magnetization Transfer saturation (ihMTSat) based on MT images acquired with sensitivity-optimized13 ihMT-prepared RAGE sequence14 and corrected for T1/B1 effects.15
- Myelin Water Fraction (MWF) using a fast multi-echo gradient- and spin-echo (mcGRASE) sequence.16
- Non-quantitative inversion-recovery ultra-short-echo-time (IR-UTE) images acquired similar to17 with a 3D isotropic radial center-out k-space trajectory (without hybrid encoding).
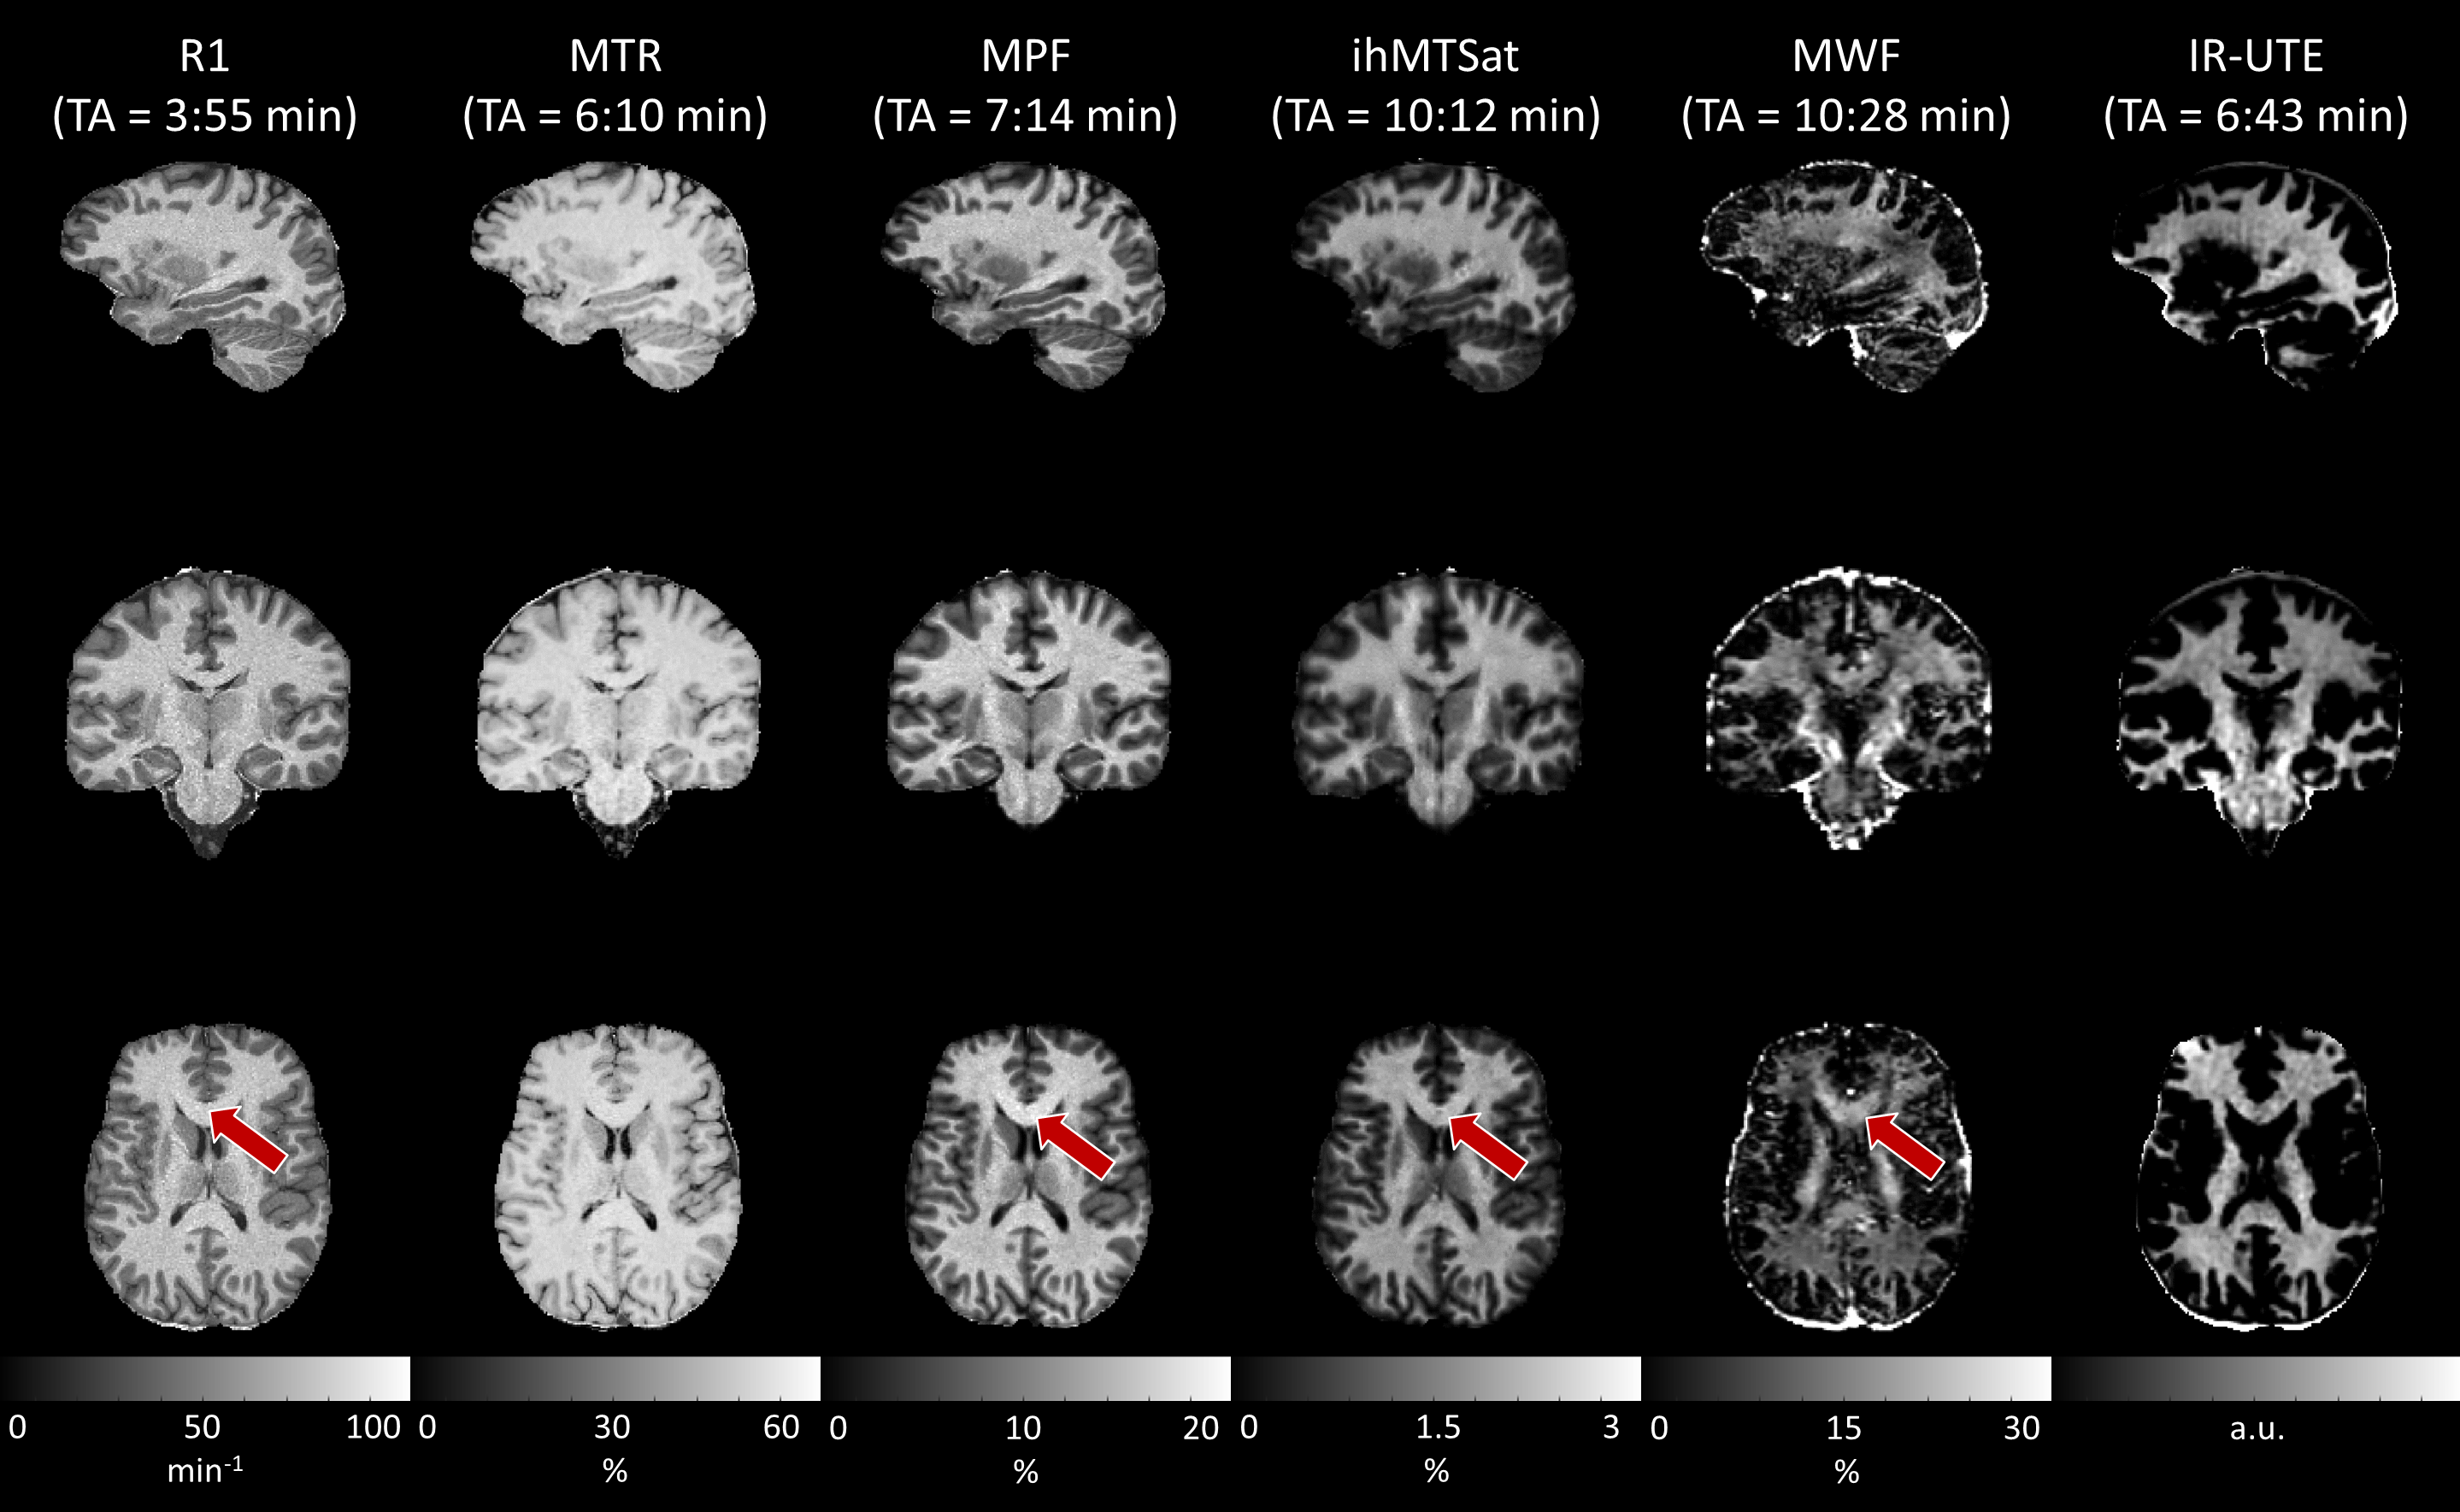
For a qualitative assessment, all maps were co-registered into the MP2RAGE space and visually compared. Of note, this may introduce a bias towards the R1 map since these are the only maps that are not interpolated in this comparison.
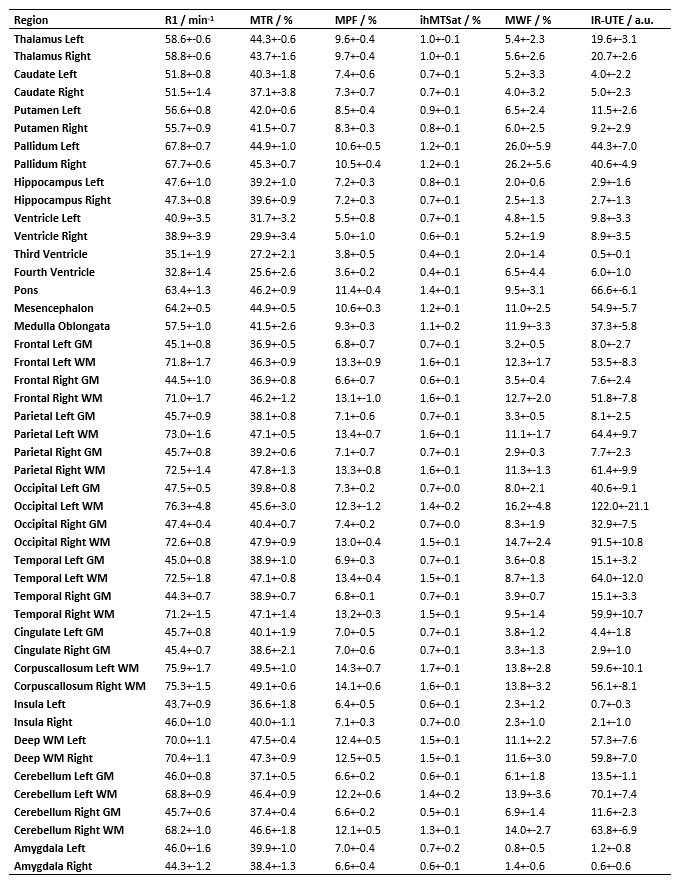
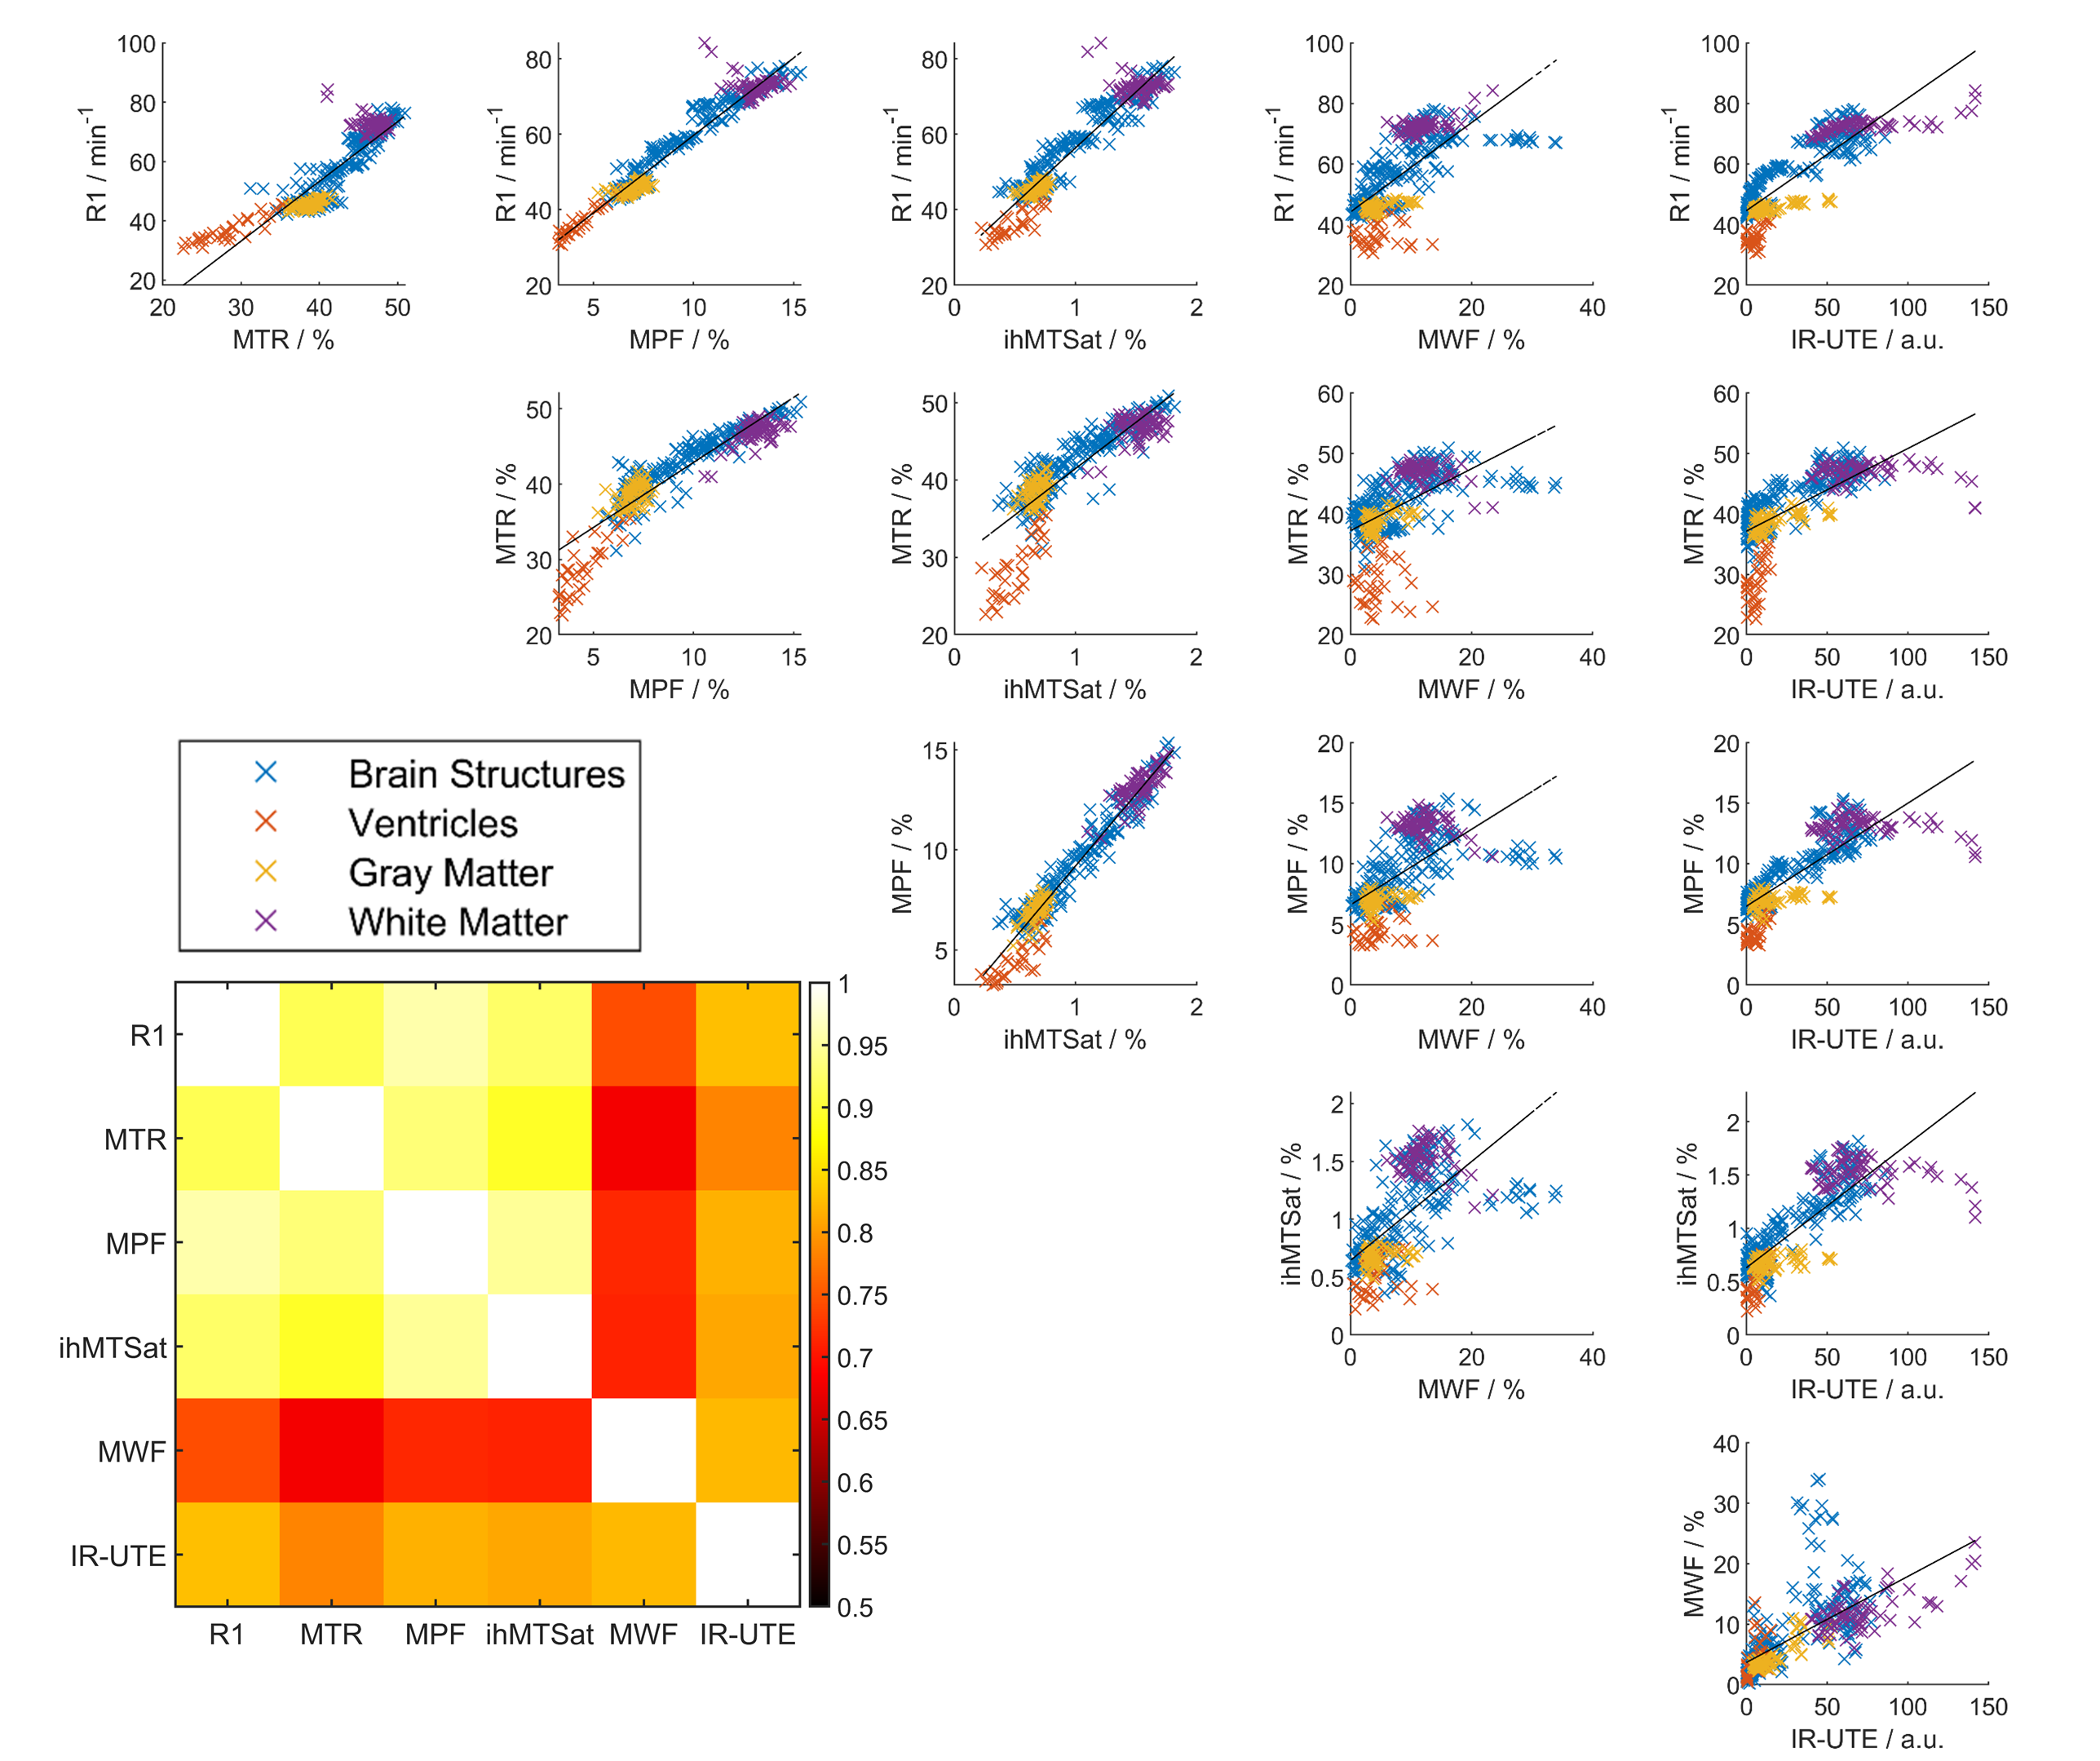
To test the similarity of the contrasts, the correlation between regional intensity values of the different techniques (pairwise comparison) was calculated using data points from all subjects and sessions. To that end, the prototype segmentation algorithm MorphoBox18 was used to segment 47 regions in the MP2RAGE space. The resulting label map was copied into the native space of each technique using affine registration19. Subsequently, for each method, the intensity values averaged within each region, from each subject, and from each session were calculated. Finally, the Spearman correlation of these regional values between each myelin method was calculated and tested for significance (assuming p<0.05 as significant).
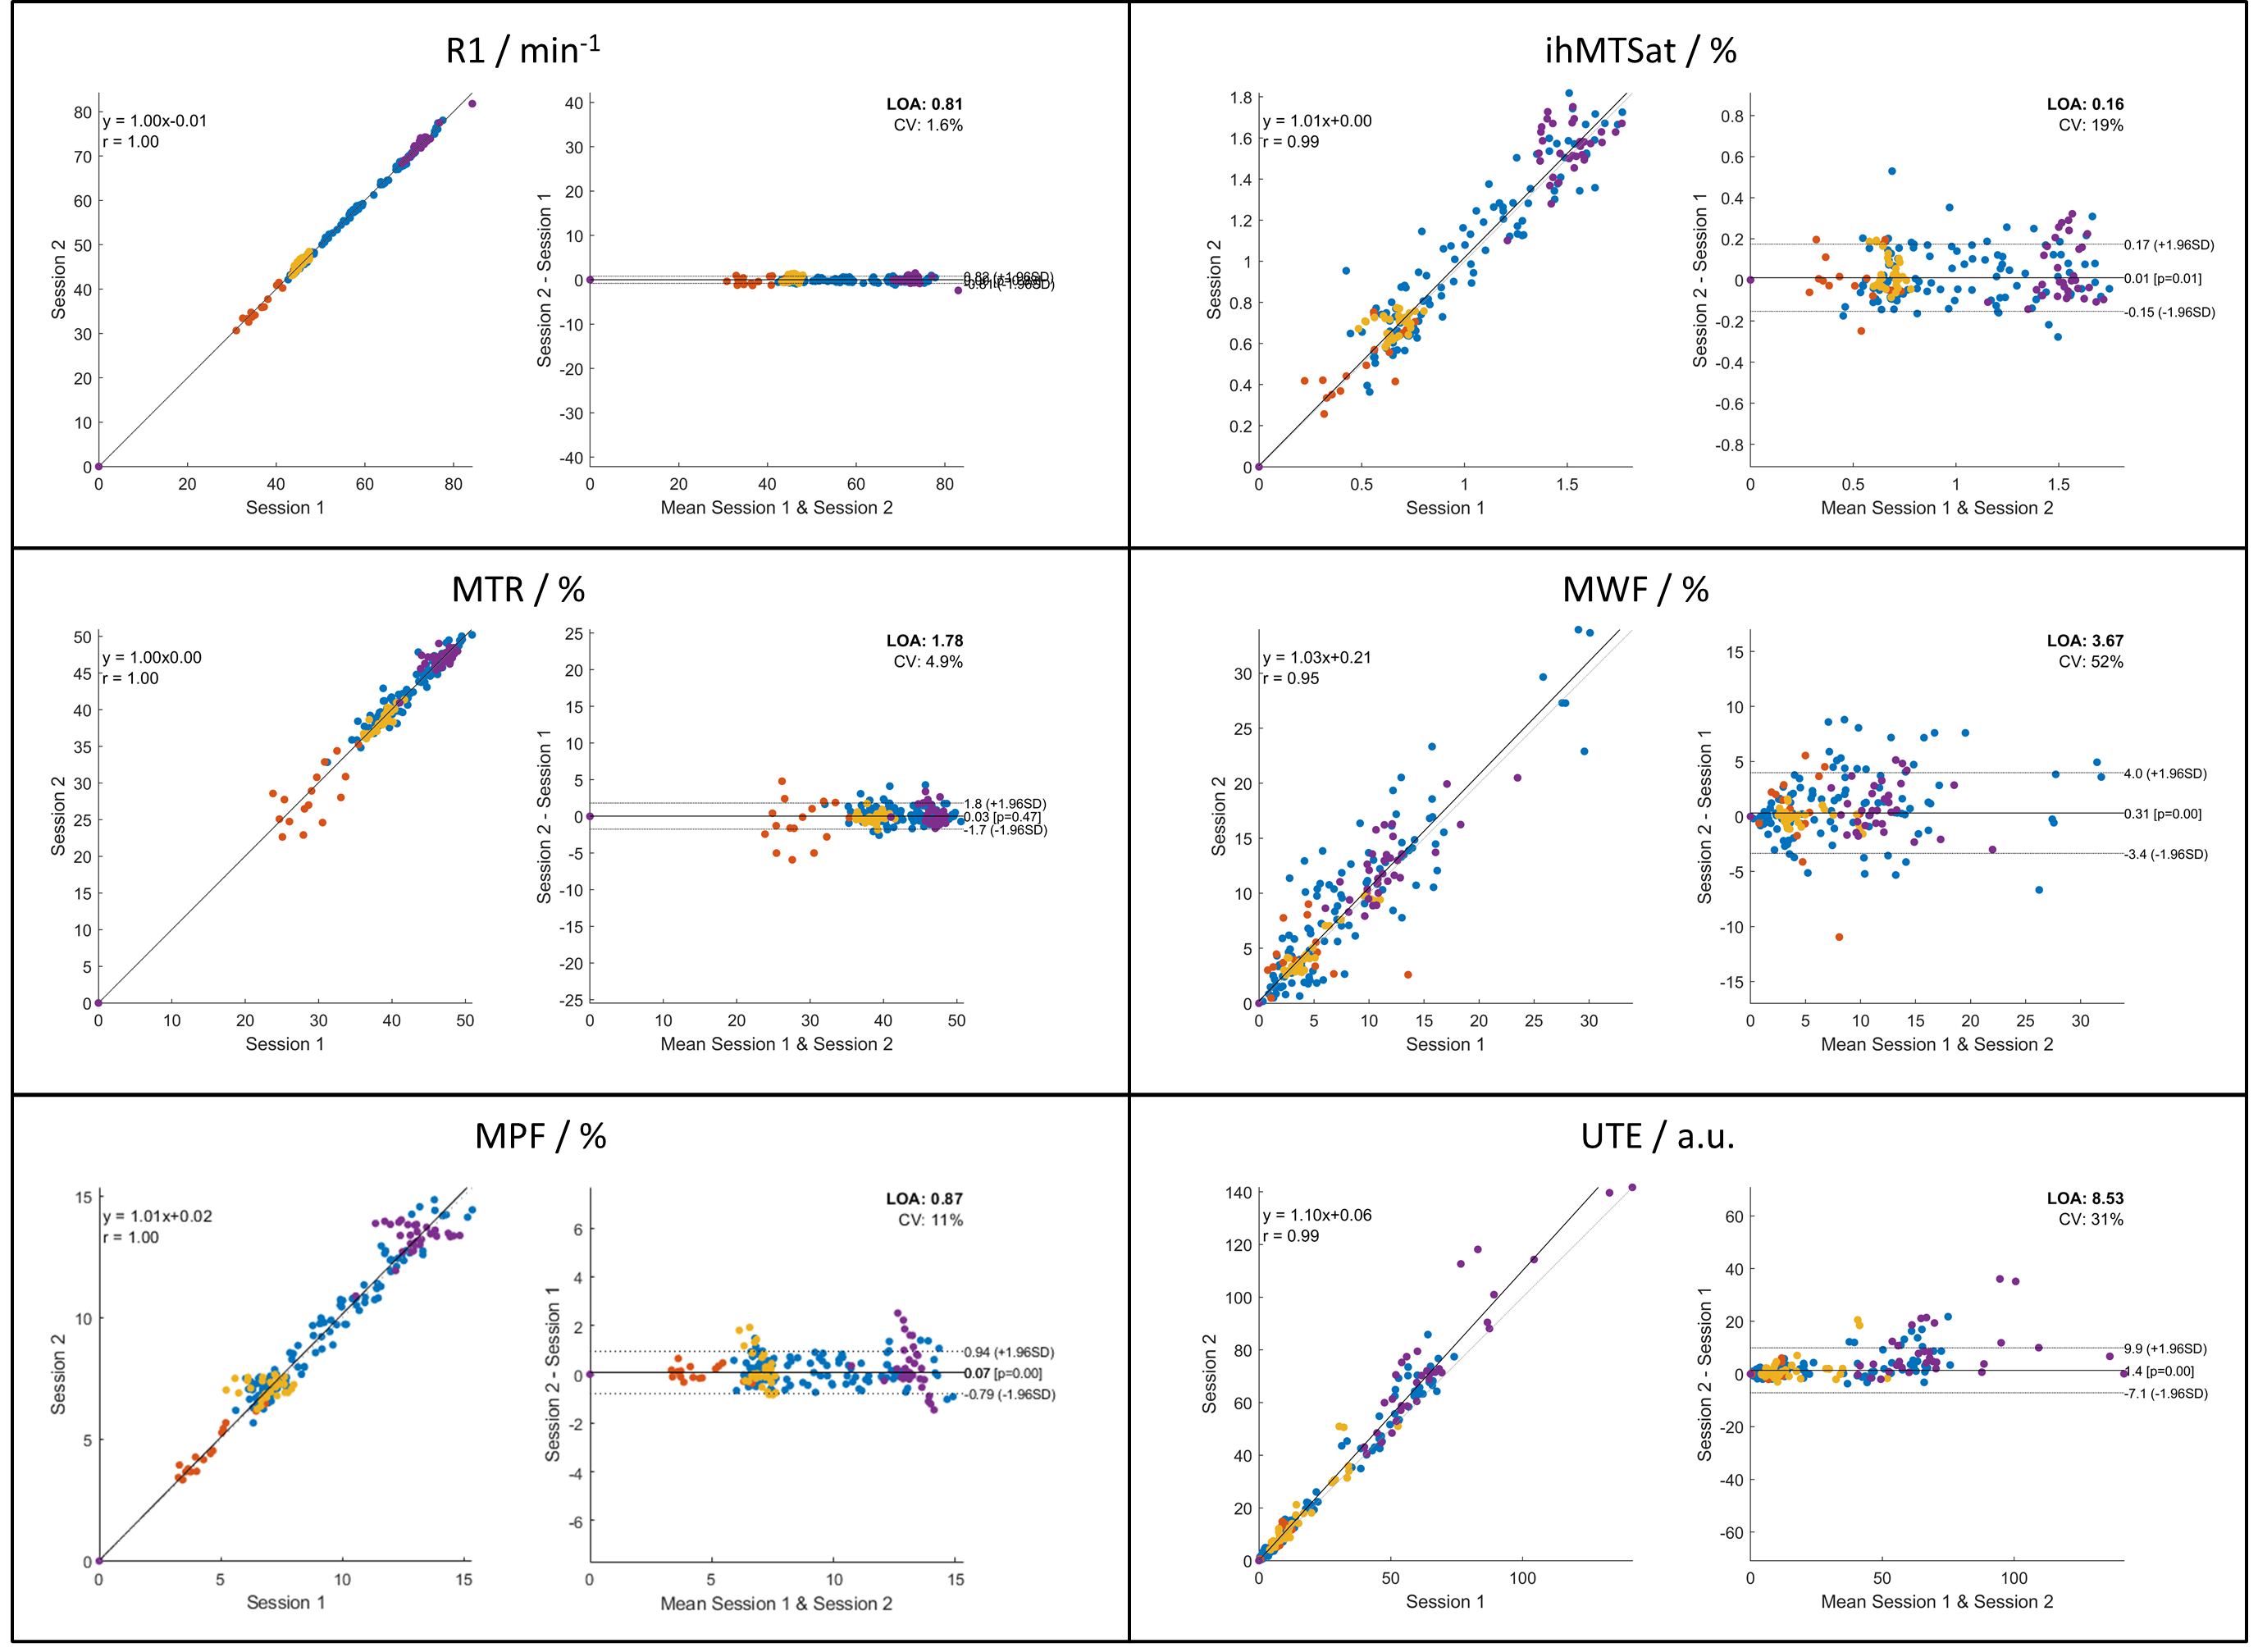
To test the reproducibility, mean regional myelin values were extracted from all contrasts and both sessions as previously described. For each method, the values from the two sessions were used in a Bland-Altman analysis to calculate the bias, limits of agreement (LOA), and coefficient of variation (CV).
Results & Discussion
Representative images from one subject are shown in Figure 1. Qualitatively, the contrast in the R1, MPF, and ihMTSat maps show more similarity in comparison to MWF and IR-UTE, which are more heterogeneous in the WM. Common hyperintensities among R1, MPF, ihMTSat, and MWF can be observed in structures known for high myelin content such as the genu of the corpus callosum (red arrows in Figure 1) or the cortico-spinal tract (especially in the internal capsule).The values that were extracted for the region-of-interest analysis are summarized as means across subjects in Table 2. In this table and the following analysis, the IR-UTE image intensities were treated as absolute values; it should, however, be noted that these intensities are not quantitative. The corresponding correlation matrix and scatter plots between all methods are shown in Figure 2. All methods correlated significantly (p<0.001) with each other. Underpinning the qualitative results, the highest correlation coefficients were found between R1, MPF, and ihMTSat. Notably, in the scatter plots between MWF and the other methods, outlier values appear at ~25-30% MWF. These values belong to the pallidum which shows a high value of MWF (see also Table 1).
The Bland-Altman plots for each method are shown in Figure 3. R1, MTR and MPF show good reproducibility. The CVs are 1.6% (R1), 4.9% (MTR), 11% (MPF), 19% (ihMTSat), 52% (MWF), and 31% (IR-UTE).
A major limitation of this study is that there is no ground truth (i.e. histology) available. Therefore, no conclusion can be made on which method probes myelin with the highest specificity, but rather how they compare to and complement each other and how reproducible they are. A comprehensive meta-analysis on specificity can be found by Mancini et al..20–22
Conclusion
We qualitatively and quantitatively compared six different methods for myelin imaging in the brain. We showed that R1, MTR, MPF, and ihMTSat correlated the most. R1 and MTR showed the best reproducibility. Using the results of this study, future research studies may be able to choose appropriate methods for myelin imaging considering specific acquisition time, resolution, expected contrast, and reproducibility requirements.Acknowledgements
No acknowledgement found.References
1. Reich DS, Lucchinetti CF, Calabresi AP. Multiple Sclerosis. N Engl J Med. 2018;378:169-180.
2. Tenembaum S, Chitnis T, Ness J, Hahn JS. Acute disseminated encephalomyelitis. Neurology. 2007. doi:10.1212/01.wnl.0000259404.51352.7f
3. Piredda GF, Hilbert T, Thiran JP, Kober T. Probing myelin content of the human brain with MRI: A review. Magn Reson Med. 2021. doi:10.1002/mrm.28509
4. Geeraert BL, Lebel RM, Mah AC, et al. A comparison of inhomogeneous magnetization transfer, myelin volume fraction, and diffusion tensor imaging measures in healthy children. Neuroimage. 2018;182:343-350. doi:10.1016/j.neuroimage.2017.09.019
5. Hagiwara A, Hori M, Kamagata K, et al. Myelin Measurement: Comparison Between Simultaneous Tissue Relaxometry, Magnetization Transfer Saturation Index, and T1w/T2w Ratio Methods. Sci Rep. 2018;8(1):10554. doi:10.1038/s41598-018-28852-6
6. Lema A, Bishop C, Malik O, et al. A Comparison of Magnetization Transfer Methods to Assess Brain and Cervical Cord Microstructure in Multiple Sclerosis. J Neuroimaging. 2017;27(2):221-226. doi:10.1111/jon.12377
7. Ercan E, Varma G, Mädler B, et al. Microstructural correlates of 3D steady-state inhomogeneous magnetization transfer (ihMT) in the human brain white matter assessed by myelin water imaging and diffusion tensor imaging. Magn Reson Med. 2018;80(6):2402-2414. doi:10.1002/mrm.27211
8. Mussard E, Hilbert T, Forman C, Meuli R, Thiran JP, Kober T. Accelerated MP2RAGE imaging using Cartesian phyllotaxis readout and compressed sensing reconstruction. Magn Reson Med. 2020. doi:10.1002/mrm.28244
9. Bonanno G, Hilbert T, Joseph A, et al. High-resolution magnetization transfer ratio maps using spiral-phyllotaxis Cartesian FLASH and compressed sensing in under five minutes. In: ISMRM. ; 2020.
10. Yarnykh VL, Bowen JD, Samsonov A, et al. Fast whole-brain three-dimensional macromolecular proton fraction mapping in multiple sclerosis. Radiology. 2015. doi:10.1148/radiol.14140528
11. Yarnykh VL. Fast macromolecular proton fraction mapping from a single off-resonance magnetization transfer measurement. Magn Reson Med. 2012. doi:10.1002/mrm.23224
12. Yarnykh VL. Time-efficient, high-resolution, whole brain three-dimensional macromolecular proton fraction mapping. Magn Reson Med. 2016. doi:10.1002/mrm.25811
13. Mchinda S, Varma G, Prevost VH, et al. Whole brain inhomogeneous magnetization transfer (ihMT) imaging: Sensitivity enhancement within a steady-state gradient echo sequence. Magn Reson Med. 2018. doi:10.1002/mrm.26907
14. Varma G, Munsch F, Burns B, et al. Three-dimensional inhomogeneous magnetization transfer with rapid gradient-echo (3D ihMTRAGE) imaging. Magn Reson Med. 2020. doi:10.1002/mrm.28324
15. Munsch F, Varma G, Taso M, et al. Characterization of the cortical myeloarchitecture with inhomogeneous magnetization transfer imaging (ihMT). Neuroimage. 2021. doi:10.1016/j.neuroimage.2020.117442
16. Piredda GF, Hilbert T, Canales-Rodríguez EJ, et al. Accelerating Multi-Echo GRASE with CAIPIRINHA for Fast and High-Resolution Myelin Water Imaging. In: Proceedings of the International Society of Magnetic Resonance in Medicine, Montreal, Canada. ; 2019.
17. Jang H, Ma Y, Searleman AC, et al. Inversion recovery UTE based volumetric myelin imaging in human brain using interleaved hybrid encoding. Magn Reson Med. 2020. doi:10.1002/mrm.27986
18. Schmitter D, Roche A, Maréchal B, et al. An evaluation of volume-based morphometry for prediction of mild cognitive impairment and Alzheimer’s disease. NeuroImage Clin. 2015;7:7-17. doi:10.1016/j.nicl.2014.11.001
19. Klein S, Staring M, Murphy K, Viergever MA, Pluim JPW. elastix: a toolbox for intensity-based medical image registration. IEEE Trans Med Imaging. 2010;29(1):196-205. doi:10.1109/TMI.2009.2035616
20. Mancini M, Karakuzu A, Cohen-Adad J, Cercignani M, Nichols TE, Stikov N. An interactive meta-analysis of MRI biomarkers of Myelin. Elife. 2020. doi:10.7554/eLife.61523
21. Lazari A, Lipp I. Can MRI measure myelin? Systematic review, qualitative assessment, and meta-analysis of studies validating microstructural imaging with myelin histology. bioRxiv. 2020.
22. van der Weijden CWJ, García DV, Borra RJH, et al. Myelin quantification with MRI: A systematic review of accuracy and reproducibility. Neuroimage. 2021. doi:10.1016/j.neuroimage.2020.117561
Figures