0093
Mapping of Thalamic Matrix and Core Nuclei using QSM at 9.4 Tesla1Max Planck Institute for Biological Cybernetics, Tuebingen, Germany, 2Biomedical Magnetic Resonance, University Hospital and Eberhard-Karl’s University, Tuebingen, Germany
Synopsis
The thalamus is a central connectivity hub of the human brain that remains poorly understood concerning its anatomy. Since it houses both calcium-rich neurons and myelin-rich architecture, quantitative susceptibility mapping at the ultra-high-field may facilitate thalamic substructures' characterization. Consequently, we have acquired high-resolution QSM data at 9.4 Tesla in 21 subjects and analyzed human thalamic nuclei with respect to core and matrix neurons. We found a more substantial contribution of both diamagnetic and paramagnetic sources, like iron, myelin, and calcium, in the matrix nuclei in contrast to the relay specific core nuclei matrix nuclei.
Introduction:
The matrix-core theory states that the thalamocortical organization's fundamental principle is the presence of two types of thalamic nuclei and their corresponding pathways: the diffuse matrix pathway and the spatially selective core pathway 1,2. The matrix nuclei make synaptic connections with the superficial cortical layers, while neurons in the core connect to the middle layers 1,2. The neurons comprising the core propagate 'driving' information, whereas neurons consisting of the matrix play a more modulatory role 1. The calcium-binding proteins calbindin dominate in matrix nuclei while parvalbumin is more abundant in the core. Jones has shown that calcium-binding proteins are heterogeneously distributed in a complementary fashion within thalamic nuclei 1. Furthermore, as the thalamus is a densely myelinated connectivity hub containing both projecting and receiving fibers, we tried to obtain a detailed map of the thalamus and explore the importance of the core and matrix systems QSM data at 9.4 Tesla.Material and Methods:
Subjects and MRI acquisition: 21 healthy volunteers without any neurological disorders were screened through a qualified doctor's rigorous safety assessment and scanned at 9.4 T (Siemens Medical Solutions, Erlangen, Germany) using a 16-channel transmit/ 31-channel receive array 3. B1-mapping, anatomical MP2RAGE images 4 and mono-polar multi-echo 3D gradient echo (GRE) images with 5 echoes and echo times, TE=6-30ms in steps of 6ms; a repetition time TR=35ms; and nominal FA=11° with a voxel size of 375x375x800 μm were acquired with an axial prescription.Preprocessing: QSM maps were reconstructed and preprocessed using coil-offset correction and adaptive coil combination before Laplacian unwrapping, phase-based masking, as described previously 5, whole-slab phase-referencing followed by VSHARP background removal and dipole inversion using STI-studio. After coregistration to the anatomical images, the QSM maps were normalized to MNI space and were multiplied by 1000 to obtain standardized data in the ppb-range.
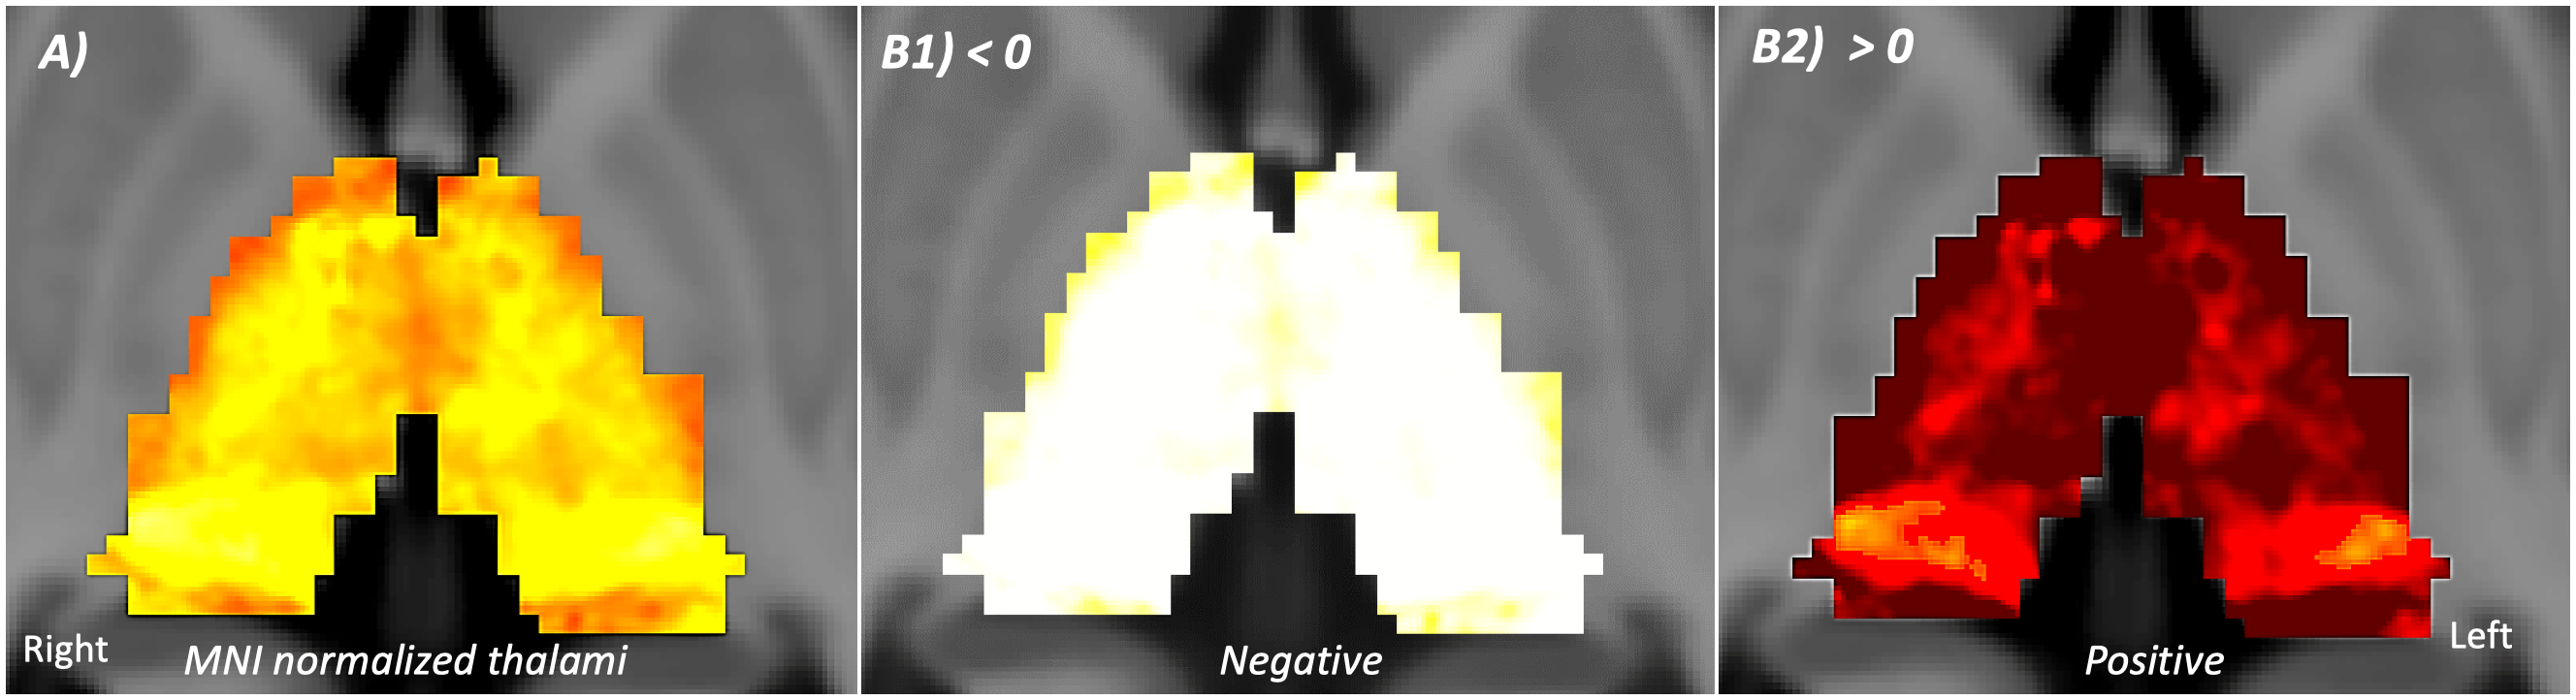
Postprocessing: The thalamic nuclei specific analysis was performed using the histology atlas of the thalamus 6. In the first step, the MNI spaced atlas was resliced to 400-micron native data resolution. Positive QSM values were assigned to paramagnetic maps, setting all other voxels to zero (>0) and vice versa; negative values (<0) were assigned to the diamagnetic maps. The next step, nuclei-specific QSM means, was computed for the left and right hemispheres for the data extracted from the diamagnetic and paramagnetic maps (s. Fig. 1). Violin and histogram plots were used for descriptive statistics in python to show all the values in their respective comparisons (s. Fig. 2-4).
Results:
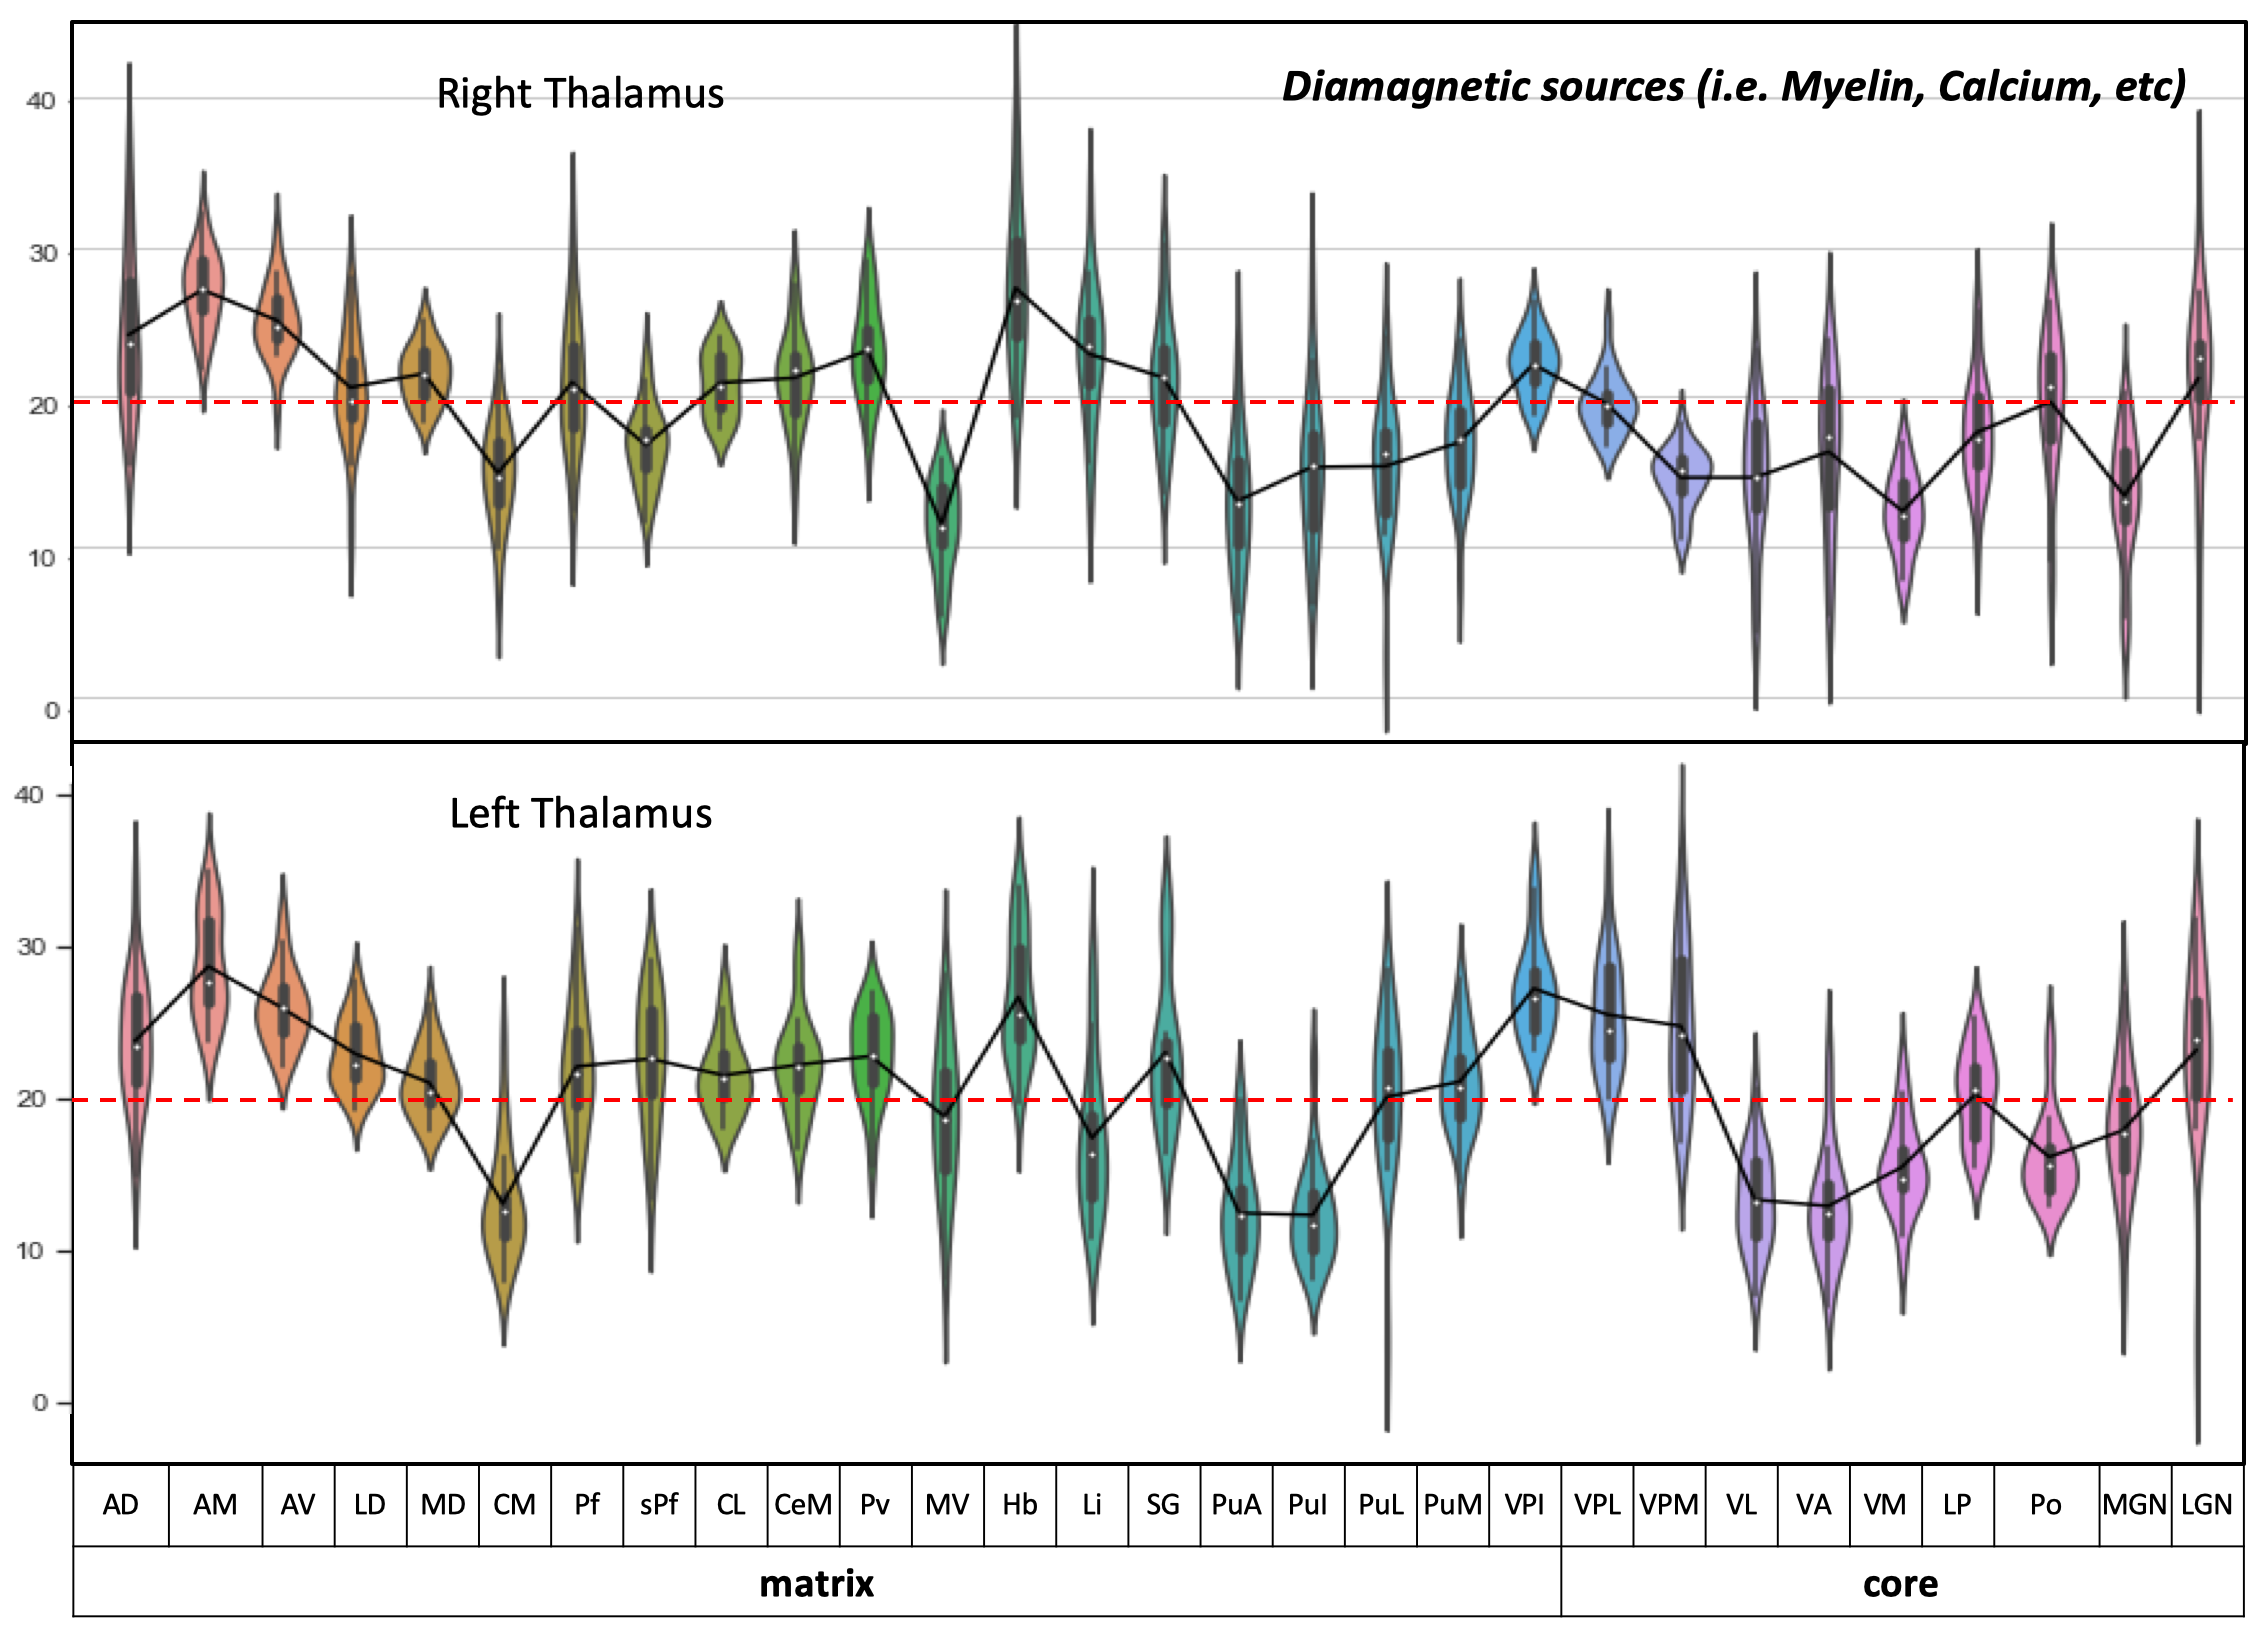
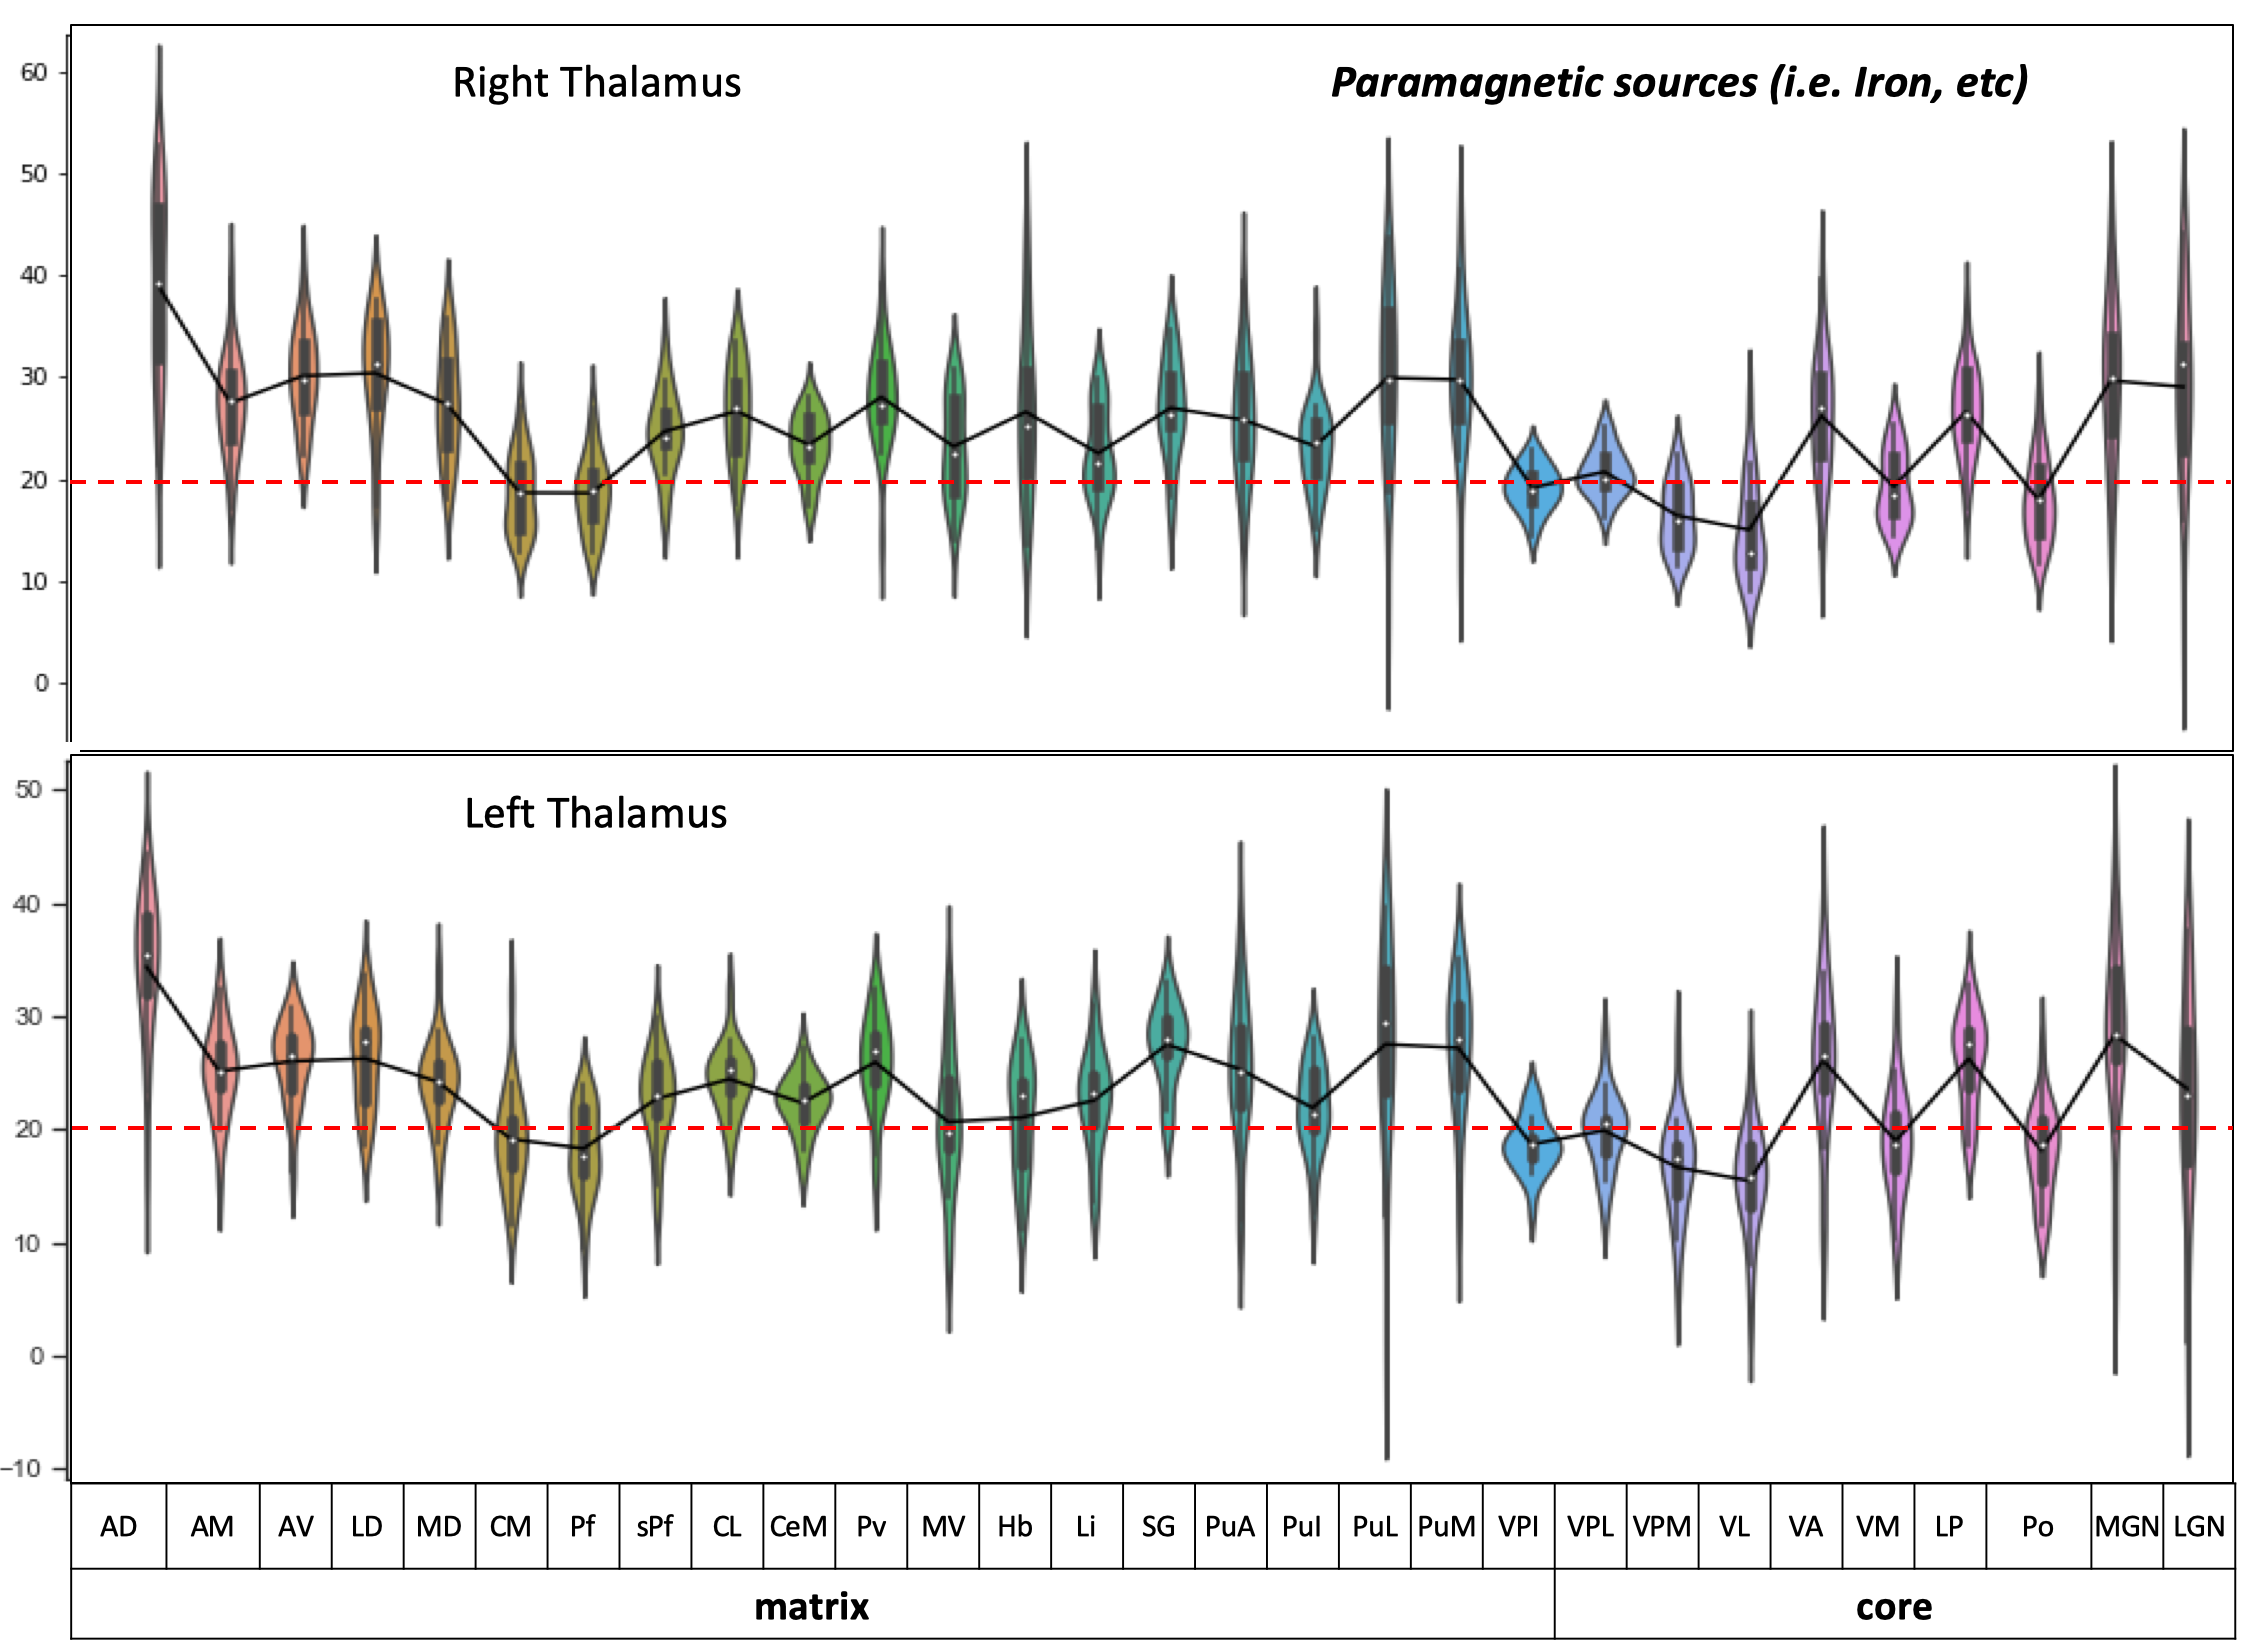
The standardized data (in ppb) were thresholded (at >0 & <0) for positive and negative values to show diamagnetic sources (i.e., myelin, calcium, etc. in negative values and paramagnetic sources, i.e., iron, etc., in positive values in separate QSM maps. An axial slice covering the thalamus depicts the performed thresholding for negative and positive values (s. Fig. 1). The negative map shows a homogeneous distribution of likely myelin-related QSM values within the thalamus. In contrast, the positive map shows increase values located mainly at the posterior, lateral, and intralaminar, midline nuclei (s. Fig. 1).The violin plots reveal interindividual variability in diamagnetic and paramagnetic values (s. Fig. 2 & 3). The average values across 21 subjects show that the core and matrix neurons' distribution differ across thalamic nuclei. The pattern for both the comparisons shows a somewhat similar trend and slight laterality differences (s. Fig. 2 & 3).
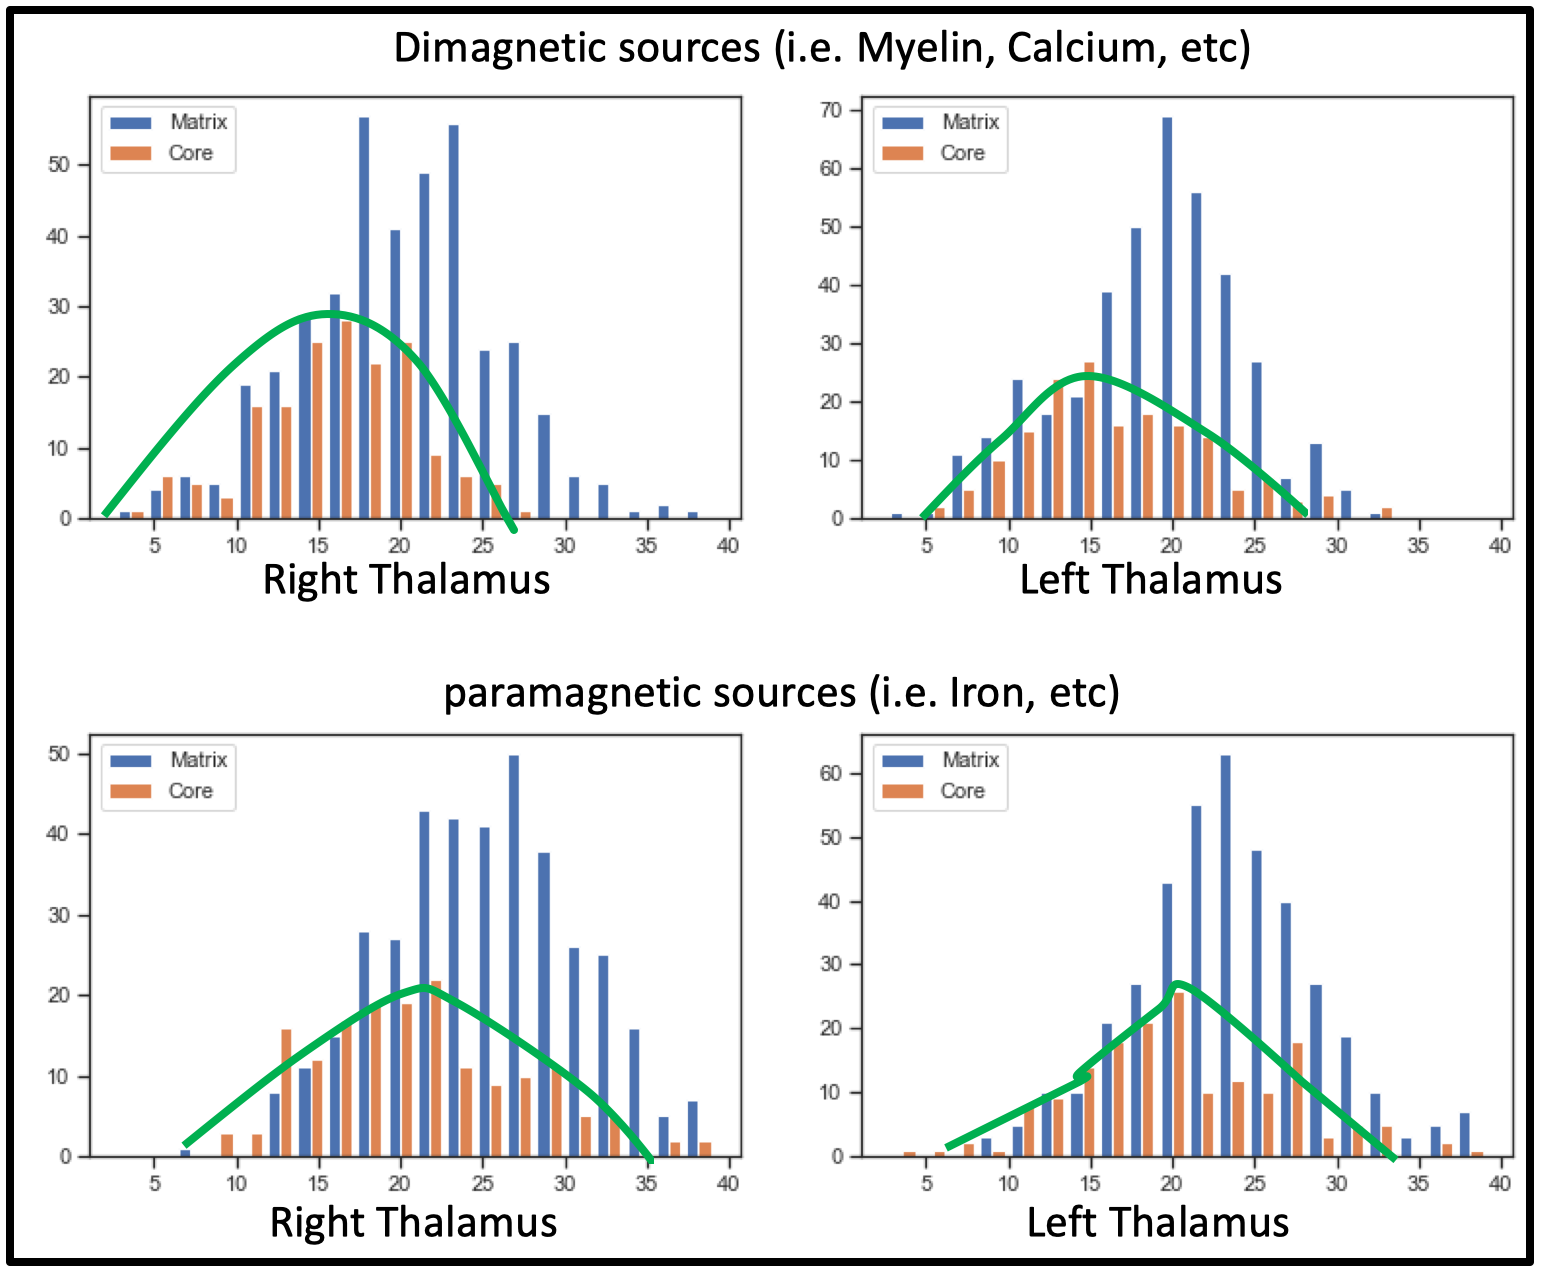
Comparing both kinds of nuclei show lower values for the core in contrast to higher values in specific Matrix nuclei, possibly indicating the stronger contribution of diamagnetic and paramagnetic sources, i.e., iron, myelin, calcium in specific matrix nuclei in contrast to relay specific core nuclei (s. Fig. 4)
Discussion:
The distribution of core and matrix neurons is not uniform across thalamic nuclei 1, which seems to be depicted in our findings (s. Fig 2 & 3). The investigation of core and matrix nuclei remains very challenging due to smaller nuclei sizes and SNR. The deep encaged thalamus is hampered with lower resolution and signal to noise ratio at lower field strengths, i.e., 1.5, 3 & 7T. In contrast, 7T to 9.4T yields a 1.76 ± 0.13 boost of SNR 7. Secondly, some thalamic nuclei only possess 30K neurons and challenging to image even at higher field strength.Conclusion:
This preliminary study reveals a detailed nuclei-specific delineation of diamagnetic and paramagnetic sources in the thalamus' core and matrix nuclei. Interestingly we observed an increase of both effects for the matrix nuclei in contrast to the core nuclei. There are also slight differences between the hemispheres. However, future work is required to comprehend the relationship between QSM measures and the core-matrix system. Furthermore, a larger sample of data is needed to examine the effect of age and gender for a better understanding of the matrix and core system.Acknowledgements
This work was supported by the DFG (Grant number GZ: GR 833/13).References
1. Jones, E. G. Viewpoint: the core and matrix of thalamic organization. Neuroscience 85, 331–345 (1998). 2. Piantoni, G., Halgren, E. & Cash, S. S. The Contribution of Thalamocortical Core and Matrix Pathways to Sleep Spindles. Neural Plasticity vol. 2016 e3024342 https://www.hindawi.com/journals/np/2016/3024342/ (2016).
3. Shajan, G. et al. A 16-channel dual-row transmit array in combination with a 31-element receive array for human brain imaging at 9.4 T. Magn. Reson. Med. 71, 870–879 (2014).
4. Hagberg, G. E. et al. Whole brain MP2RAGE-based mapping of the longitudinal relaxation time at 9.4T. NeuroImage 144, 203–216 (2017).
5. Hagberg, G., Eckstein, K., Cuna, E., & Scheffler, K. Towards robust QSM in cortical and sub-cortical regions of the human brain at 9.4T: influence of coil combination and masking strategies. in 2020 ISMRM & SMRT Virtual Conference & Exhibition. (2020).
6. Krauth, A. et al. A mean three-dimensional atlas of the human thalamus: generation from multiple histological data. NeuroImage 49, 2053–2062 (2010).
7. Pohmann, R., Speck, O. & Scheffler, K. Signal-to-noise ratio and MR tissue parameters in human brain imaging at 3, 7, and 9.4 tesla using current receive coil arrays. Magn. Reson. Med. 75, 801–809 (2016).
Figures