0091
MULTI-Parametric MR imaging with fLEXible modular design (MULTIPLEX)1UIH America, Inc., Houston, TX, United States, 2United Imaging Healthcare, Shanghai, China
Synopsis
We have developed a GRE based multi-parametric MR imaging method with flexible modular design, namely MULTIPLEX. Featuring a design of dual-TR, dual-FA and multi-echo, one single MULTIPLEX scan can provide multiple imaging contrasts and quantitative mappings with 3D high resolution within clinically friendly duration, including T1W, PDW, augmented T1W (aT1W), SWI and T1/T2*/PD/QSM maps, as well as optional MRA images.
Introduction
Multi-contrast MRI techniques can be developed using any type of basic acquisition scheme1-3, and GRE with signal spoiling4 may have certain advantages, including 3D high resolution (e.g. sub-millimeter) imaging capacity, high data acquisition efficiency, well-formulated signal models and flexibility in sequence design and acceleration implementations. The challenge of adopting GRE for multi-contrast imaging mainly lies in T1 mapping, which is tightly coupled with the RF B1t field5. A general solution is to separately collect and estimate B1t field for T1 map correction5, with the assumption of B1t-flip angle linearity and at the cost of additional scan time. Recent attempts, mostly proposed along with multi-contrast methods, include assuming B1t insensitivity6,7, or using the same data to extract both B1t and T1 maps1,3.In this work, we introduce a GRE based multi-contrast imaging method, namely multi-parametric MR imaging with flexible modular design, or MULTIPLEX, as a single-scan solution for multiple imaging contrasts and accurate quantitative mapping (including B1t and T1 maps) with 3D high resolution, high SNR and scan efficiency.
Methods
An exemplary design of the MULTIPLEX sequence is shown in Fig.1. Acq1 and Acq2 each contains a dual-TR unit similar to that of the actual flip angle (AFI) technique8. Within each TR (i.e. TR1 and TR2), a number (i.e. N1 and N2) of gradient echoes are acquired. Additionally, flow modulation (FM) blocks may be flexibly inserted. Each Acq module uses different flip angles (e.g. α1/α2), and each TR module has different number of echoes and/or different FM functions (including on/off states). For simplicity, following discussions assume α1< α2, N1< N2 and TR1<TR2.With flip angle αi (i∈[1,2])), echo times TEj (j∈[1,N1]) and TEk (k∈[1,N2]), the image signal for TR1 (i.e. S1) and TR2 (i.e. S2) are8:
$$ S_{1}(\alpha_{i},TE_{j},C_{p})=W_{p}M_{0}sin(\alpha_{i})\bullet\frac{1-E_{2}+(1-E_{1})E_{2}cos(\alpha_{i})}{1-E_{1}E_{2}cos^{2}(\alpha_{i})}e^{-TE_{j}/T_2^*}e^{-i(\Delta\omega TE_{j}+\varphi_{p}+\varphi_{0})} [1] $$
$$ S_{2}(\alpha_{i},TE_{k},C_{p})=W_{p}M_{0}sin(\alpha_{i})\bullet\frac{1-E_{1}+(1-E_{2})E_{1}cos(\alpha_{i})}{1-E_{1}E_{2}cos^{2}(\alpha_{i})}e^{-TE_{k}/T_2^*}e^{-i(\Delta\omega TE_{k}+\varphi_{p}+\varphi_{0})} [2]$$
Where M0 is the baseline signal associated with proton density, Δω represents the off-resonance effects (both global and local) , Wp and φp are the modulus weight and phase component of the pth coil channel’s sensitivity profile Cp, and φ0 is the constant baseline phase. E1 and E2 represent $$$e^{-TR_{1}/T_{1}}$$$and $$$e^{-TR_{2}/T_{1}}$$$, respectively. The following outcome can be obtained via corresponding image processing methods on the 2(N1+N2) sets of direct images:
- Composited PDW and T1W images (cPDW and cT1W): Weighted averaging of all Acq1 images for cPDW, and of all Acq2 images for cT1W.
- B1t mapping: Applying AFI on the images of the first N1 echoes in TR1 and TR2 from Acq2. Acq1 images were not used as α1 is too small (set for PDW) for AFI to work properly8.
- T1 mapping: Assume both TR1 and TR2<<T1, let k=TR1/T1 and nk=TR2/T1 , an analytic solution of k can be extracted from Eqs.1 and 2 in the form of $$$ak^{2}+bk+c=0$$$, and thus T1=TR1/k. With the B1t map from step 2), a corrected T1 map can be obtained.
- T2*/R2* maps: Applying MDI method9 on the 2N2 sets of echo images from both Acq modules. In principle, one can use any T2*/R2* mapping method.
- PD map: Placing B1t, T1 and T2* maps into Eqs.1 & 2, individual PD maps can be extracted from each echo and then averaged. The averaged PD map can then be spatially normalized to reduce the spatial variation associated with coil sensitivity.
- Augmented T1W (aT1W) images: Defined as the signal ratio between T1W and PDW signals, i.e. $$$S_{aT1W}=S(\alpha_{2})/S(\alpha_{1})$$$ , to eliminated non-T1 factors for pure T1 weightings.
- SWI: Generated using a multi-echo SWI method10 based on the 2N2 sets of echo images from both Acq modules. In principle, one can use any multi-echo SWI method.
- QSM: Generated using a L2-norm optimization method with dynamic streaking artifact regularization11. In principle, one can use any QSM method.
- MRA (optional): Optionally, FM modules can be inserted to create dark blood (w/ flow dephasing) and bright blood (w/ flow compensation) images, and generate high contrasting MRA images via subtraction12.
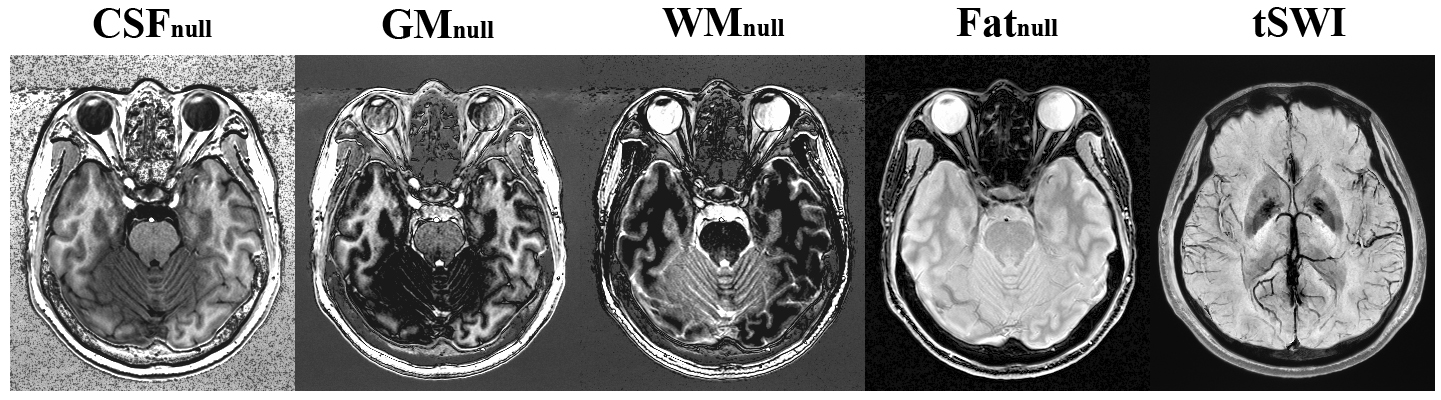
- Virtual images: Using respective Block signal models and the calculated T1/T2*/PD/QSM maps, one can generate images with arbitrary virtual contrasts, such as inversion recovery (IR), double IR, PSIR, true SWI (tSWI)13, etc.
Results
Fig.2 shows the directly reconstructed echo images of MULTIPLEX, and Fig.3 shows the calculated images as described above. Fig.4 shows the quantification results on the system phantom. Fig.5 shows virtual image examples simulated based on the resultant quantitative maps.Discussion & Conclusion
We have demonstrated that, one single scan of the proposed MULTIPLEX MR method offers multiple series of results, including contrasting images of cPDW, cT1W, aT1W and SWI, as well as quantitative mappings of PD, T1, T2*(R2*), B1 and QSM. With the multi-parametric design and the use of MDI processing strategy, MULTIPLEX images were of excellent quality and high SNR, and high accuracy for quantitative mappings. The total scan time were ~7.5min for high resolution 3D imaging, making MULTIPLEX MR clinically friendly.In summary, MULTIPLEX MR has the potential for high resolution, high SNR, high accuracy multi-contrast imaging applications in clinical and academic contexts.
Acknowledgements
References
1. Chen Y, Liu S, Wang Y, Kang Y, Haacke EM. STrategically Acquired Gradient Echo (STAGE) imaging, part I: Creating enhanced T1 contrast and standardized susceptibility weighted imaging and quantitative susceptibility mapping. Magn Reson Imaging 2018;46:130-139.
2. Warntjes JB, Dahlqvist O, Lundberg P. Novel method for rapid, simultaneous T1, T2*, and proton density quantification. Magn Reson Med 2007;57(3):528-537.
3. Ma D, Gulani V, Seiberlich N, Liu K, Sunshine JL, Duerk JL, Griswold MA. Magnetic resonance fingerprinting. Nature 2013;495(7440):187-192.
4. Haacke EM, Brown R, Thompson M, Venkatesan R. Magnetic resonance imaging. Physical principles and sequence design. New York: Wiley-Liss; 1999. 32-45 p.
5. Deoni SC. High-resolution T1 mapping of the brain at 3T with driven equilibrium single pulse observation of T1 with high-speed incorporation of RF field inhomogeneities (DESPOT1-HIFI). J Magn Reson Imaging 2007;26(4):1106-1111.
6. Ma S, Nguyen CT, Han F, Wang N, Deng Z, Binesh N, Moser FG, Christodoulou AG, Li D. Three-dimensional simultaneous brain T1 , T2 , and ADC mapping with MR Multitasking. Magn Reson Med 2020;84(1):72-88.
7. Metere R, Kober T, Moller HE, Schafer A. Simultaneous Quantitative MRI Mapping of T1, T2* and Magnetic Susceptibility with Multi-Echo MP2RAGE. PLoS One 2017;12(1):e0169265.
8. Yarnykh VL. Actual flip-angle imaging in the pulsed steady state: a method for rapid three-dimensional mapping of the transmitted radiofrequency field. Magn Reson Med 2007;57(1):192-200.
9. Ye Y, Lyu J. MR Relaxivity Mapping using multi-dimensional integrated (MDI) complex signal ratio. 2019; Montreal. p 1356.
10. Ye Y, Zong J, Lyu J, Zhang W. SWI+: A roubust artifact-free SWI procedure with improved contrast. 2018; Paris, France. p 4135.
11. Ye Y, Li X, Zhang Q, Zhou F, Li M, Qing Z, Zhang B, Zhang S, Chen Y, Zong J. Dynamic streaking artifact regularization for QSM. 2019; Montreal. p 4543.
12. Ye Y, Hu J, Wu D, Haacke EM. Noncontrast-enhanced magnetic resonance angiography and venography imaging with enhanced angiography. J Magn Reson Imaging 2013;38(6):1539-1548.
13. Liu S, Mok K, Neelavalli J, Cheng Y-CN, Tang J, Ye Y, Haacke EM. Improved MR venography using quantitative susceptibility-weighted imaging. Journal of Magnetic Resonance Imaging 2014:40(3):698-708
Figures