0086
Noninvasive Detection of Changes in Membrane Potential with MR Measurements1Laboratory for Imaging Science and Technology, Department of Electrical and Computer Engineering, Seoul National Univeristy, Seoul, Korea, Republic of, 2Department of Physiology, Samsung Biomedical Research Institute, Sungkyunkwan University School of Medicine, Suwon, Korea, Republic of, 3Department of Biomedical Engineering, Sungkyunkwan University, Suwon, Korea, Republic of, 4Department of Intelligent Precision Healthcare Convergence, Sungkyunkwan University, Suwon, Korea, Republic of, 5Center for Neuroscience Imaging Research, Institute for Basic Science, Suwon, Korea, Republic of
Synopsis
In this study, the relationships between changes in cell membrane potential and MR measurements of T1, T2, and qMT parameters were examined using a neuroblastoma cell line (SH-SY5Y) as an in vitro model. When the membrane potential was depolarized from -37.7 mV to −7.5 mV, the changes in MR parameters were: T1, +4.29%; T2, +21.2%; pool size ratio (PSR), −12.4%. Contrarily, when the membrane potential was hyperpolarized to −43.0 mV, the changes in MR parameters were: T1, −3.40%; T2, −10.0%; PSR, +6.97%. These observations are expected to be utilized to noninvasively detect changes in the membrane potential of cells.
Introduction
Membrane potential has been considered an important property of cells. It affects various cell signaling processes such as the excitability of neurons and cell proliferation.1 In addition, many diseases, such as hypokalemia, are related to membrane potential.2 For measuring membrane potential, methods like patch-clamp technique3 and fluorescence microscopy4 have been utilized. However, these methods are often invasive or have a short penetration depth.5 The objective of this study is to measure changes in MR parameters when the membrane potential is altered and assess the ability of MRI as a noninvasive tool to detect changes in membrane potential. We used a neuroblastoma cell line (SH-SY5Y) as an in vitro model and adjusted their membrane potential with extracellular medium. Changes in membrane potential of SH-SY5Y cells were examined by MR measurements of T1, T2, and quantitative magnetization transfer (qMT), followed by a patch-clamp experiment for confirming the change in membrane potential with extracellular medium.Methods
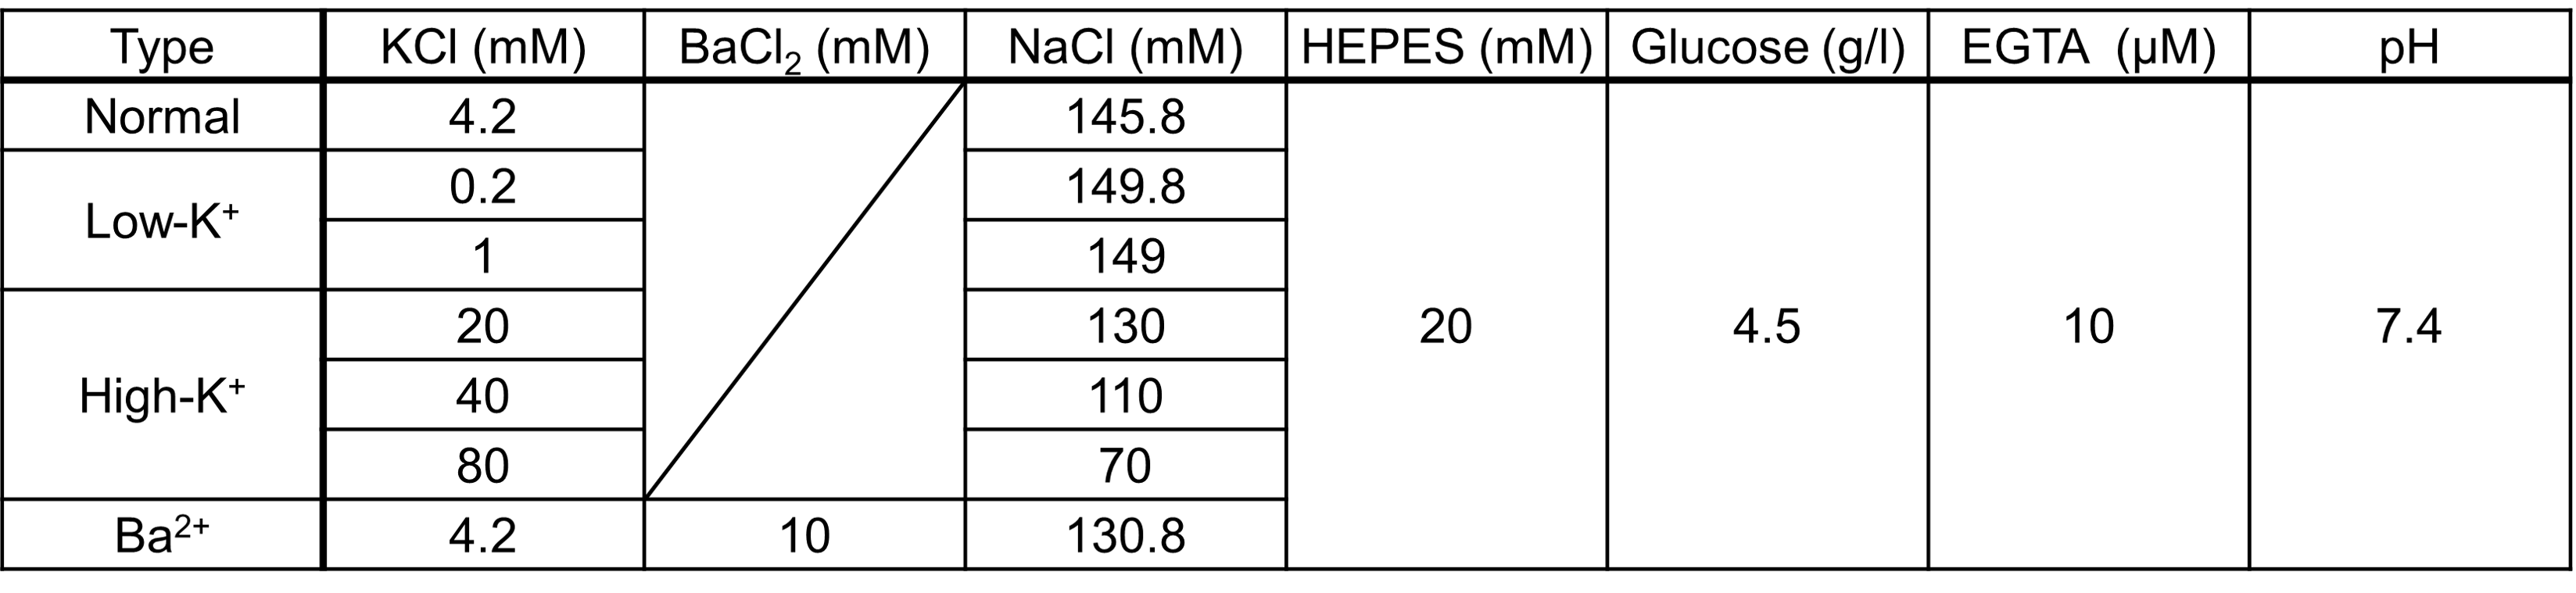
Cell culture. An immortalized human neuroblastoma cell line, SH-SY5Y, was cultured in DMEM/F12, with 10% fetal bovine serum, 100 units/ml penicillin, and 100 µg/ml streptomycin at 37°C and 5% CO2.Preparation of cell samples for MR measurement. SH-SY5Y cells were harvested using a solution of trypsin-EDTA. These cells were centrifuged and concentrated as a 70 µl pellet. The cell pellet was resuspended in the culture medium and equally divided into seven aliquots. We also prepared seven different media to control the cell membrane potential. These media differed in [K+] ranging from 0.2 mM to 80 mM, or in [Ba2+] of 0 or 10 mM, which is a K+ channel blocker. The composition of the extracellular medium is detailed in Fig. 1. Each cell suspension was centrifuged and resuspended in the seven different media. Centrifugation and resuspension were repeated two times more to completely clear out the culture medium. Then, each cell suspension was loaded into each drilled well on a sphere-like acrylic piece for MR measurement, which was centrifuged again to be concentrated as a pellet.
MR acquisition and analysis. MR experiments were performed on a 9.4 T Bruker MRI. The cell-containing wells on the acrylic piece were aligned one-dimensionally, thus the signals from different cell samples were separated by one-dimensional (frequency) encoding. For T1 and qMT estimation, an inversion recovery sequence was used and acquired signals were fitted to a bi-exponential function.6 The estimated qMT parameters were pool size ratio (PSR) and MT rate from macromolecules to free water (kmf). For T2 estimation, a single-echo spin-echo sequence with varying echo times was used and acquired signals were fitted to a mono-exponential function. The number of trials were four (n=4).
Patch-clamp. Membrane potentials of SH-SY5Y cells (n=3) were recorded using the whole-cell mode of the patch-clamp technique. Bath solutions were the same as the media used for the MR experiments, and these were perfused constantly at a flow rate of 2 ml/min. The composition of pipette solution was (in mM): KCl, 140; NaCl, 5; MgCl2, 3; HEPES, 10; Mg-ATP, 1; Na-GTP, 0.5; adjusted to pH 7.4 with KOH.
Results
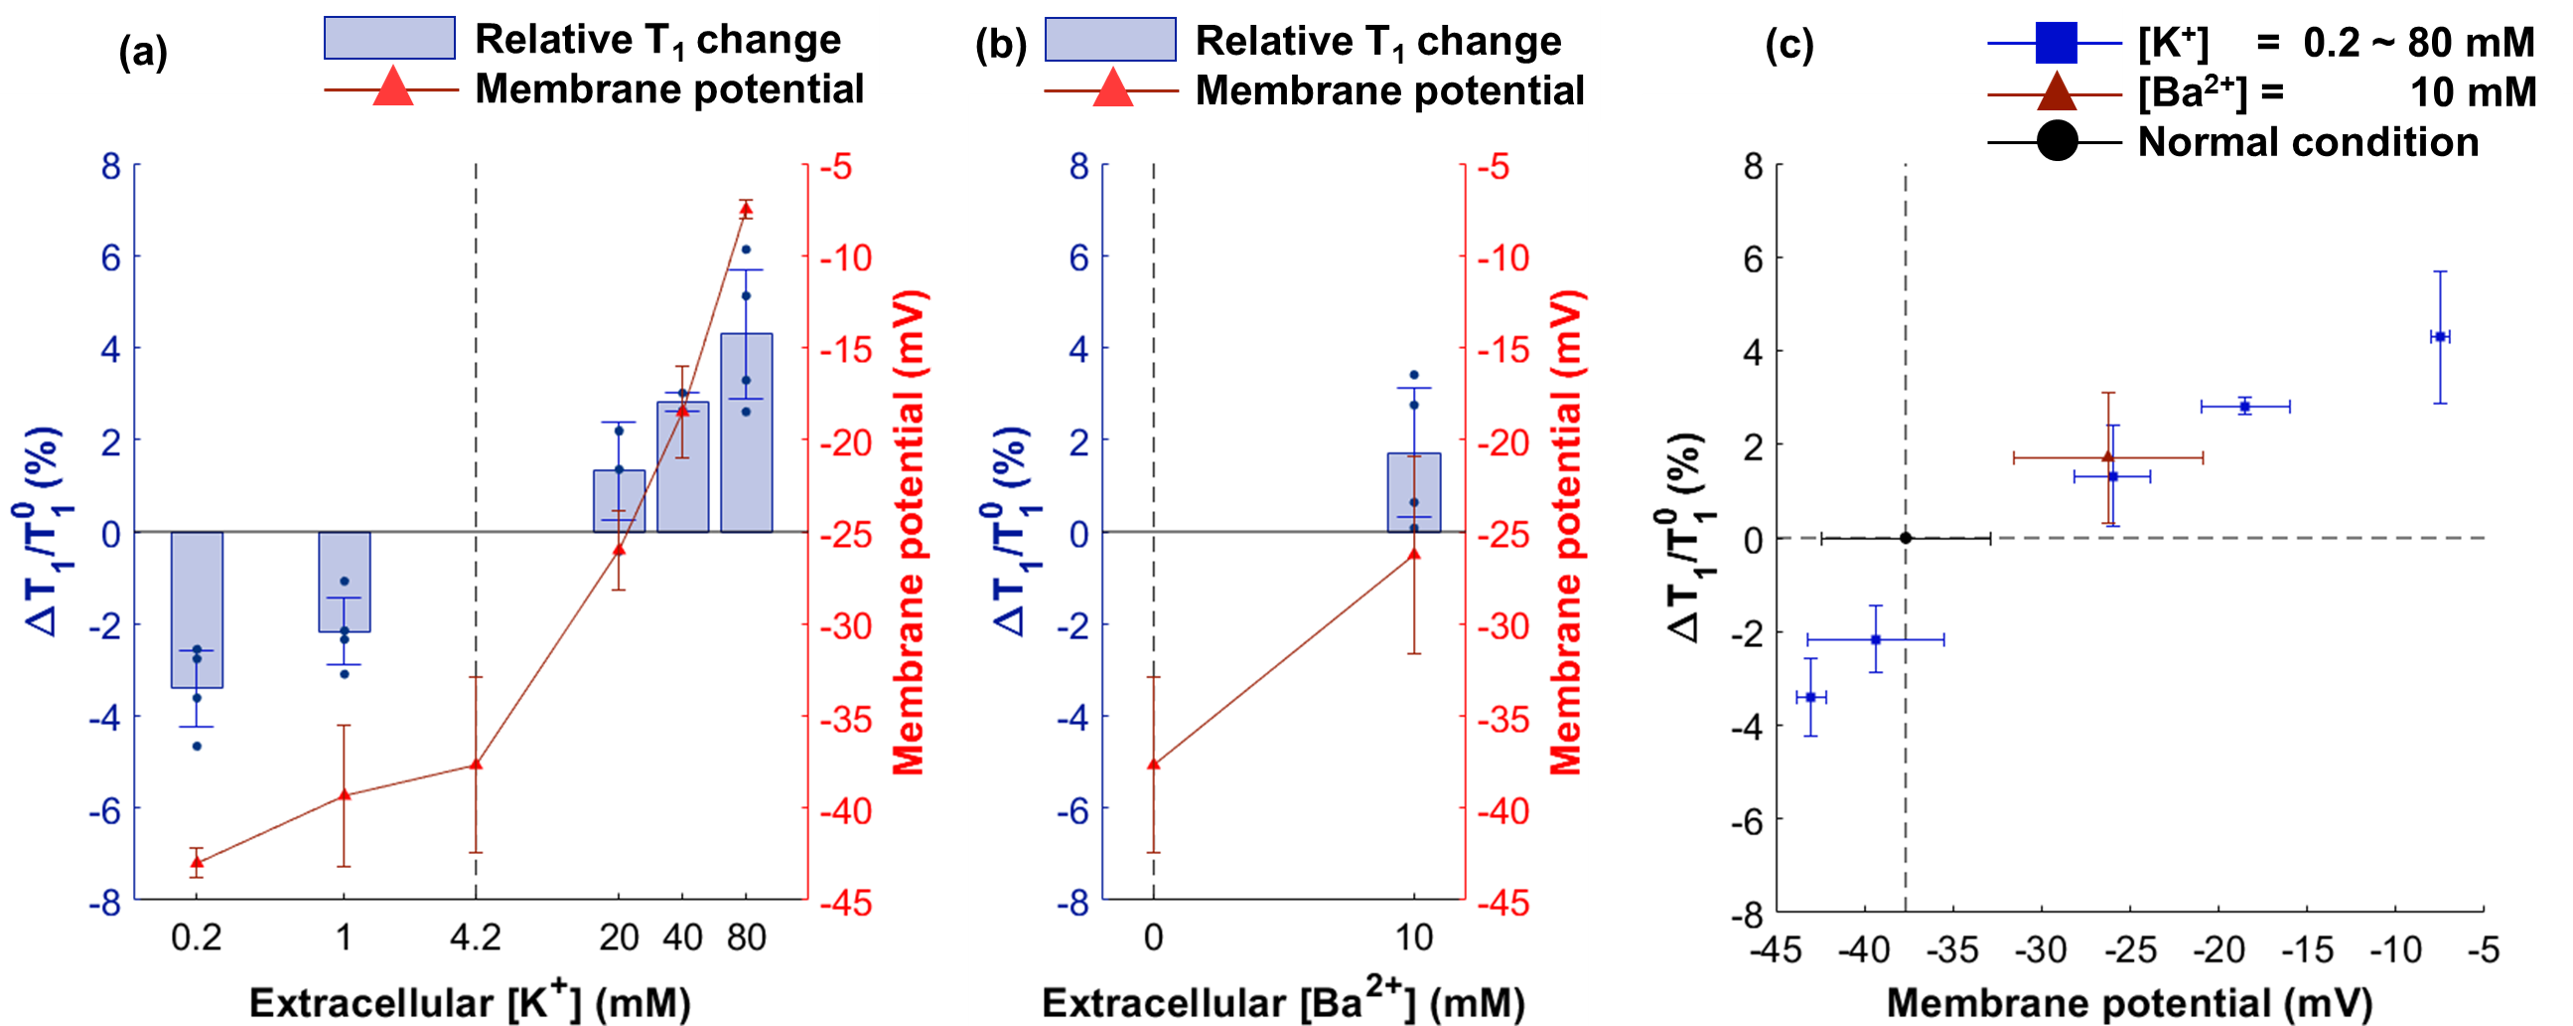
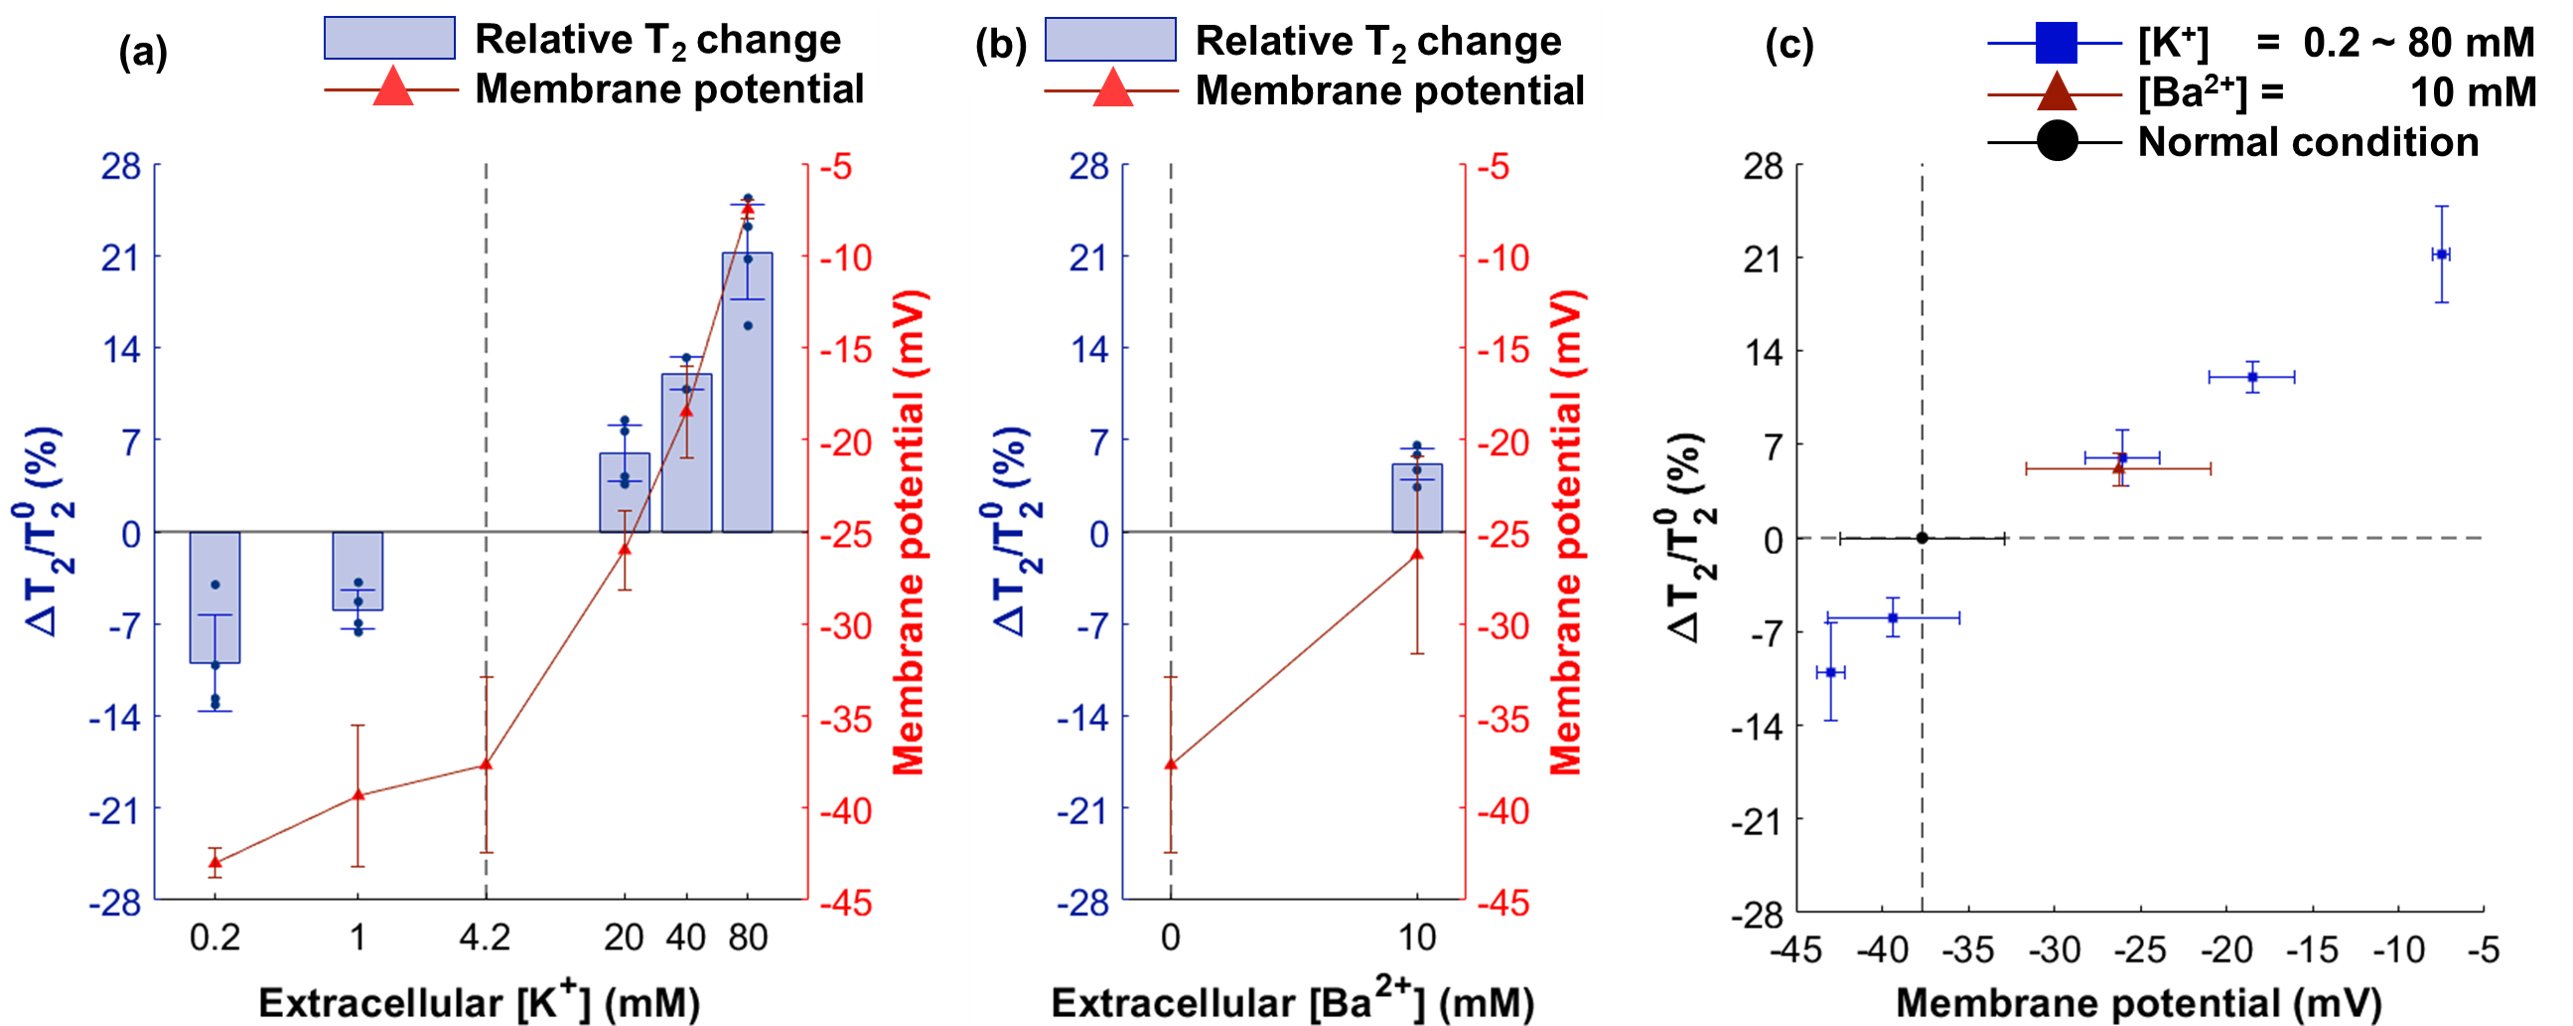
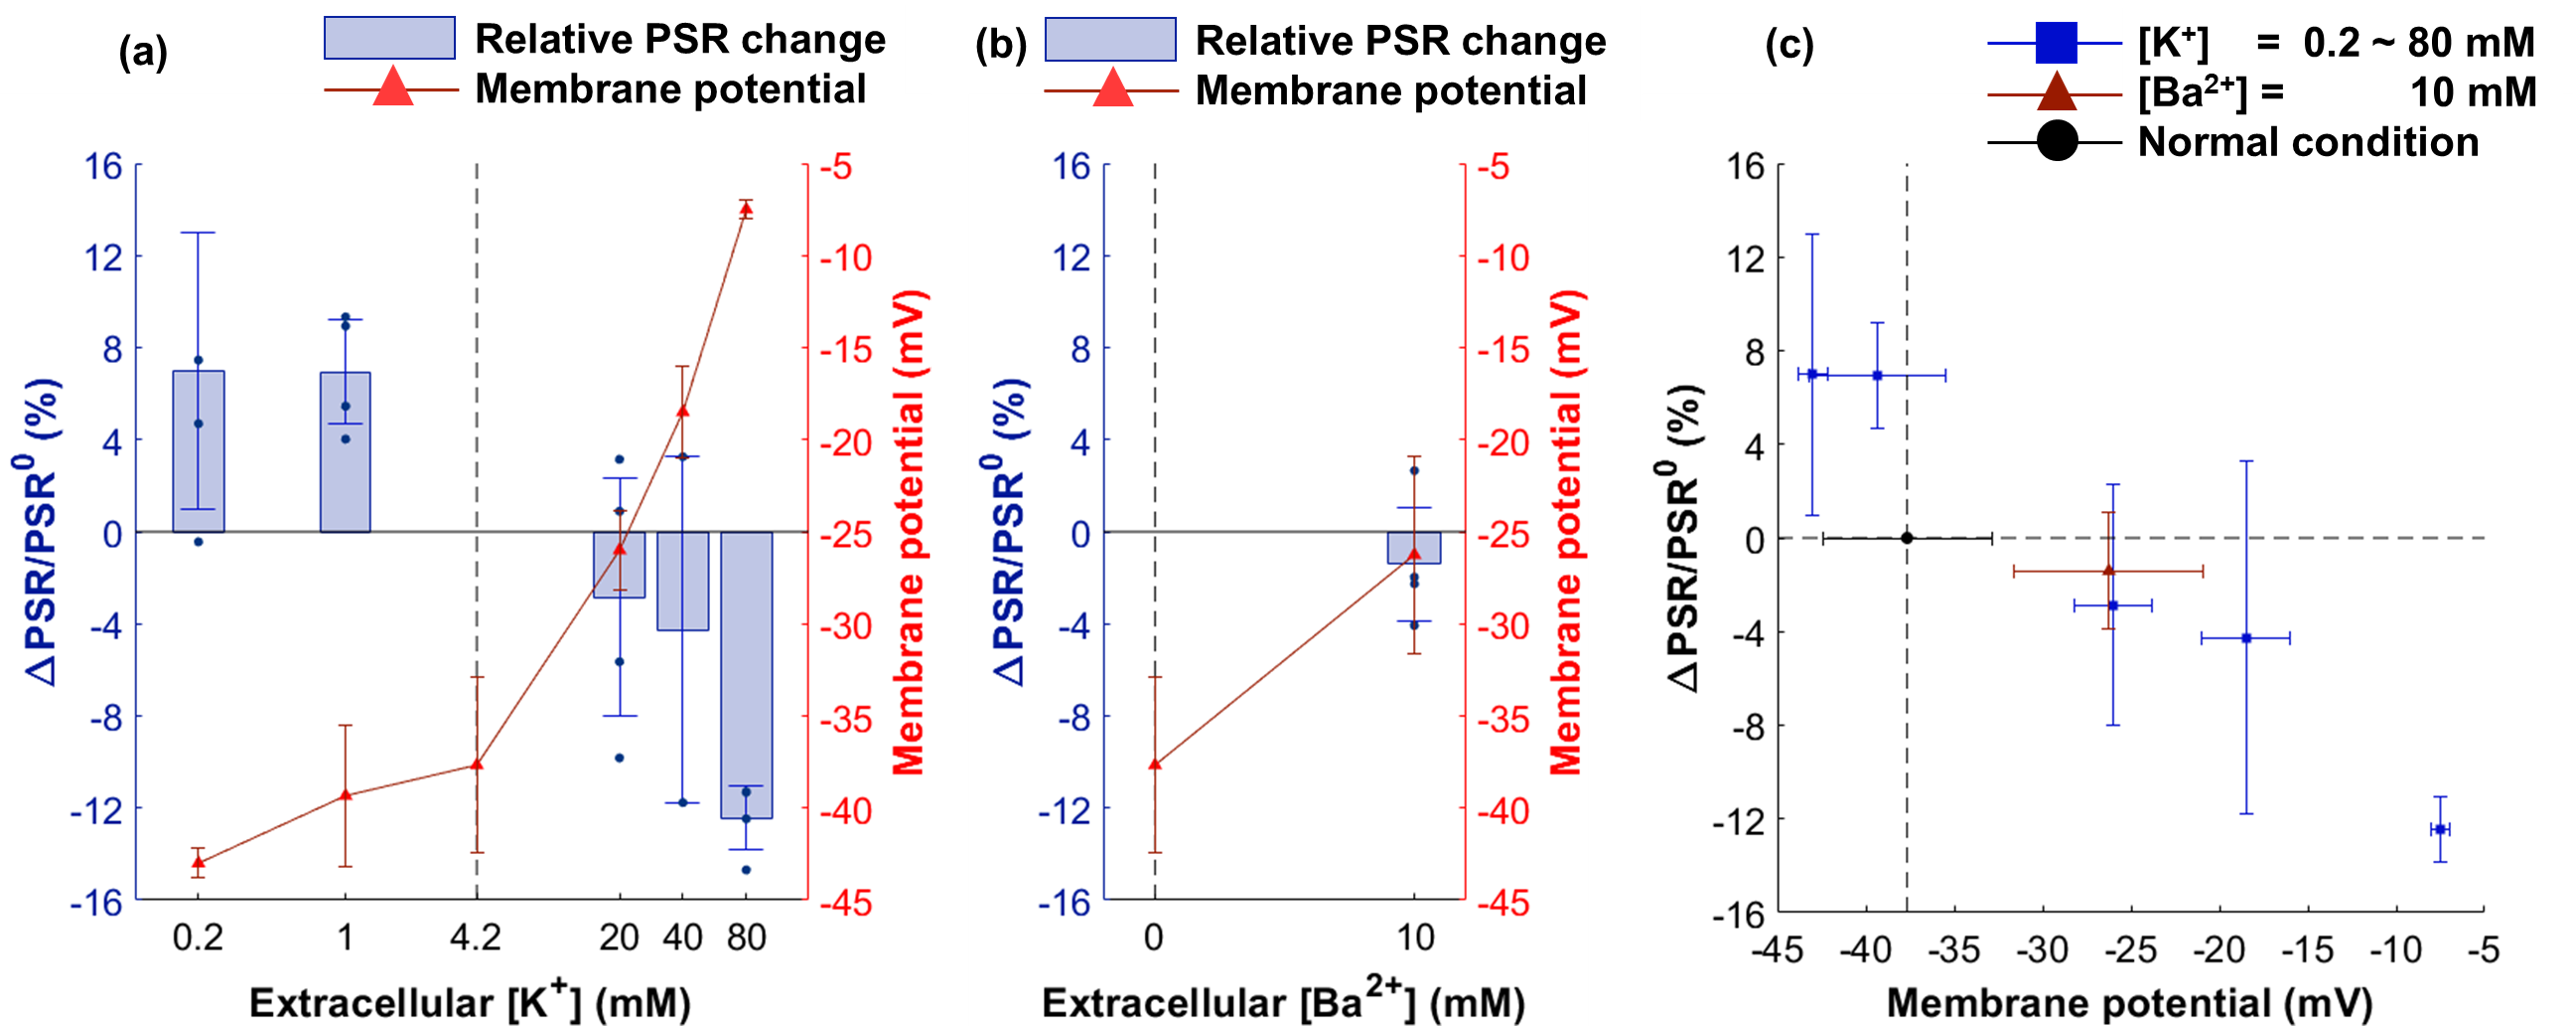
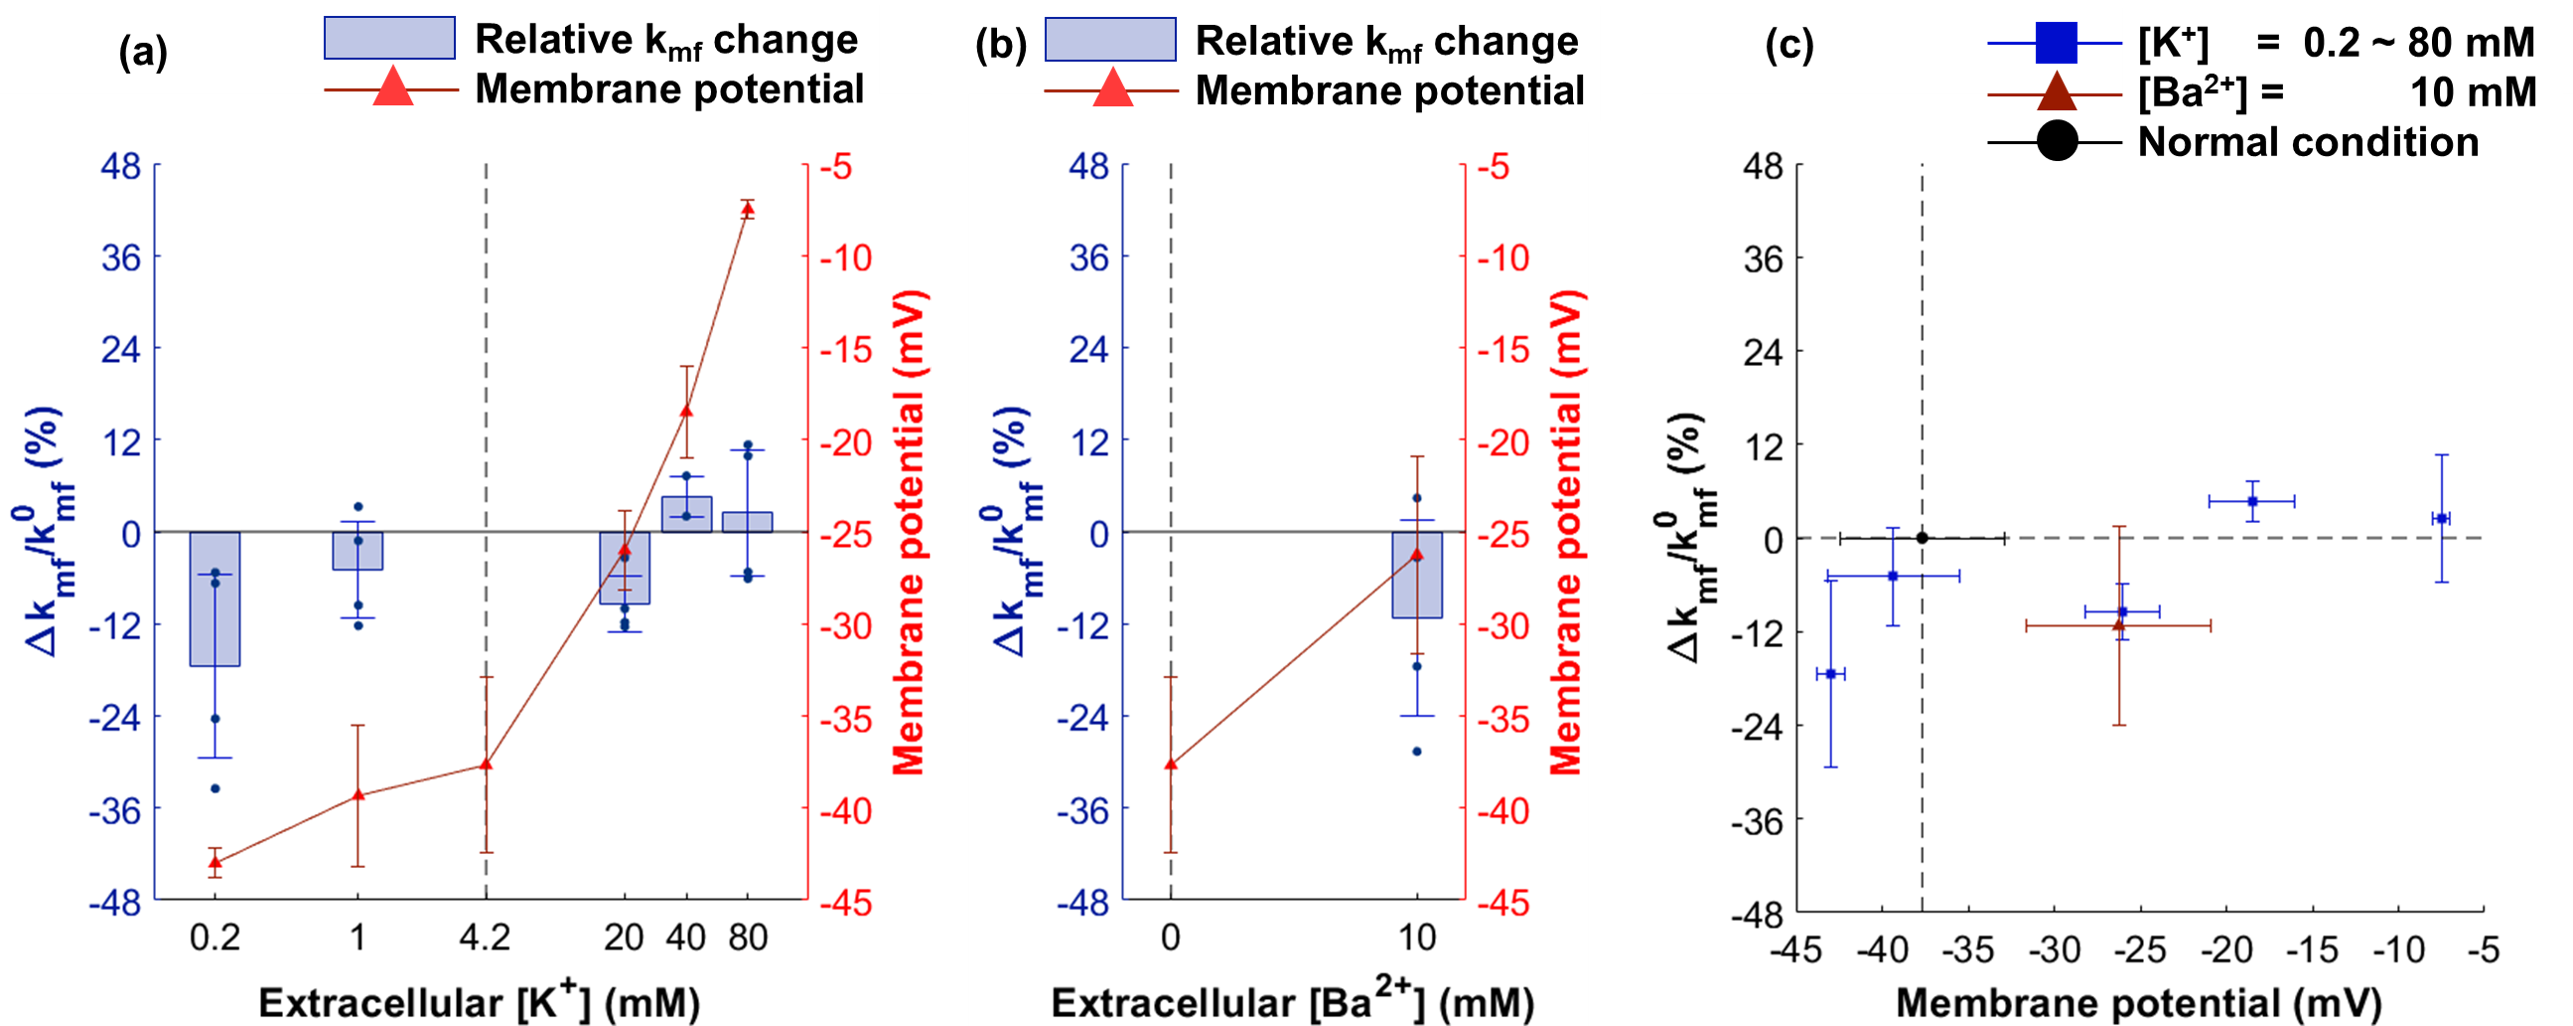
Changes of MR parameters and membrane potential under varying [K+]. When [K+] varied from 0.2 to 80 mM, the membrane potential changed from −43.0±0.8 mV (hyperpolarization) to −7.5±0.5 mV (depolarization). Correspondingly, each MR parameter changed as follows: T1, −3.40±0.83%** to +4.29±1.41%*; T2, −10.0±3.6%* to +21.2±3.6%**; PSR, +6.97±6.03% to −12.4±1.4%***; kmf, −17.5±11.9% to +2.47±8.16% (Figs. 2-5). All relative changes and p-values are referenced to the case of normal medium. (*: p<0.05, **: p<0.01, ***: p<0.001)Changes of MR parameters and membrane potential with [Ba2+] application. When [Ba2+] varied from 0 to 10 mM, the membrane potential changed from −37.7±4.8 mV (normal) to −26.3±5.4 mV (depolarization). Correspondingly, each MR parameter changed as follows: T1, +1.72±1.39%; T2, +5.13±1.21%**; PSR, −1.41±2.48%; kmf, −11.3±12.7% (Figs. 2-5).
Discussion
As the cell membrane potential was depolarized or hyperpolarized, both T1 and T2 increased or decreased. Moreover, when almost the same membrane potentials were measured in two different media ([K+] = 20 mM and [Ba2+] = 10 mM media with −26.0±2.2 and −26.3±5.4 mV, respectively), the corresponding changes in T1 and T2 were similar, which were +1.33±1.07% and +1.72±1.37% in T1, and +5.98±2.11%* and +5.12±1.20%* in T2 (Figs. 2c, 3c). This implies that T1 and T2 changes are neither potassium-specific nor barium-specific, rather induced by the membrane potential itself. On the other hand, PSR decreased (or increased) as the membrane potential was depolarized (or hyperpolarized), but kmf showed no significant change. Although the underlying mechanism is still unclear at present, we hypothesize that the MR parameter changes originate from the modifications in water molecules in the membrane hydration layer, and/or cellular volume, which are induced by changes in membrane potentials. A further study is needed not only for elucidating the underlying mechanism more precisely, but also for testing the in vivo application of this new membrane potential-dependent contrast mechanism.Conclusion
Our observations showed that depolarization or hyperpolarization of cell membrane potential leads to an increase or decrease in T1 and T2, and a decrease or increase in PSR. We expect the new contrast mechanism proposed here can be a powerful tool for functional neuroimaging by detecting cell membrane potential changes.Acknowledgements
This research was supported by the Brain Research Program through the National Research Foundation of Korea (NRF) funded by the Ministry of Science, ICT & Future Planning (NRF-2019M3C7A1031993, NRF-2019M3C7A1031994).References
1. de Queiroz, F. M., Ponte, C. G., Bonomo, A., Vianna-Jorge, R., & Suarez-Kurtz, G. (2008). Study of membrane potential in T lymphocytes subpopulations using flow cytometry. BMC immunology, 9(1), 63.
2. Helfant, R. H. (1986). Hypokalemia and arrhythmias. The American journal of medicine, 80(4), 13-22.
3. Hamill, O. P., Marty, A., Neher, E., Sakmann, B., & Sigworth, F. J. (1981). Improved patch-clamp techniques for high-resolution current recording from cells and cell-free membrane patches. Pflügers Archiv, 391(2), 85-100.
4. Waggoner, A. S. (1979). Dye indicators of membrane potential. Annual review of biophysics and bioengineering, 8(1), 47-68.
5. Wang, S., Li, B., & Zhang, F. (2020). Molecular Fluorophores for Deep-Tissue Bioimaging. ACS Central Science, 6(8), 1302-1316.
6. Gochberg, D. F., & Gore, J. C. (2003). Quantitative imaging of magnetization transfer using an inversion recovery sequence. Magnetic Resonance in Medicine: An Official Journal of the International Society for Magnetic Resonance in Medicine, 49(3), 501-505.
Figures