0085
Improved spin-lock based detection of ultra-low-field electro-magnetic oscillations for direct fMRI1Department of Internal Medicine I, University Hospital Würzburg, Würzburg, Germany, 2Experimental Physics 5, University of Würzburg, Würzburg, Germany, 3Comprehensive Heart Failure Center (CHFC), University Hospital Würzburg, Würzburg, Germany, 4Fraunhofer Institute for Integrated Circuits IIS, Würzburg, Germany
Synopsis
BOLD-based fMRI is currently the method of choice for the spatially resolved investigation of neuronal activity, although this technique only allows indirect measurements of activity by evaluating hemodynamic effects. Recently, a spin-lock-based technique for the direct measurement of neuro-electro-magnetic oscillations was presented, which impressively demonstrated imaging of the alpha activity. In the corresponding publication, however, elementary parameters of the spin-lock preparation were specified ad hoc. In the present work it is shown that the choice of these preparation parameters is of essential importance. For example, a clever choice of the spin-lock time can improve and stabilize the signal detection.
Introduction
Neuroimaging techniques are the most widely used tools for studying the structure and function of the human brain. Established techniques are electroencephalography (EEG), magnetoencephalography (MEG) and BOLD-based functional MRI (fMRI) [1,2]. However, to date none of these techniques has been able to provide a direct measurement of neuronal activity with both high temporal and spatial resolution. EEG and MEG offer a direct measurement with high temporal resolution, but spatial resolution is strongly limited due to the inverse problem [1]. Conversely, BOLD-based fMRI benefits from high spatial resolution. However, it suffers from very poor temporal resolution and is based on secondary hemodynamic modulations, which are only an indirect measure of neuronal activity [2].In 2019, Truong et al presented a novel method that uses the spin-lock technique to directly detect neuro‐electro‐magnetic oscillations (NEMO), thus eliminating the most important weak point of BOLD-based fMRI [3]. This technique applies a special form of spin-lock (SL) preparation that is commonly used to quantify the relaxation times T1ρ and T2ρ [4]. In the context of functional imaging, however, the interaction of the SL pulse with ultra-low-field electro-magnetic oscillations is measured by using the effect of rotary saturation [5]. Neuronal activity is finally detected by a sinusoidal change in the signal intensity, which is caused by a variation in the relative phase between the SL pulse and the external field [3].
In this work we demonstrate how the method of Truong et al [3] can be improved by the means of detailed parameter optimization of the spin-lock pulse sequence. Here, we focus on varying the parameters tSL (SL time) and fSL (SL amplitude). The effect on the resulting NEMO-signal is investigated by performing Bloch simulations and phantom experiments.
Methods
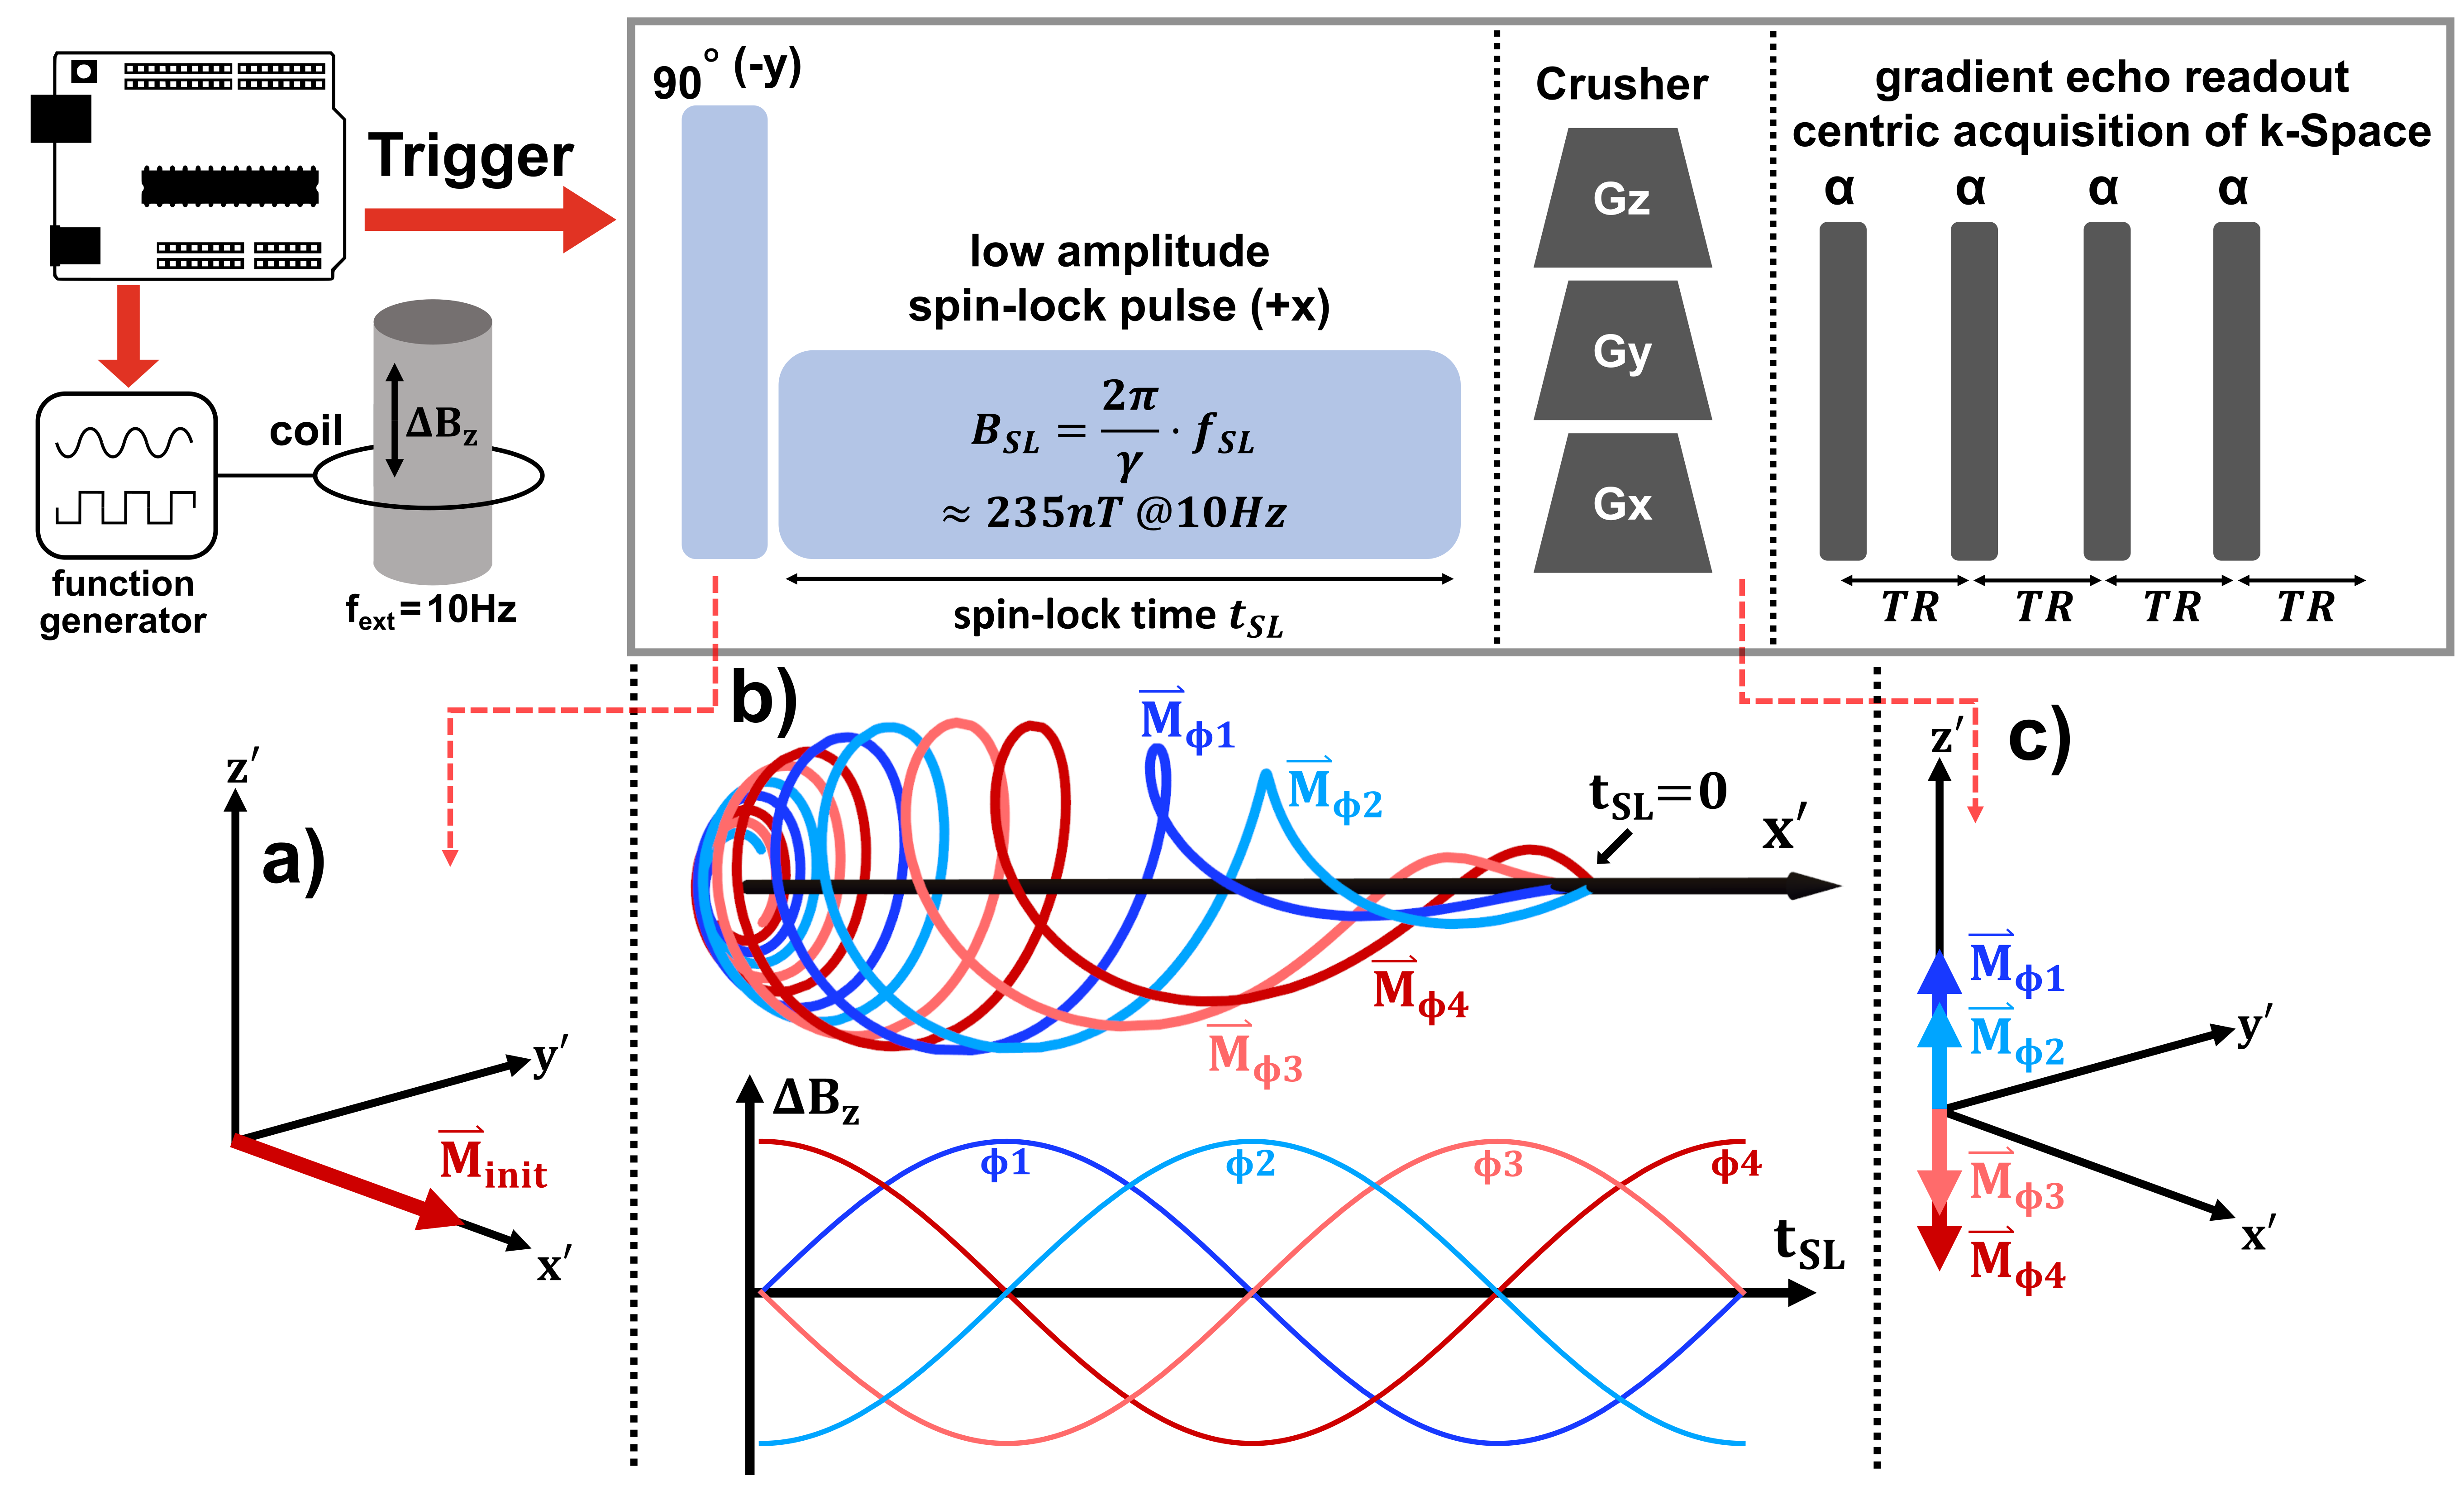
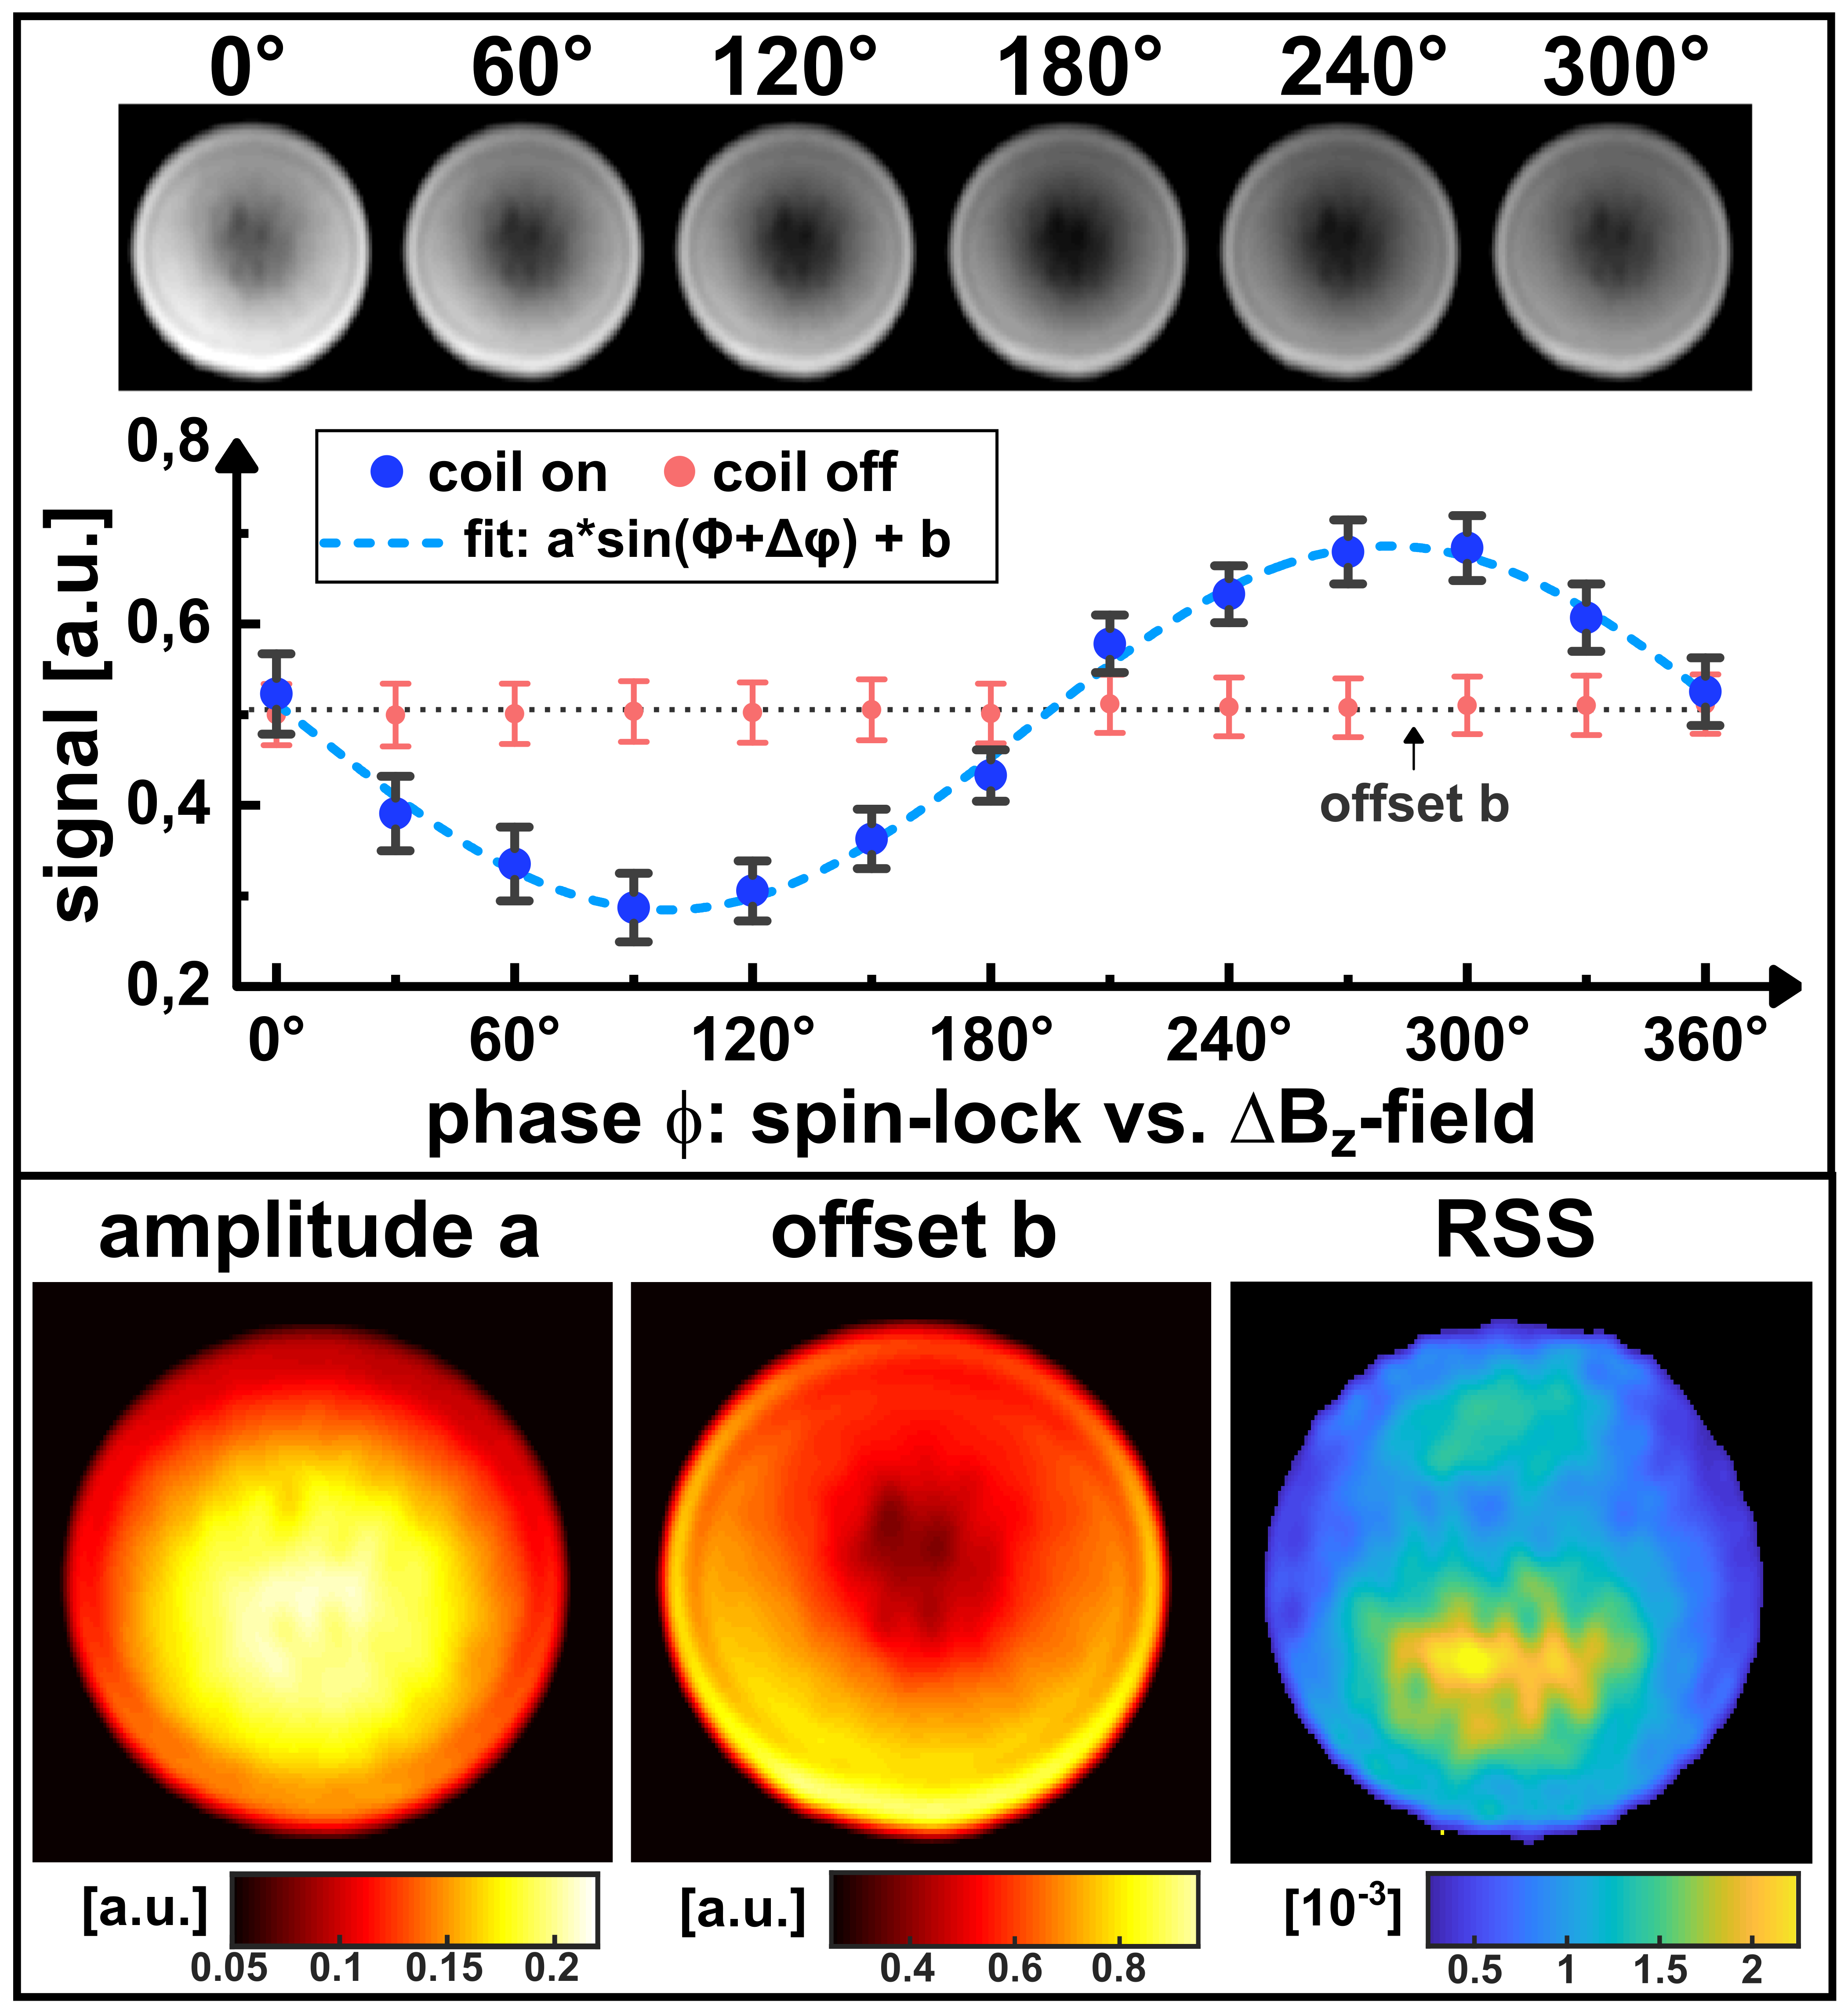
The simulation of spin-lock interaction was carried out with Mathematica (Wolfram Research, Champaign, USA). Bloch equations were solved within the spin-lock condition for an external alternating field $$$\Delta B_z(t_{SL})$$$ causing rotary saturation [5]. Here, a frequency of 10Hz and 1nT was assumed, which is in the range of neuro-electric activity in the alpha-band [3]. In order to investigate the influence of tSL and fSL on the NEMO-signal, the parameters were varied in the range 1…500ms and 1…20Hz in 500x153 steps. Each step was simulated for 50 relative phases ϕ (SL vs ΔBz) in the range 0…2 π. In this parameter space tSL and fSL values were sought that lead to a maximum of the sinusoidal NEMO-signal.The measurements were carried out on a 3.0T scanner (MAGNETOM Skyra, Siemens, Erlangen, Germany). The experimental setup and sequence scheme is shown in Figure 1. To simulate neuronal activity, we used an axial wire loop taped outside a cylindrical Agar-Agar-phantom. In contrast to Truong et al, we implemented a cartesian readout instead of a spiral readout and acquired 64 phase encoding steps within 16 repetitions. In order to control the coil current and the relative phase, the scanner was synchronized with an Arduino-based circuit. Measurements were carried out with different tSL (30…150ms) and fSL (5…13Hz). For each measurement 8 phases ϕ were used. The amplitude a of the NEMO-signal was determined by fitting the measured signal intensity to the following equation:
$$S\left(\phi,t_{SL},f_{SL}\right)=a\cdot sin\left(\phi+\Delta\phi\right)+b\,\,\,\textbf{Equation 1}$$
Results
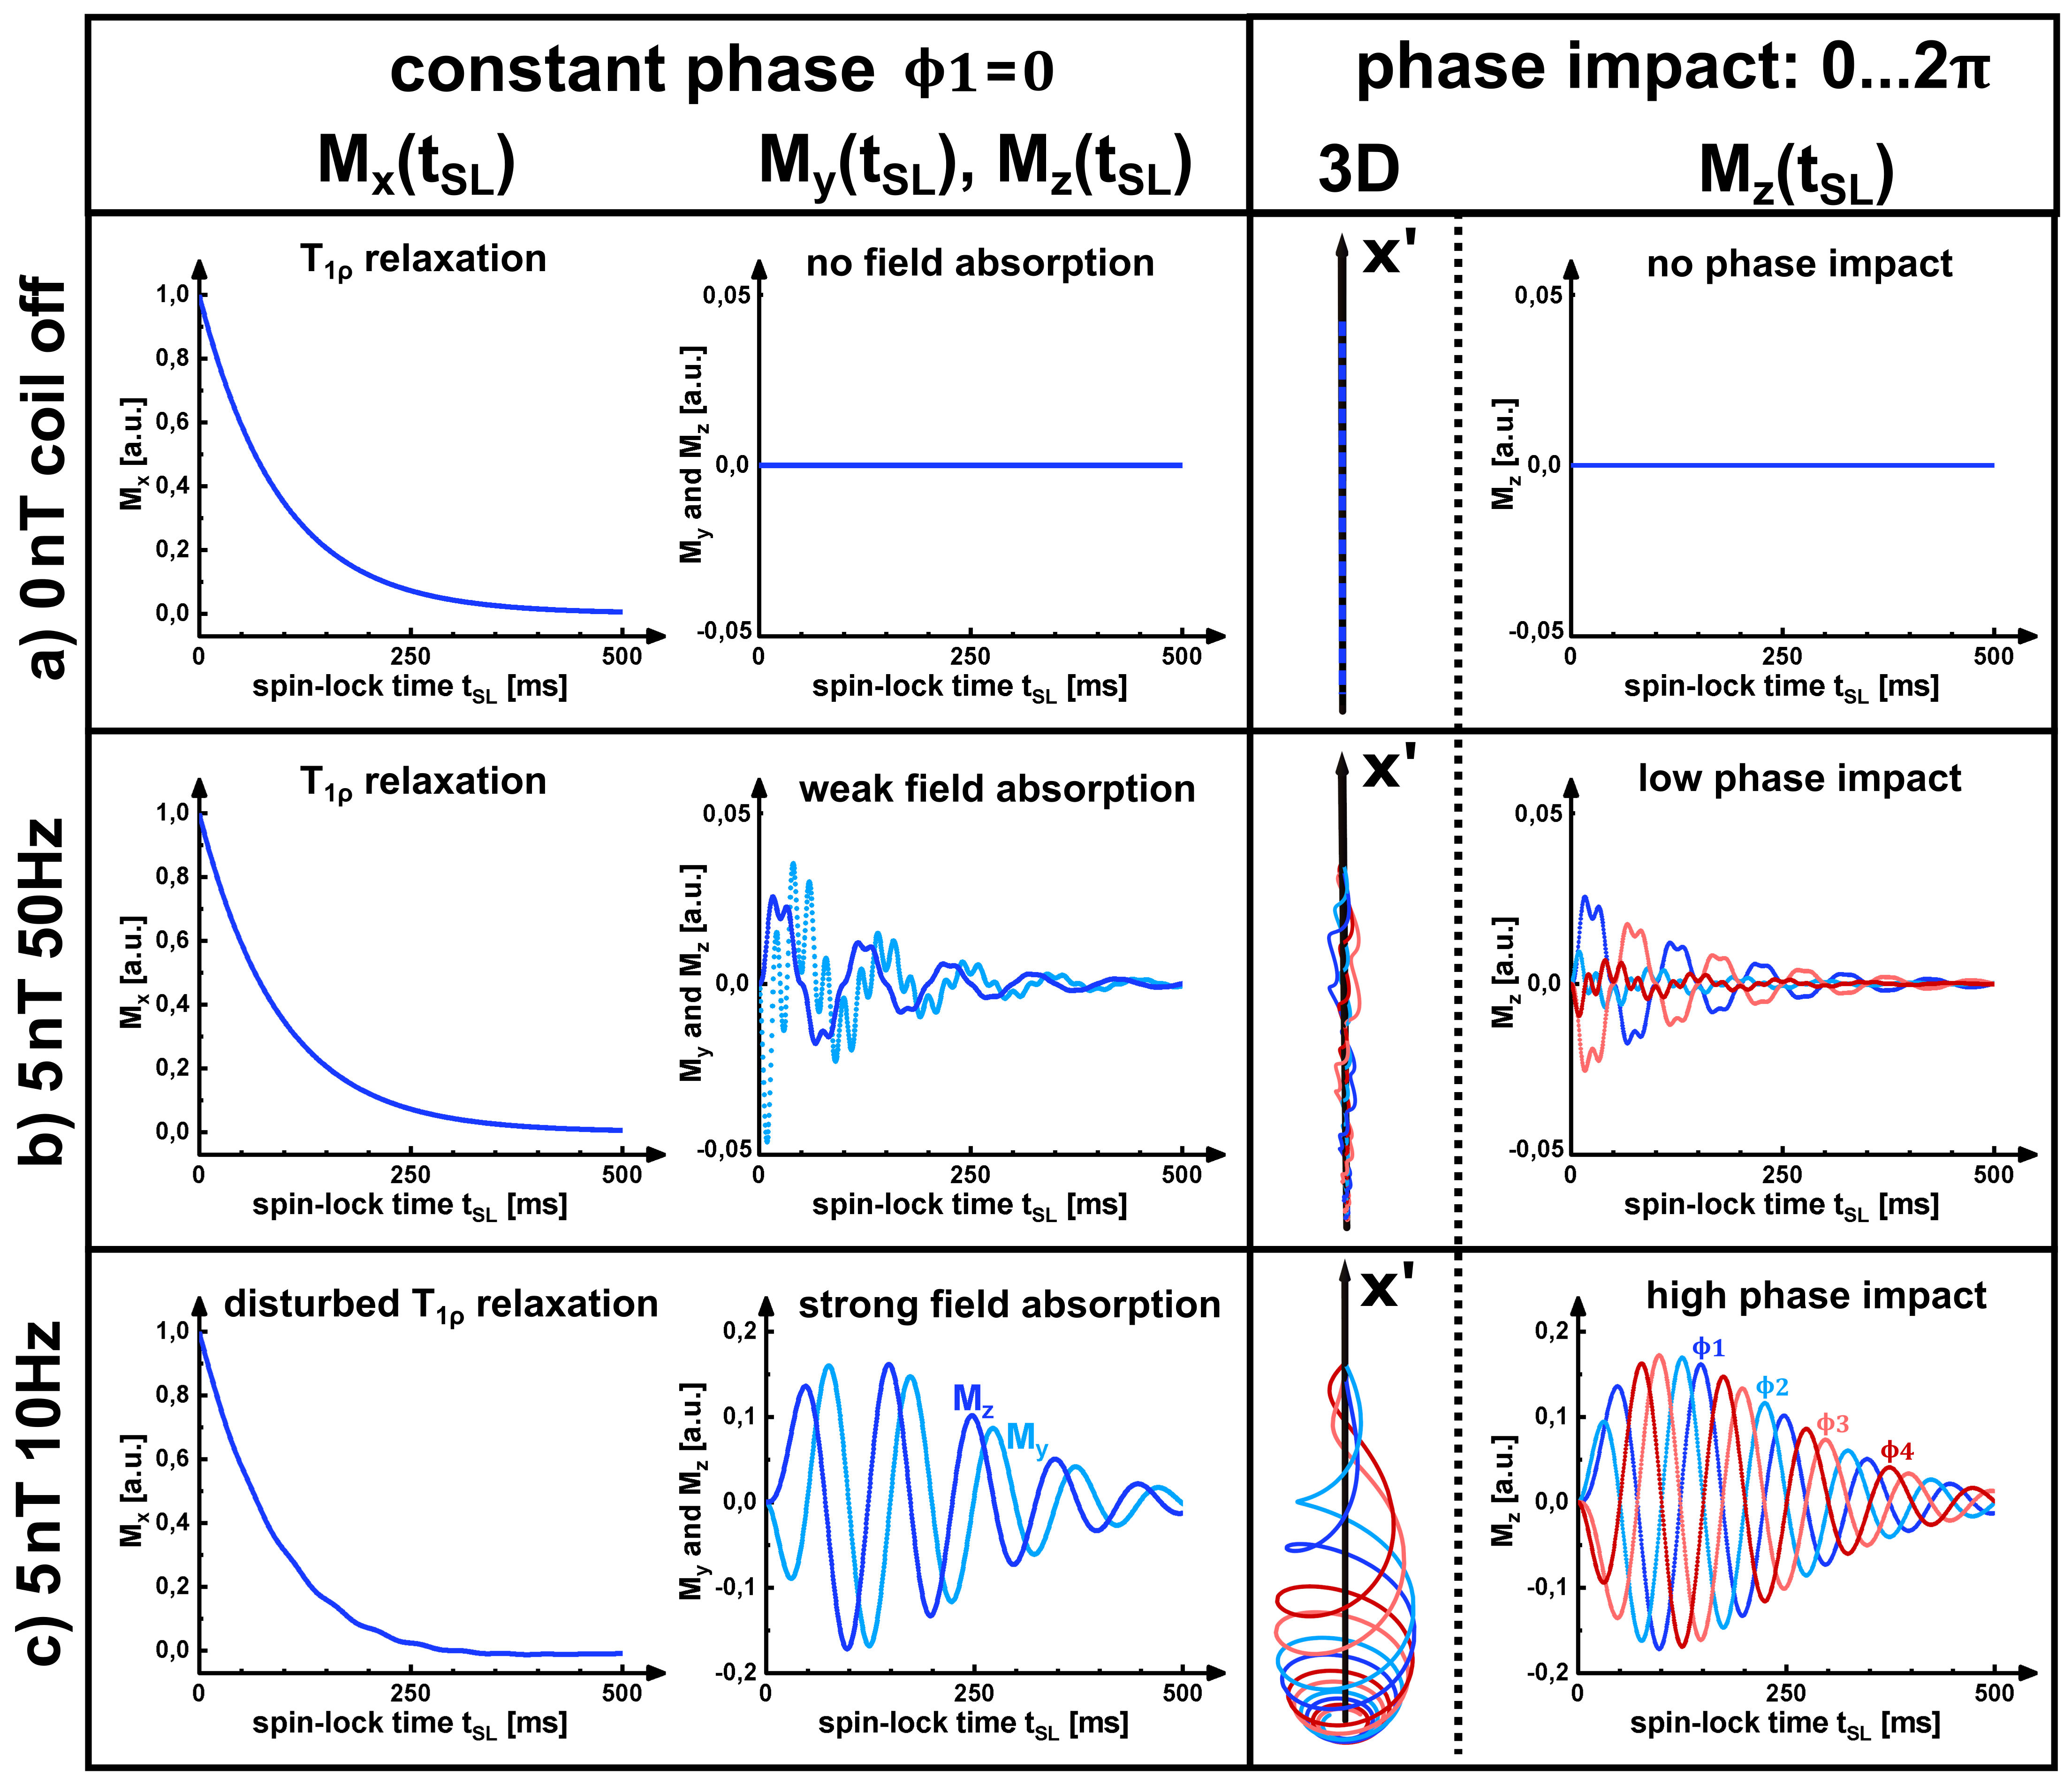
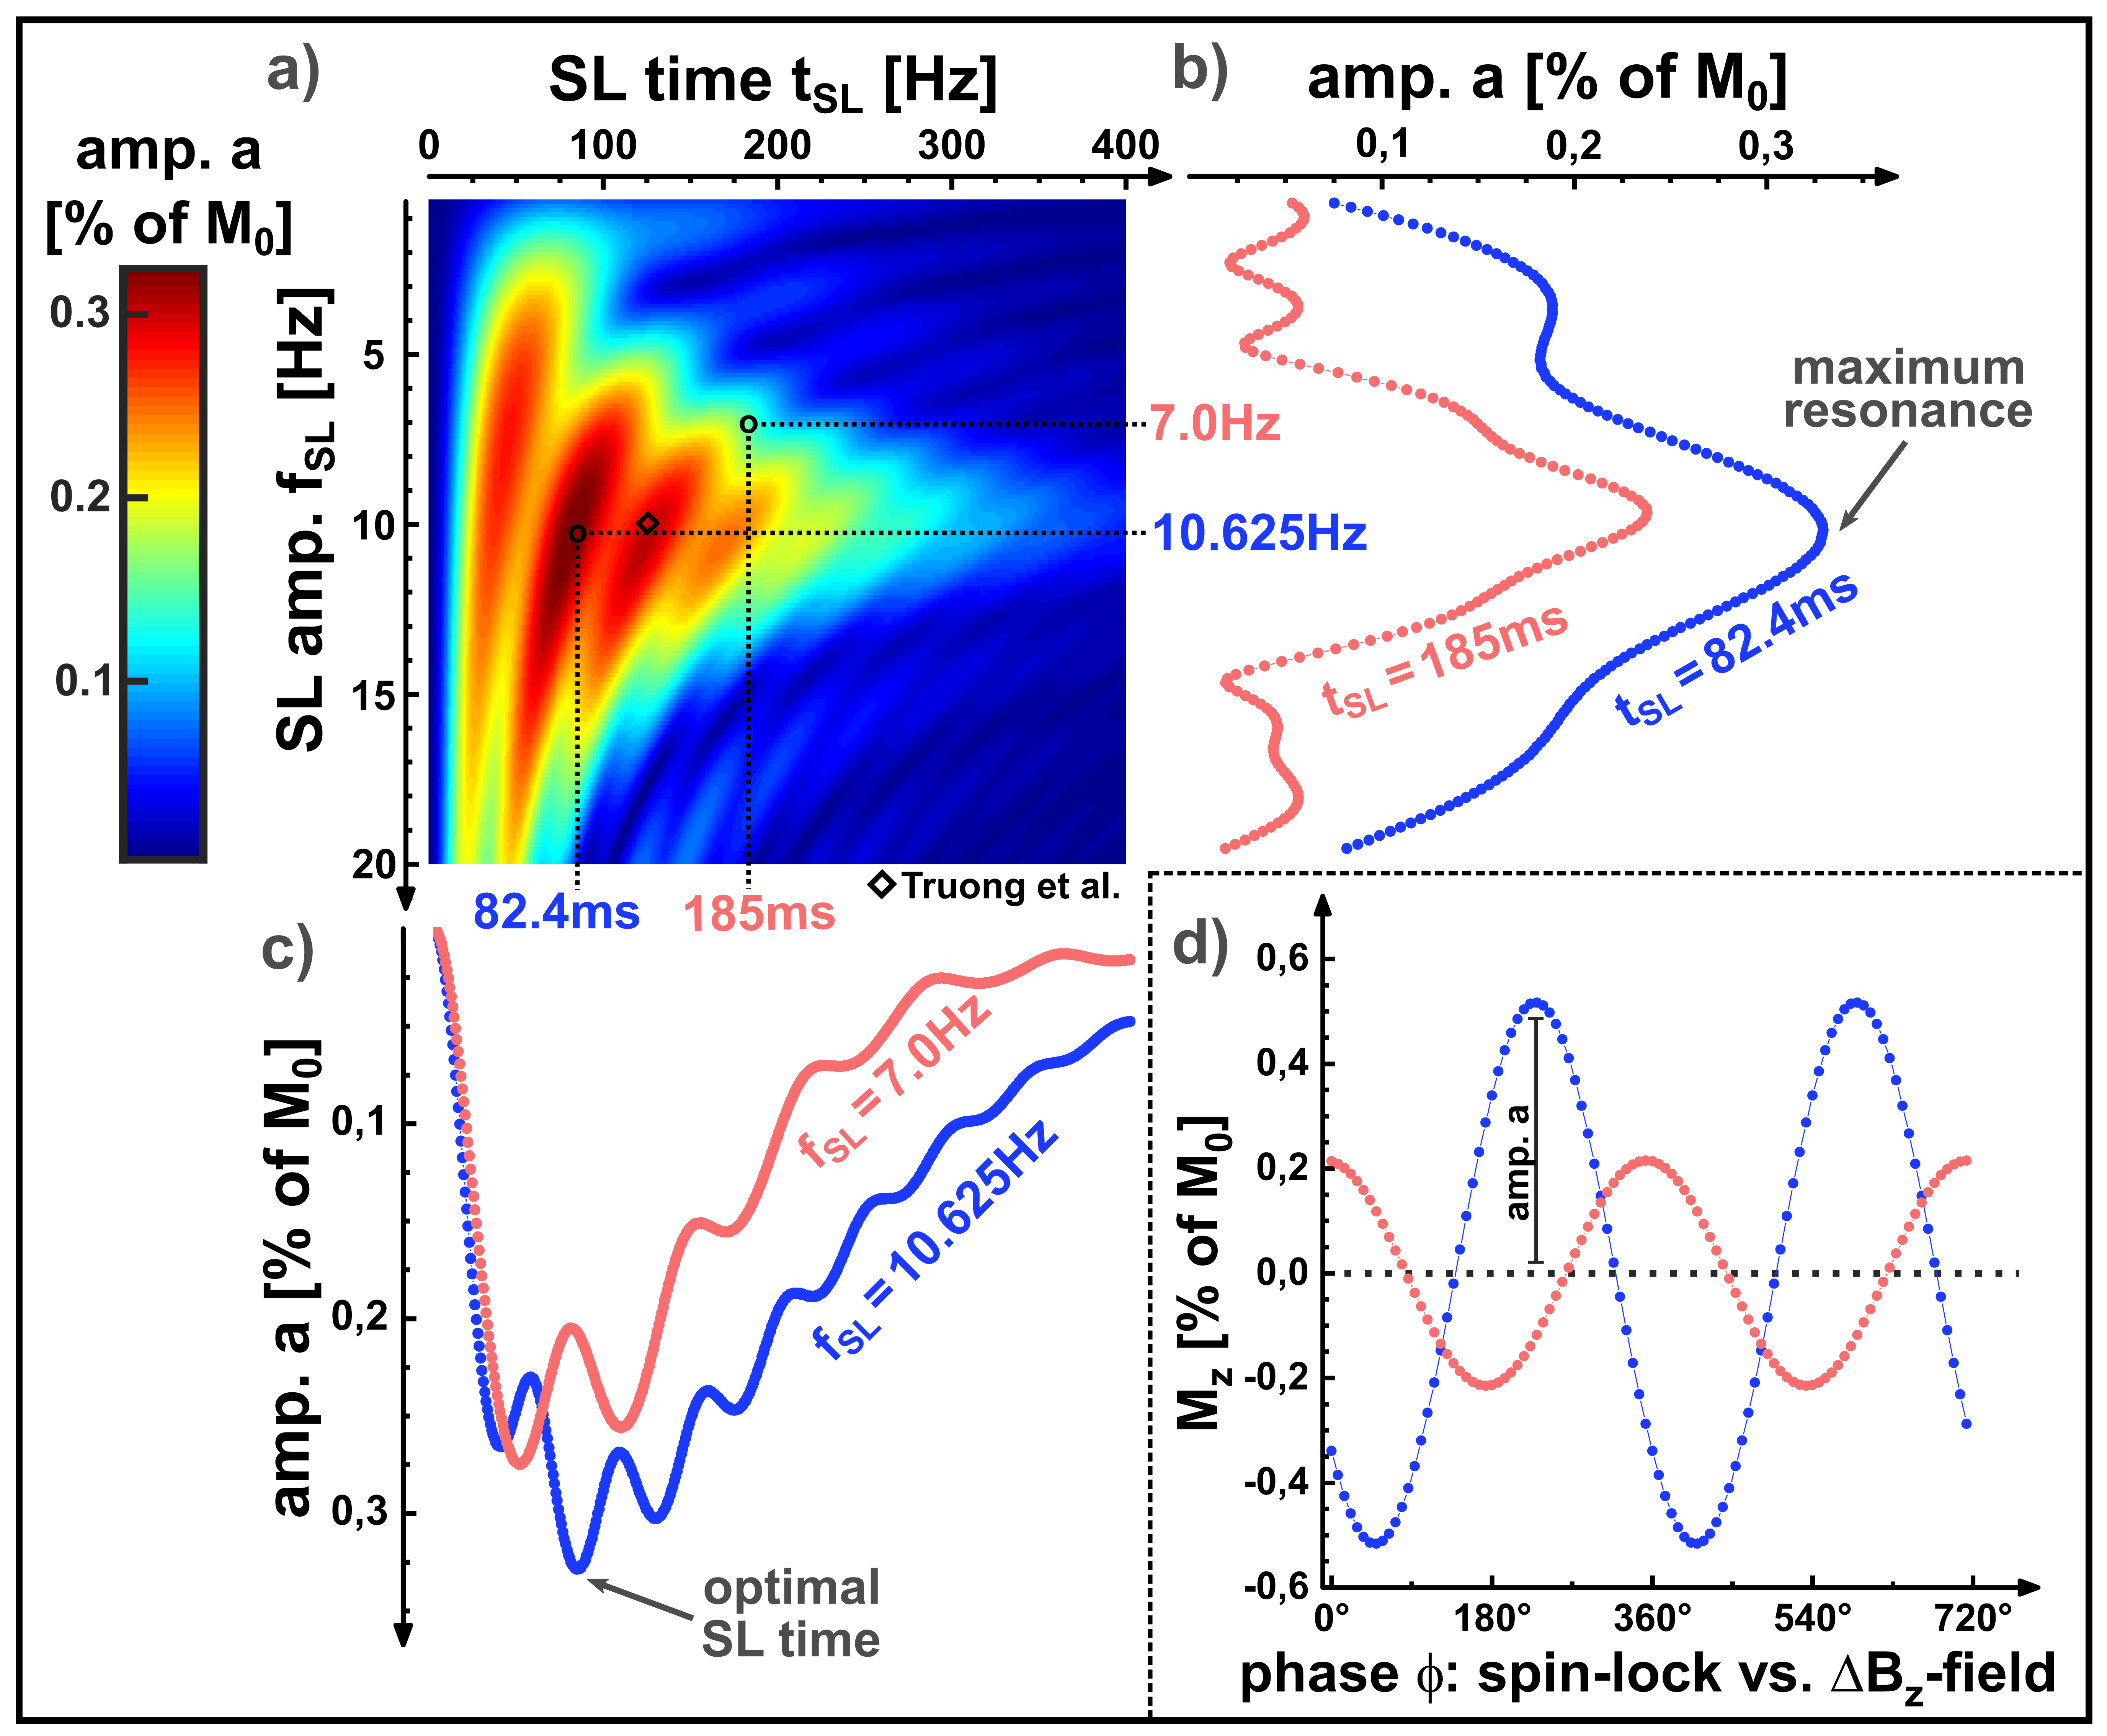
Figure 2 shows exemplary simulations of spin-lock interactions. Only a resonant alternating field (frequency $$$f_{ext}\approx f_{SL}=\frac{\gamma}{2\pi}B_{SL}$$$) induces an oscillating Mz component, which can be measured after preparation. Figure 3 shows the results of the parameter variation. Several local maxima and minima exist for the amplitude of the NEMO-signal. We were able to find the global maximum for tSL=82.4ms and fSL=10.625Hz, which deviates significantly from the parameters chosen in [3].In Figure 4 exemplary measurement results are shown. When the relative phase ϕ was varied, a clear sinusoidal change in signal intensity was observed (high agreement with Eq.1). The smallest detectable field strength was ΔBz≈0.8nT. By varying fSL, a peak of the NEMO-amplitude in the range of ≈10Hz could be confirmed (Figure 5a). The variation of tSL also indicates the emergence of local maxima (Figure 5b). Furthermore, the artifact susceptibility was strongly dependent on tSL. When evaluating the RSS values of the sinusoidal fit, remarkably large artifacts were found at ≈25ms, ≈75ms and ≈125ms (Figure 5c).
Discussion
The simulation and measurement results show that the choice of tSL and fSL have a significant impact on the size of the measured NEMO-signal. By using optimized parameters, the simulation predicted a signal increase of 14.2% compared to the parameters used in [3], with the optimal fSL being slightly above the resonance frequency. However, the measurements indicate that the choice of tSL is the most decisive factor. It was observed that SL times leading to certain numbers of rotations around the SL axis (25ms≙1/4, 75ms≙3/4 and 125ms≙5/4) cause strong image artifacts and are therefore unsuitable for successful NEMO-detection.Conclusion
Spin-lock based detection of electro-magnetic oscillations has the potential to revolutionize neuroimaging. The present work shows that the approach presented by Truong et al [3] can be optimized without additional technical effort by a clever choice of sequence parameters. However, our results also indicate that the method fails for some parameters, which must be taken into account for future experiments in vivo.Acknowledgements
This work was supported by the Federal Ministry for Education and Research of the Federal Republic of Germany (BMBF 01EO1504, MO6).References
[1] Zhang X, et al. A review of EEG and MEG for brainnetome research. Cogn Neurodyn 8, 87–98 (2014). https://doi.org/10.1007/s11571-013-9274-9
[2] Herold F, et al. The Contribution of Functional Magnetic Resonance Imaging to the Understanding of the Effects of Acute Physical Exercise on Cognition. Brain Sci. 2020 Mar 18;10(3):175. https://doi.org/10.3390/brainsci10030175
[3] Truong T‐K, et al. Toward direct MRI of neuro‐electro‐magnetic oscillations in the human brain. Magn Reson Med. 2019;81:3462–3475. https://doi.org/10.1002/mrm.27654
[4] Gram M, et al. Balanced spin‐lock preparation for B1‐insensitive and B0‐insensitive quantification of the rotating frame relaxation time T1ρ. Magn Reson Med. Early View. https://doi.org/10.1002/mrm.28585
[5] Witzel T, et al. Stimulus-induced Rotary Saturation (SIRS): a potential method for the detection of neuronal currents with MRI. Neuroimage. 2008 Oct 1;42(4):1357-65. https://doi.org/10.1016/j.neuroimage.2008.05.010
Figures