0084
Uncovering the specificity of quantitative MRI to different molecular forms of iron in the brain.1The Edmond and Lily Safra Center for Brain Science, The Hebrew University of Jerusalem, Jerusalem, Israel
Synopsis
The main iron compounds, ferritin and transferrin, are distributed heterogeneously across the brain and are often implicated in neurodegenerative diseases. While quantitative MRI has been linked to brain tissue’s microstructure, non-invasive discrimination between iron forms still remains a challenge. We propose an in vivo approach for assessing brain iron forms, based on the dependency of R1 on R2*. We establish this approach in phantoms and validate it against histology. In the in vivo human brain, the dependency of R1 on R2*, rather than each parameter by itself, predicts the inhomogeneous distribution of iron-binding proteins with age and across brain regions.
Introduction
Characterizing brain tissue's iron content is crucial for studying the normal and diseased brain1–3. The two main iron compounds involved in iron regulation are transferrin, the iron transport protein, and ferritin, the iron storage protein4. Iron and its different molecular forms are distributed inhomogeneously across the brain2,5–7. Alterations in brain iron compounds were identified in aging and in many neurodegenerative diseases1,5–9. For example, the ratio of transferrin to iron, which reflects iron mobilization, was shown to differ between elderly controls and either Parkinson’s or Alzheimer’s patients10. Therefore, assessment of the iron environment in the living brain would be highly valuable for diagnosis, therapeutic monitoring, and research3.The main technique for non-invasive mapping of the human brain is magnetic resonance imaging (MRI). Quantitative MRI (qMRI) parameters have been linked to a variety of microstructural properties11–14. Particularly, R2* and R1 are known to be sensitive to iron presence11,15,16. However, non-invasive quantification of specific iron forms still remains a challenge3. Early works suggest that the molecular form of iron is reflected by the iron relaxivity, defined as the dependence of MR relaxation on iron concentration17–21. In these studies, iron concentration was estimated post-mortem.
We propose an in vivo relaxivity approach, based on the dependency of R1 on R2*, for assessing specific molecular forms of iron. We test this approach in phantoms and in the living human brain, and show that it improves the specificity of qMRI to different iron forms.
Methods
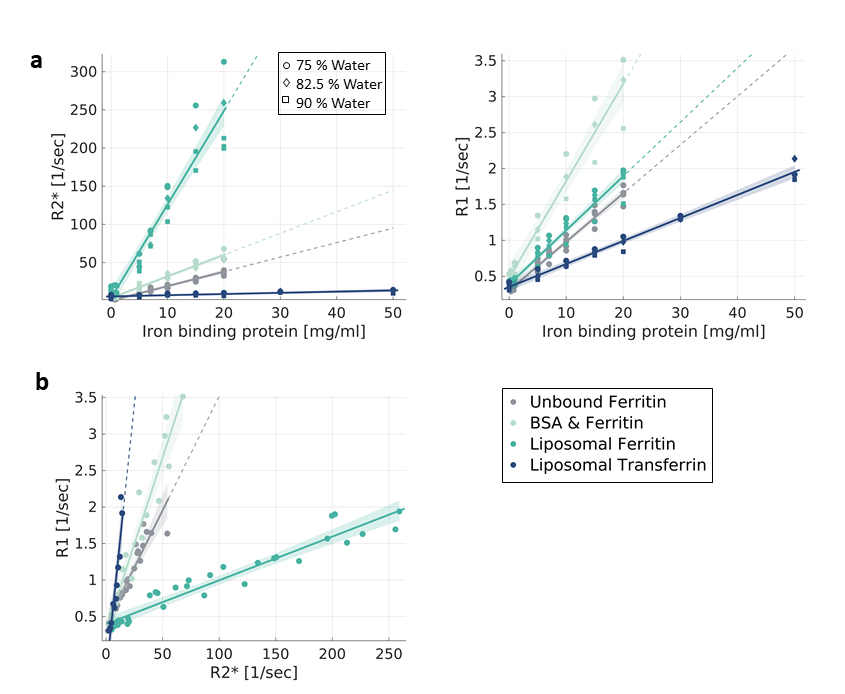
Phantoms: Samples of different iron-binding proteins (ferritin & transferrin) in varying concentrations and in different environments (Phosphatidylcholine-Sphingomyelin liposomes, Bovine serum albumin (BSA) and saline)14,22. Each sample was prepared in three different water fractions.Human subjects: 27 younger adults (aged 33 ± 7 years), and 13 older adults (aged 70 ± 2 years)
MRI: R2*23 and R124 mapping on a 3T Siemens MAGNETOM Skyra scanner. For each brain structure25, R1 and R2* values of all voxels were binned. The bins’ medians were used for a linear fit from which the R1-R2* slopes were extracted. In phantoms the fit was done across samples.
Results
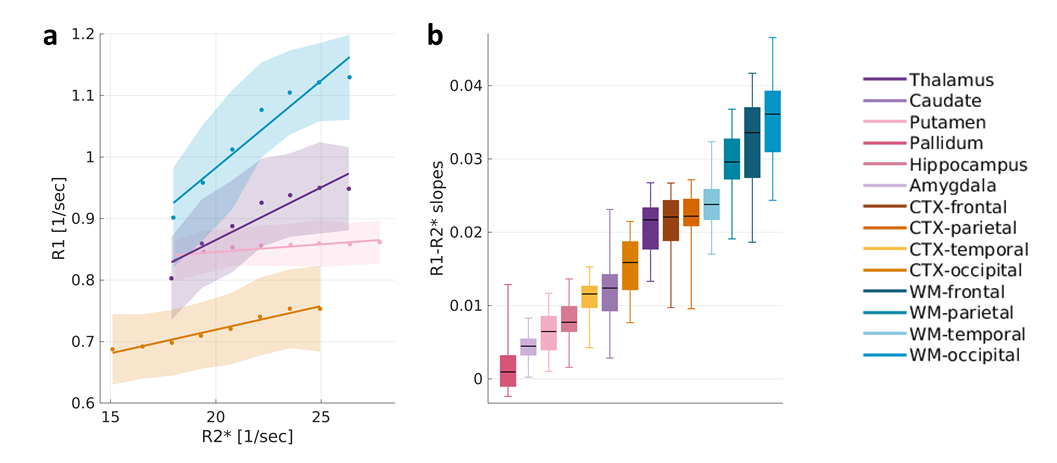
In Phantoms, MR relaxation rates increased with the concentration of iron-binding proteins. Different types of proteins (transferrin, ferritin) and molecular environments (liposomes, saline, BSA) presented different relaxivities (Fig. 1a). These trends were almost unaffected by changes in the water content. Notably, both the type and concentration of iron-binding proteins led to changes in MR relaxation. This ambiguity was diminished by evaluating the dependency of R1 on R2* (i.e. the R1-R2* slope), which was statistically distinct for all different iron forms tested (p<0.0001 tested with ANCOVA, Fig. 1b). The R1-R2* slopes were not sensitive to changes in iron and water concentrations (data not shown), highlighting the specificity of these measurements to differences in the molecular form of iron.Next, this approach was implemented in the living human brain. For different brain regions, we evaluated the changes in R1 in response to changes in R2*. Different brain regions exhibited distinct R1-R2* slopes (Fig. 2a), which were stable across subjects (Fig. 2b).
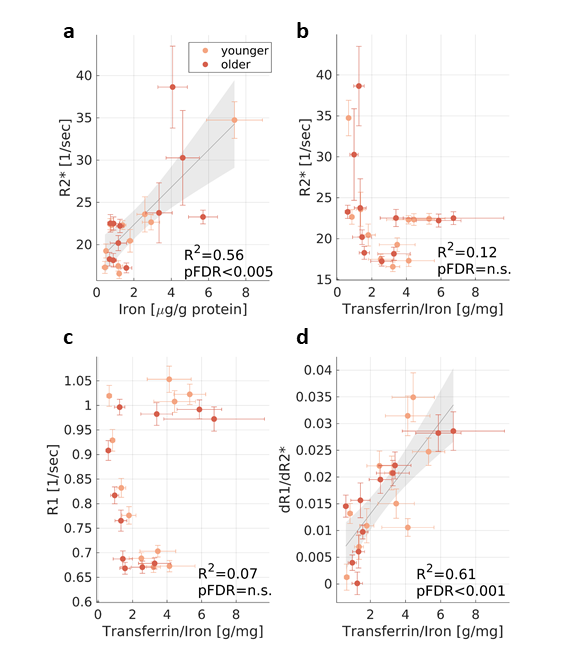
Our phantom experiments suggest that the R1-R2* slopes vary with the molecular form of iron (Fig. 1). Similarly, we tested whether the variable R1-R2* slopes in the brain reflect regional changes in iron forms. We performed a group-level comparison between the in vivo R1-R2* slopes and previously reported post-mortem findings describing iron, ferritin and transferrin concentrations in different brain regions of younger (27-64) and older (65-88) human subjects5,6,9,10. As expected, R2* was significantly correlated with iron concentration (R2=0.56, FDR adjusted p-value<0.005, Fig. 3a). On top of the heterogeneity in iron concentration across the brain, the molecular forms in which the iron resides vary as well. The regional fractions of iron-binding proteins and their ratio to the total iron content were correlated significantly with the R1-R2* slope, but not with R1 or R2* by themselves. For example, R1 and R2* were not significantly correlated with the ratio of transferrin to iron, serving as a marker for iron mobilization10 (Fig. 3b-c). However, the transferrin/iron ratio was correlated with the R1-R2* slopes, across brain regions and age groups (R2=0.61, FDR adjusted p-value<0.001, Fig. 3d).
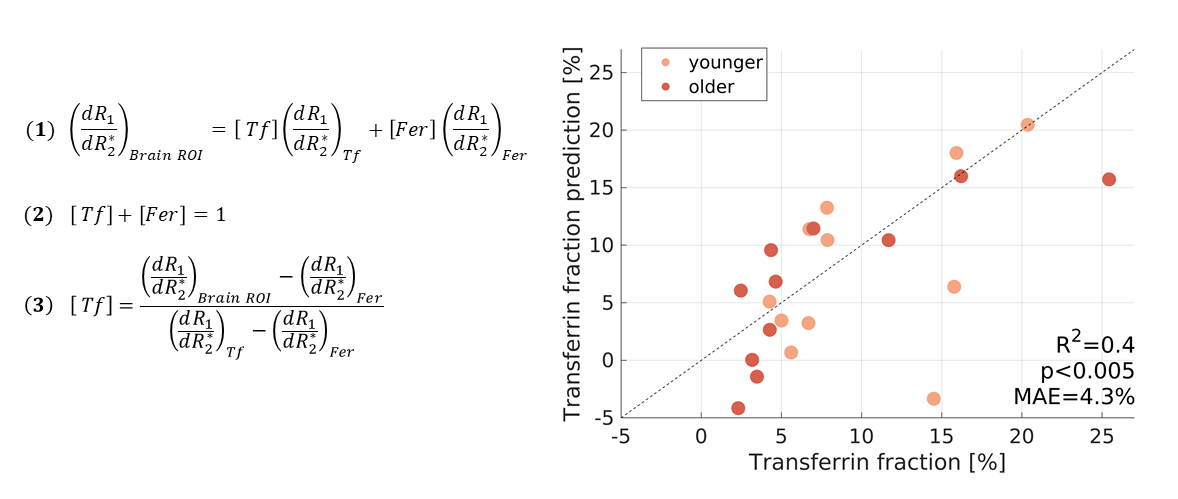
Next, we modeled the separate contribution of transferrin and ferritin to the observed R1-R2* slopes in the human brain. Fixing the model coefficients to the ones estimated for iron-binding proteins in phantoms, there were no free parameters left. Remarkably, this fully-constrained model allowed to predict the transferrin fraction (F-test p<0.005, MEA=4.3%) both across brain regions and across younger and older subjects (Fig. 4).
Conclusion
We present a qMRI approach for non-invasive mapping of iron compounds in the human brain, which was established in phantoms and validated with histological measurements. While R1 and R2* are often associated with iron concentration, they were not correlated with specific forms of iron. Notably, the R1-R2* slopes did show sensitivity to the molecular forms of brain tissue iron. A fully-constrained model of the R1 dependency on R2* allowed us to predict the inhomogeneous distribution of iron-binding proteins due to aging and across the brain. Our method provides valuable information regarding the tissue’s iron environment, which may further advance non-invasive research and diagnosis of the human brain.Acknowledgements
No acknowledgement found.References
1. Bulk, M. et al. Quantitative comparison of different iron forms in the temporal cortex of Alzheimer patients and control subjects. Sci. Rep. 8, 1–11 (2018).
2. Haacke, E. M. et al. Imaging iron stores in the brain using magnetic resonance imaging. Magn. Reson. Imaging 23, 1–25 (2005).
3. Möller, H. E. et al. Iron, Myelin, and the Brain: Neuroimaging Meets Neurobiology. Trends Neurosci. (2019)
4. Cole, J. H., Marioni, R. E., Harris, S. E. & Deary, I. J. Brain age and other bodily ‘ages’: implications for neuropsychiatry. Mol. Psychiatry 1 (2018)
5. Connor, J. R., Snyder, B. S., Beard, J. L., Fine, R. E. & Mufson, E. J. Regional distribution of iron and iron-regulatory proteins in the brain in aging and Alzheimer’s disease. J. Neurosci. Res. 31, 327–335 (1992).
6. Connor, J. R., Boeshore, K. L., Benkovic, S. A. & Menzies, S. L. Isoforms of ferritin have a specific cellular distribution in the brain. J. Neurosci. Res. 37, 461–465 (1994).
7. Loeffler, D. A. et al. Transferrin and Iron in Normal, Alzheimer’s Disease, and Parkinson’s Disease Brain Regions. J. Neurochem. 65, 710–716 (2002).
8. Zecca, L., Youdim, M. B. H., Riederer, P., Connor, J. R. & Crichton, R. R. Iron, brain ageing and neurodegenerative disorders. Nat. Rev. Neurosci. 5, 863–873 (2004).
9. Connor, J. R., Snyder, B. S., Arosio, P., Loeffler, D. A. & LeWitt, P. A Quantitative Analysis of Isoferritins in Select Regions of Aged, Parkinsonian, and Alzheimer’s Diseased Brains. J. Neurochem. 65, 717–724 (2002).
10. Loeffler, D. A. et al. Transferrin and Iron in Normal, Alzheimer’s Disease, and Parkinson’s Disease Brain Regions. J. Neurochem. 65, 710–716 (1995).
11. Cercignani, M., Dowell, N. G. & Tofts, P. S. Quantitative MRI of the Brain : Principles of Physical Measurement. (CRC Press, 2018).
12. Basser, P. J. & Pierpaoli, C. Microstructural and Physiological Features of Tissues Elucidated by Quantitative-Diffusion-Tensor MRI. J. Magn. Reson. Ser. B 111, 209–219 (1996).
13. Weiskopf, N., Mohammadi, S., Lutti, A. & Callaghan, M. F. Advances in MRI-based computational neuroanatomy. Curr. Opin. Neurol. 28, 313–322 (2015).
14. Filo, S. et al. Disentangling molecular alterations from water-content changes in the aging human brain using quantitative MRI. Nat. Commun. 10, (2019).
15. Callaghan, M. F., Helms, G., Lutti, A., Mohammadi, S. & Weiskopf, N. A general linear relaxometry model of R1 using imaging data. Magn. Reson. Med. 73, 1309–14 (2015).
16. Langkammer, C. et al. Quantitative MR Imaging of Brain Iron: A Postmortem Validation Study. Radiology 257, 455–462 (2010).
17. Wood, J. C., Fassler, J. D. & Meade, T. Mimicking liver iron overload using liposomal ferritin preparations. Magn. Reson. Med. 51, 607–611 (2004).
18. Gossuin, Y., Muller, R. N. & Gillis, P. Relaxation induced by ferritin: a better understanding for an improved MRI iron quantification. NMR Biomed. 17, 427–432 (2004).
19. Ogg, R. J. & Steen, R. G. Age-related changes in Brain T1 are correlated with iron concentration. Magn. Reson. Med. 40, 749–753 (1998).
20. Zhang, N. et al. A model for the analysis of competitive relaxation effects of manganese and iron in vivo. NMR Biomed. (2009)
21. Gelman, N., Ewing, J. R., Gorell, J. M., Spickler, E. M. & Solomon, E. G. Interregional variation of longitudinal relaxation rates in human brain at 3.0 T: Relation to estimated iron and water contents. Magn. Reson. Med. (2001).
22. Shtangel, O. & Mezer, A. A. A phantom system for assessing the effects of membrane lipids on water proton relaxation. NMR Biomed. 33, (2020).
23. Weiskopf, N. et al. Quantitative multi-parameter mapping of R1, PD*, MT, and R2* at 3T: A multi-center validation. Front. Neurosci. (2013)
24. Mezer, A. et al. Quantifying the local tissue volume and composition in individual brains with magnetic resonance imaging. Nat. Med. 19, 1667–72 (2013).
25. Fischl, B. FreeSurfer. Neuroimage 62, 774–781 (2012).
Figures